


Contents
- Example
- Another Example
- How Does The Accumulation Distribution Indicator Work?
- The Goal Of The Accumulation Distribution Line
- Using Accumulation Distribution Indicator To Confirm The Trend
- FAQs
- Conclusion
I feel that the Accumulation Distribution indicator is quite under-used.
It is a non-descript line often shown in a separate panel below the price chart.
The Squeeze indicator is a lot more sexy.
It doesn’t have all the bells, whistles, and colors of the MACD.
It doesn’t even have levels like the stochastic oscillator that tell you things like oversold or overbought.
And it is much more difficult to spell than RSI.
In this article, I will try to spell it out completely as an “Accumulation Distribution” line or indicator instead of abbreviating it as A/D, which can be misconstrued as an Advanced/Decline line (that is something else entirely different).
The predictive abilities of the Accumulation Distribution Indicator are quite powerful.
Let me show you by way of a couple of examples:
Example
Take a look at the S&P 500 Index (SPX) at the end of 2022 and going into 2023.
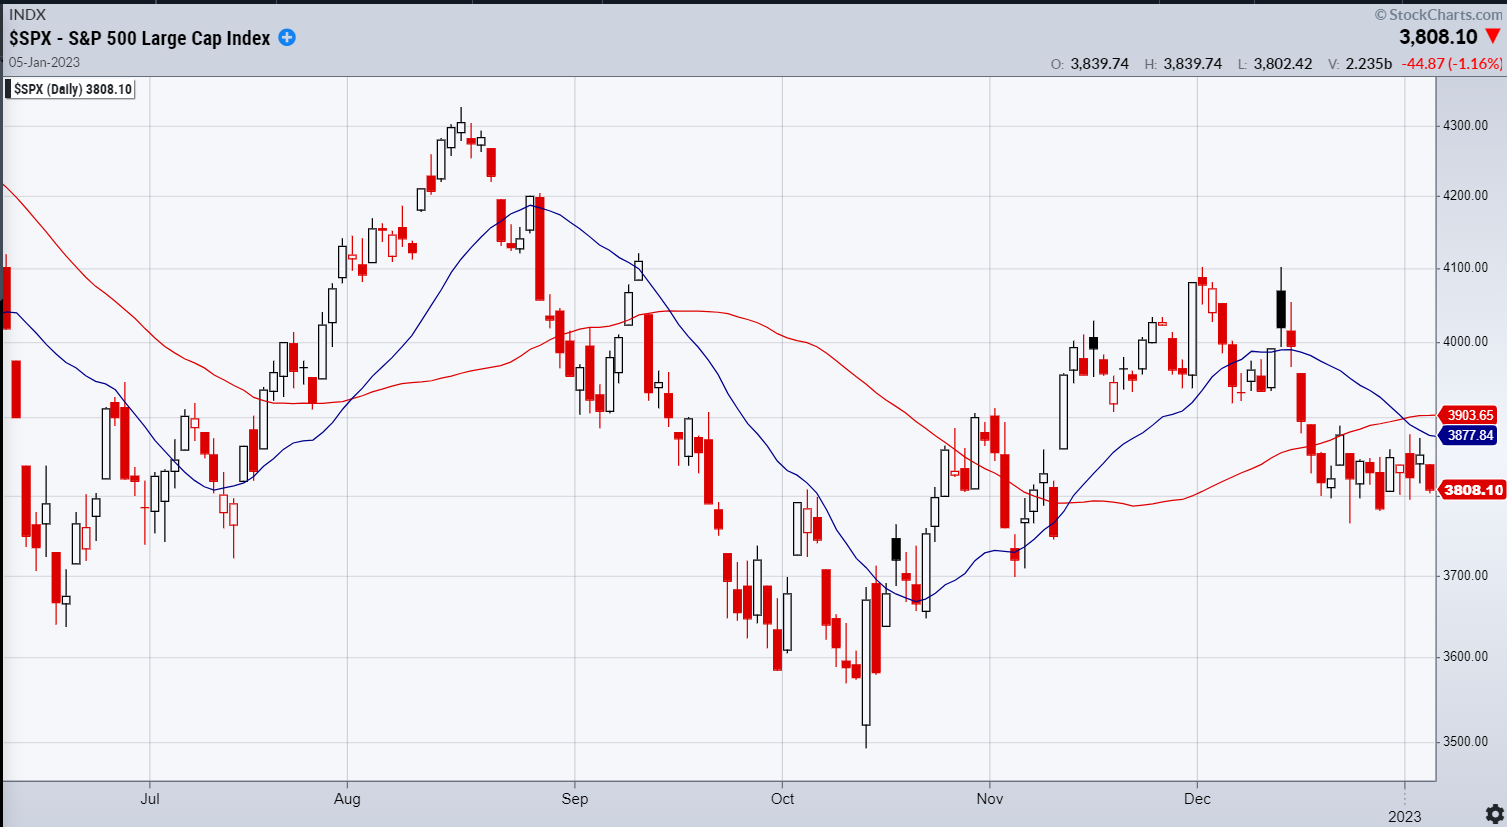
source: stockcharts.com
The price is moving sideways around the 1850 level.
The question is when it breaks out of this consolidation, will it go up or down?
Well, let’s turn on the Accumulation Distribution indicator on the bottom panel.
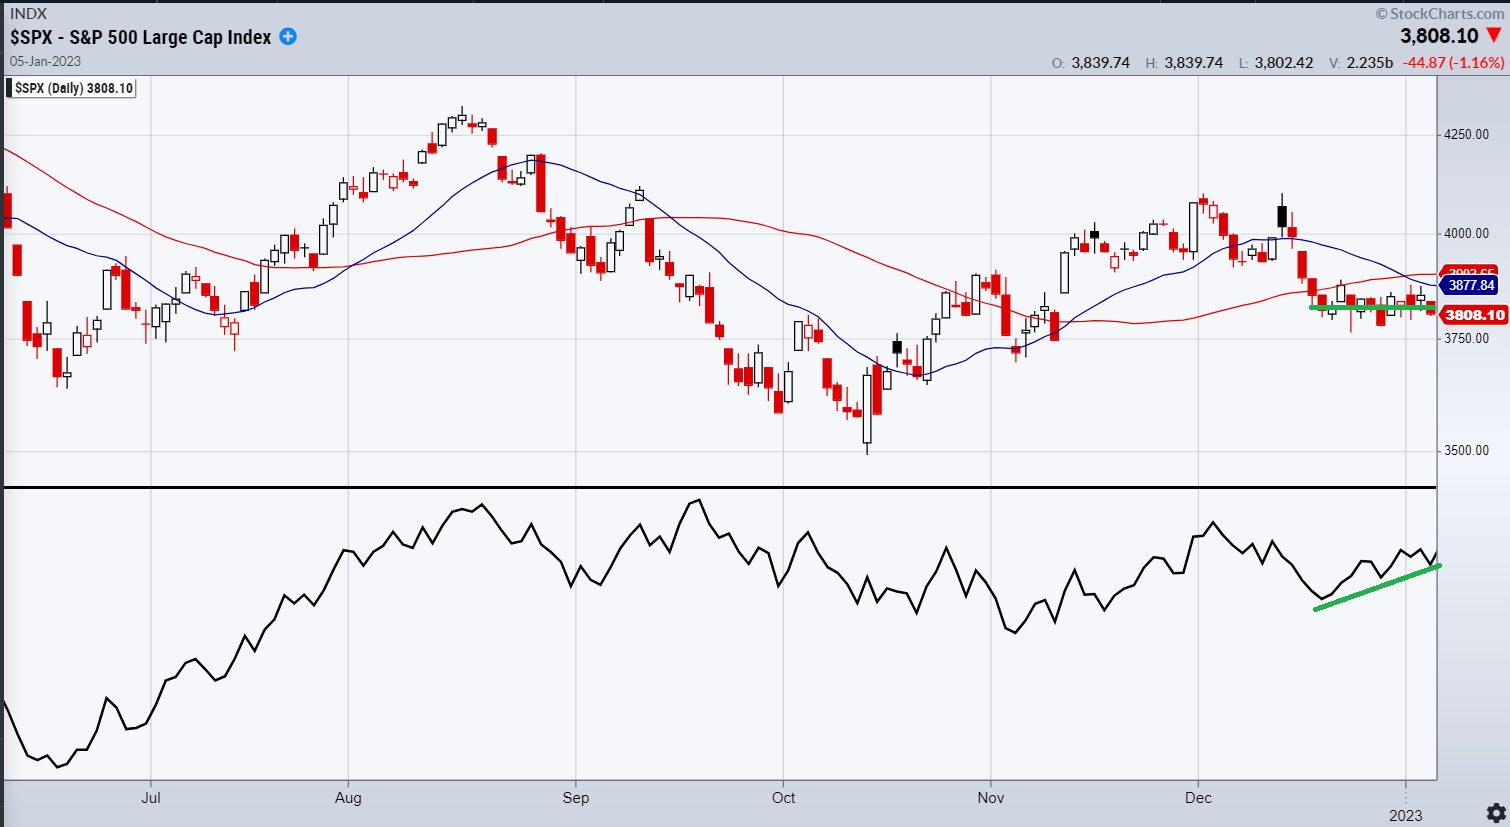
See the divergence. Price is moving sideways, but the Accumulation Distribution indicator is going up, indicating that the institutional buyers and smart money are accumulating the assets.
The actual value of the indicator line is not relevant. You want to look for whether the indicator is trending up or down. And then compare that to the price chart.
Is the indicator right? Advancing the chart for a few days, we see:
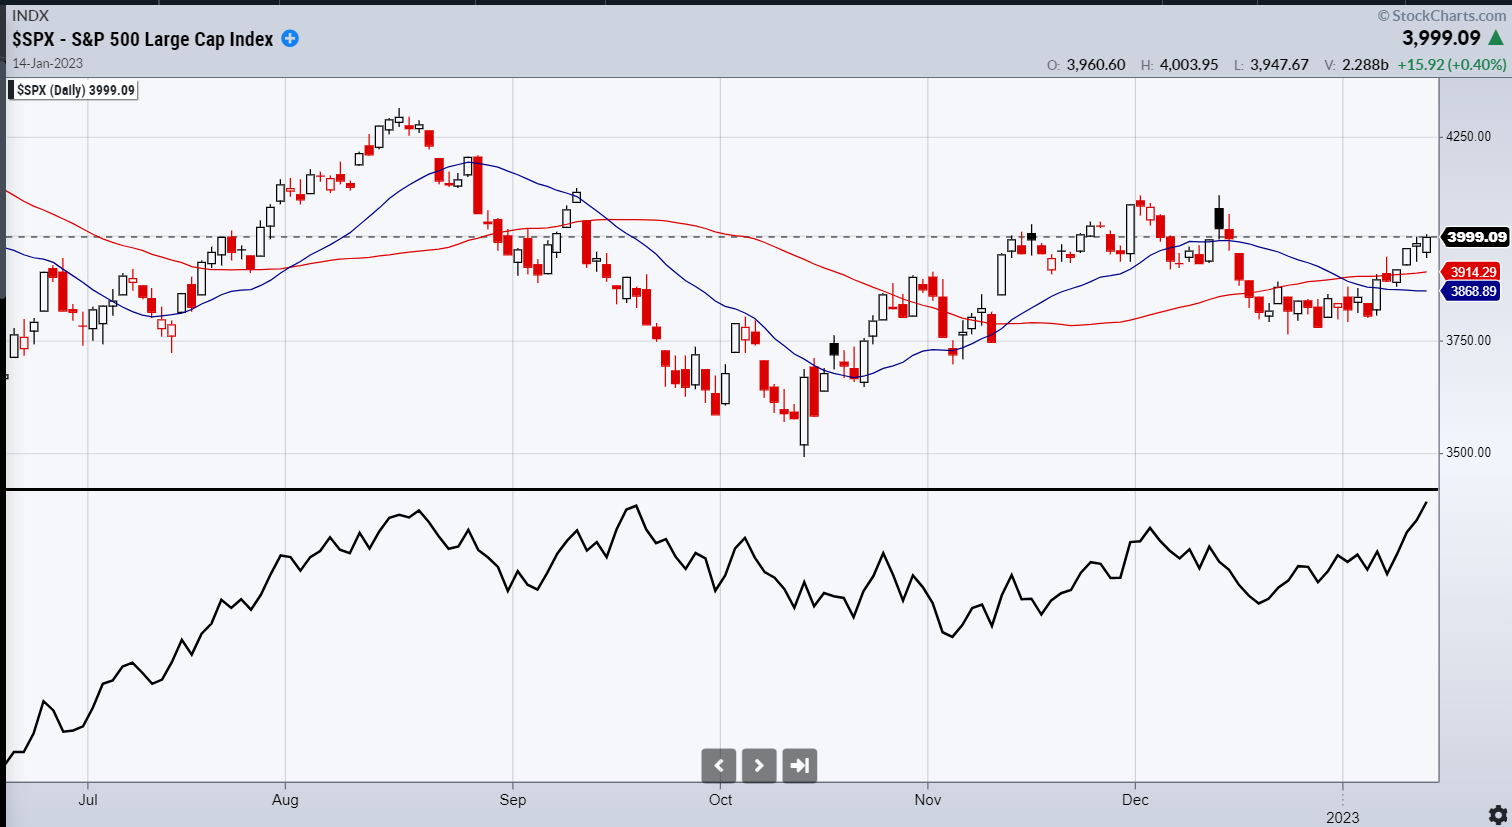
Yes, it was, in this case.
The price breaks out to the upside, crossing above the 20 and 50 moving averages.
Another Example
Here is another example in the December 2022 timeframe for the stock Medtronic (MDT):
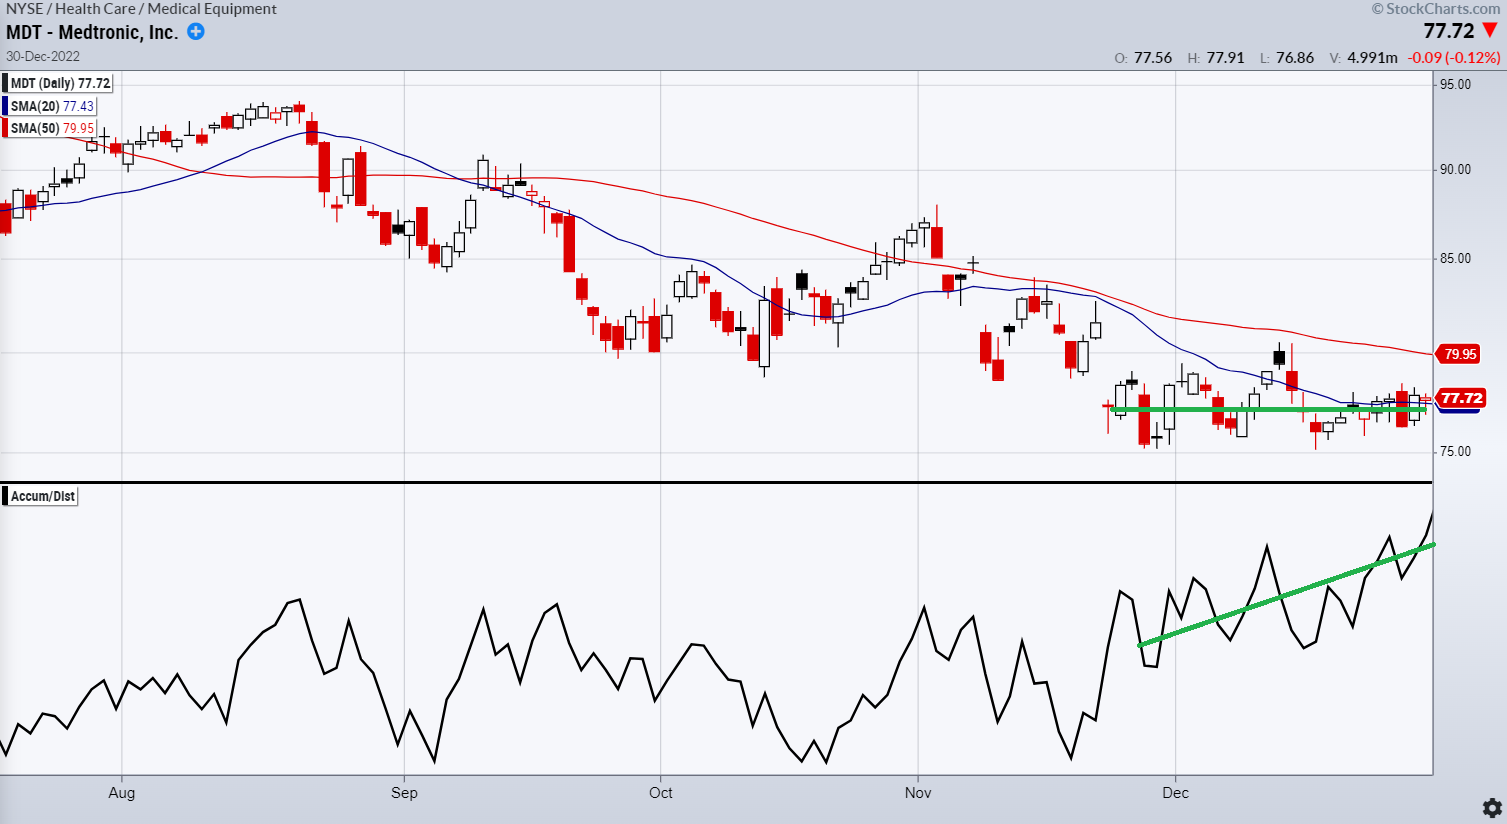
You can eyeball it roughly, as in the above. Or you can draw it more precisely by connecting the valleys of the graphs like this:
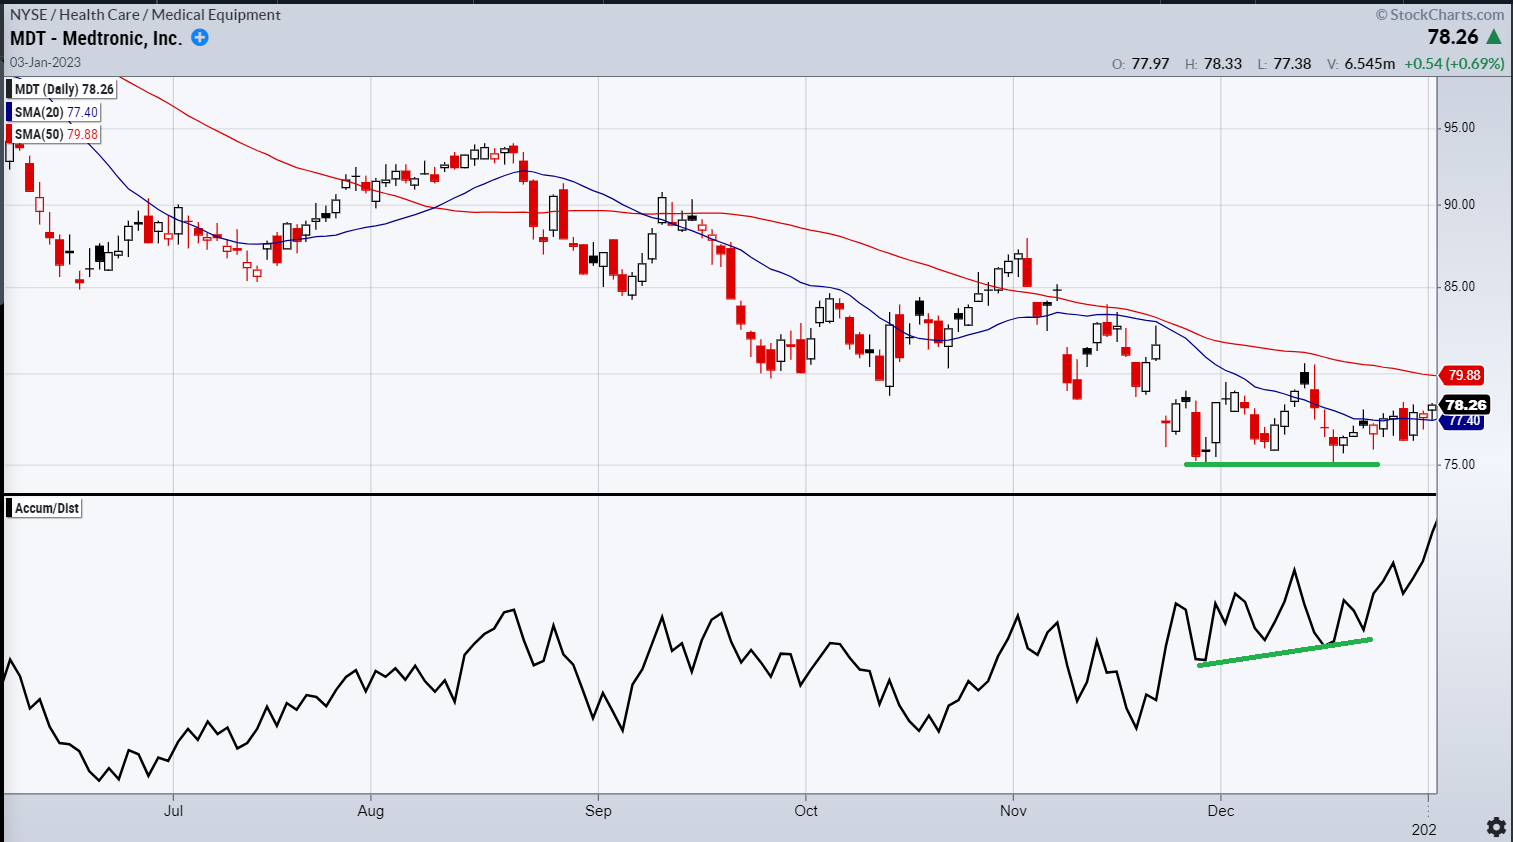
Either way, there is a divergence. The price reveals nothing but sideways action. But the Accumulation Distribution line suggests that something is happening beneath the surface.
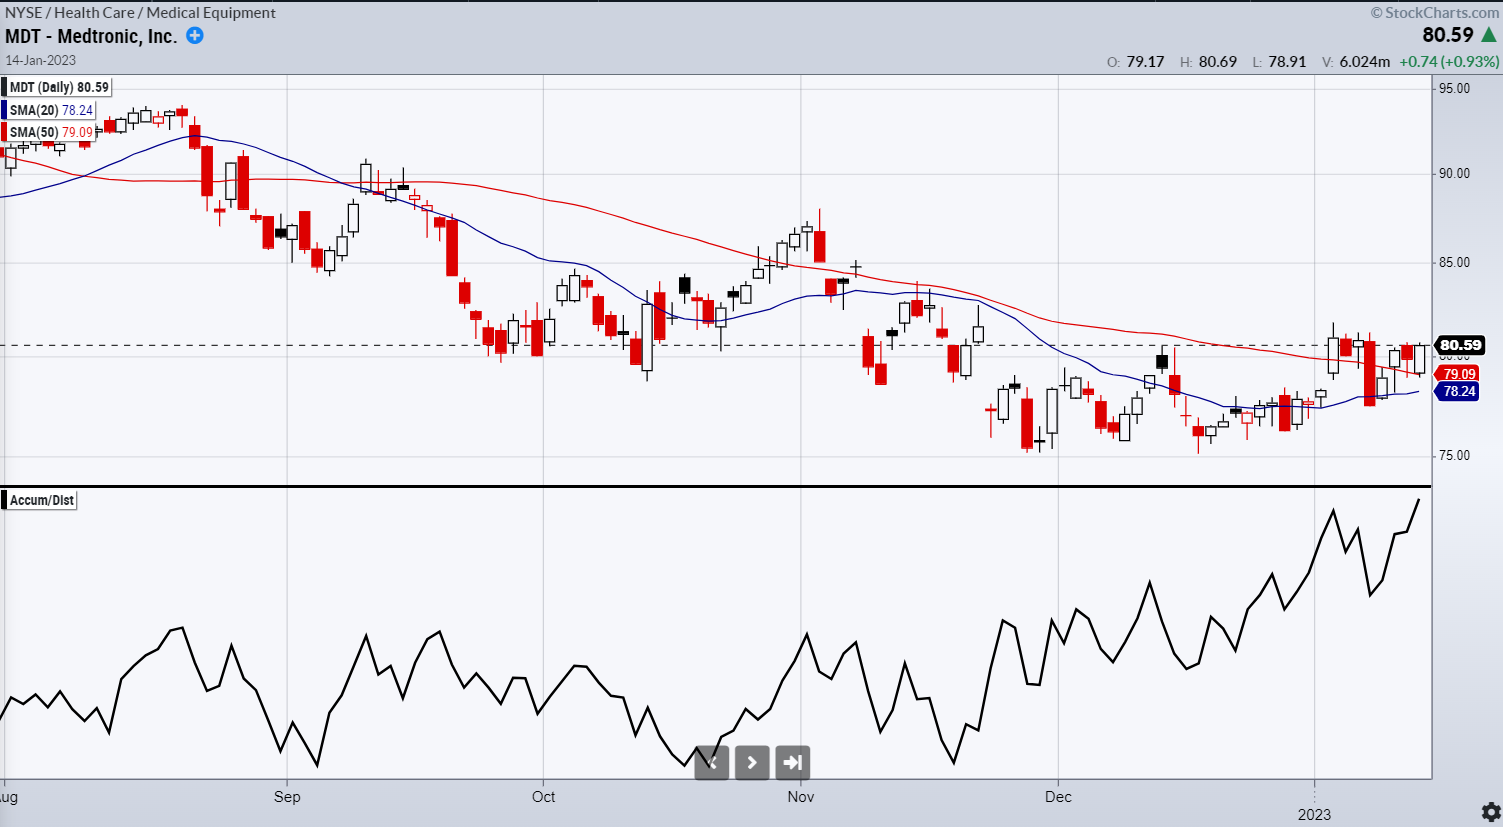
A few days later, we see that the price moves up to the next price level now to resting above the 50-day moving average.
How Does The Accumulation Distribution Indicator Work?
The Accumulation Distribution Indicator is in the category of momentum indicators. But unlike some of the other popular momenta indicators like the RSI and MACD, it uses price volume in its calculation.
The idea is to determine if the trading volume is large enough to support the price move.
The calculation of the indicator is quite complex, which you can look up elsewhere, so I will not repeat it here.
It is an accumulator calculating the current A/D by taking the previous A/D plus the current period money flow volume.
The money flow volume is the money flow multiplier times the period volume.
The money flow multiple is derived from the candlestick’s close, high, and low to determine how strong the buying or selling is.
Conceptually, the buying is strong when the close is near the top of the candlestick’s range.
The selling is strong when the close is in the lower portion of its range.
The Goal Of The Accumulation Distribution Line
The goal of the indicator is to spot large institutional buying and selling, who often have millions of dollars of assets under management.
When they are trading this gigantic sum of money, they cannot buy a stock with the entire sum.
Otherwise, it will drive the price up, and they cannot buy at the low price that they want.
Hence they try to accumulate the stock a little at a time so that it doesn’t affect the price and so that others do not see what they are doing.
If others knew, they might follow and again drive up the stock price.
In our examples, where we only see the stock price moving sideways, the institutions are doing a good job covering their footsteps.
However, the Accumulation Distribution line shows momentum that is hidden from the price chart.
Oliver Velez, a well-known day trader, and educator who has a proclivity for coming up with memorable analogies, says that big institutions are like elephants trying to tiptoe their way into a water bathtub without making its water rise.
They first put in one foot slowly and then put in another.
Using Accumulation Distribution Indicator To Confirm The Trend
The Accumulation Distribution indicator is often used to detect price divergence, as we had done in the previous two examples.
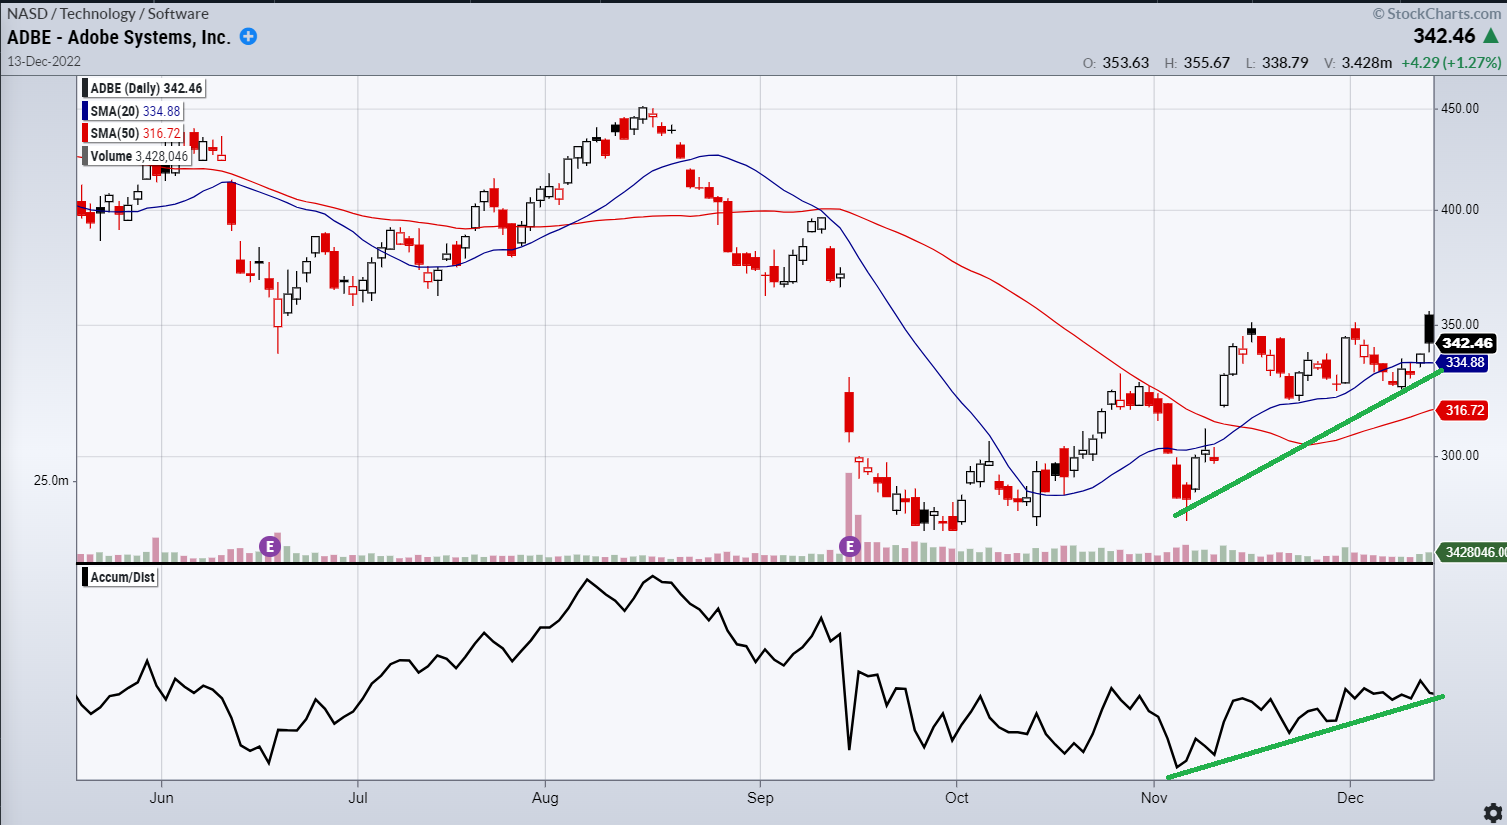
However, it can also be used to confirm a trend.
Here is Adobe (ADBE), where both the price and the indicator are trending up.
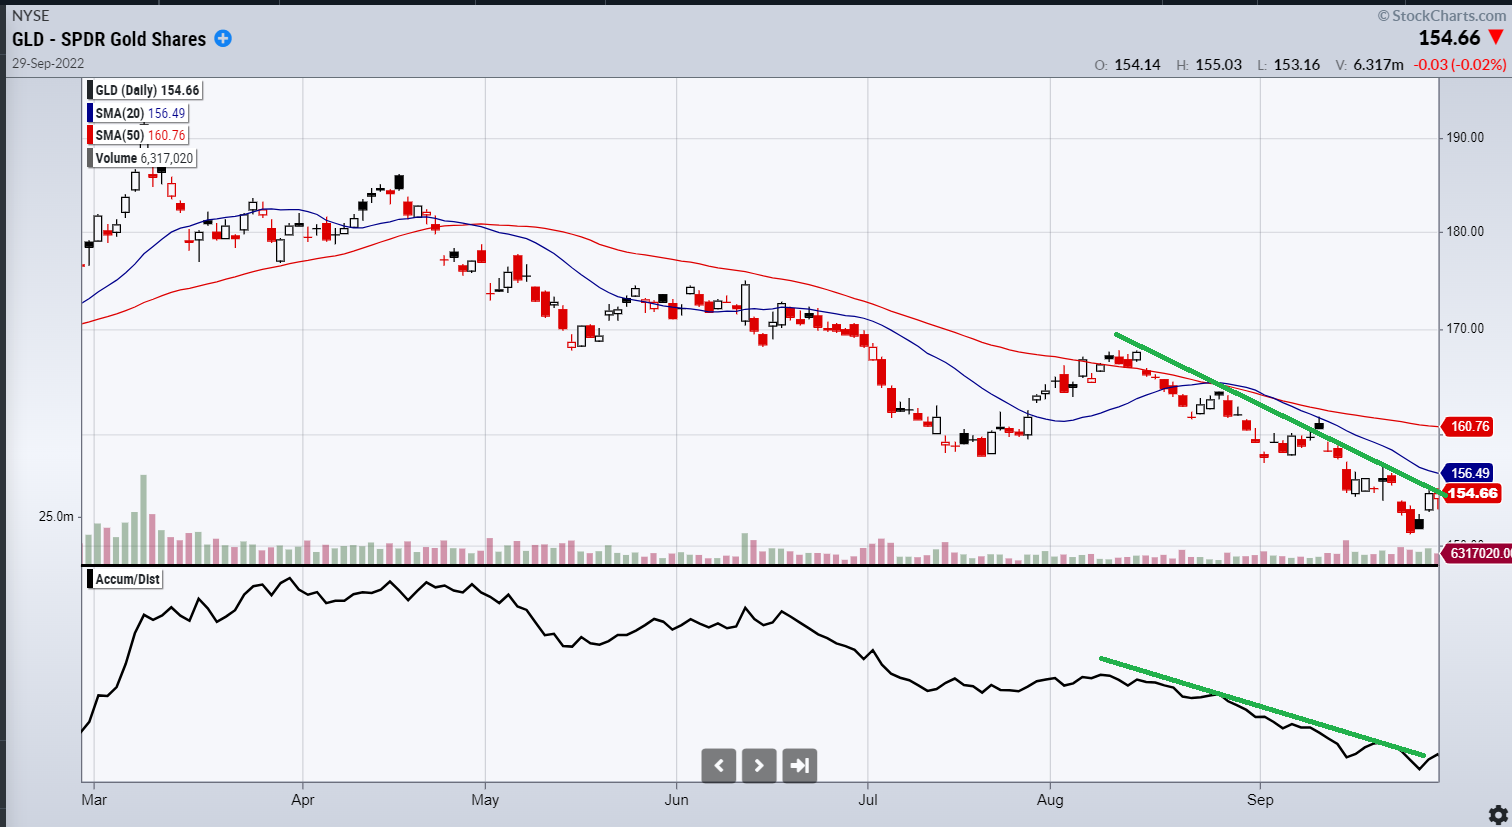
Here is the gold ETF (GLD), where the Accumulation Distribution line confirms the downtrend of the price chart.
FAQs
Who developed the Accumulation Distribution Line indicator?
The Accumulation Distribution Line was developed by Marc Chaikin, a stock analyst and founder and CEO of Chaikin Analytics.
Is the Accumulation Distribution Line the same as the Advance/Decline line?
No, these are not the same. The advance/decline line is a market breadth indicator that tells us the number of advancing versus declining stocks.
How is the Accumulation Distribution Line indicator different from the OBV indicator?
Both the Accumulation Distribution indicator and the on-balance volume indicator (OBV) take volume into account in determining buying and selling pressure. However, they use volume in slightly different ways.
Both indicators are accumulators. The Accumulation Distribution accumulates based on the position of the closing price to the high and low price of the candlestick.
The OBV accumulates based on whether the closing price is above or below the previous day’s closing price.
The OBV indicator was developed by Joseph Granville, who believes that a significant increase in volume without a change in stock price will eventually cause the price to jump up or down.
How is the Accumulation Distribution indicator different from the Money Flow Index?
Like the Accumulation Distribution Indicator, the Money Flow Index uses volume to determine the buying and selling pressure.
The main difference is that the Money Flow Index is an oscillator, while the Accumulation Distribution indicator is an accumulator.
The Money Flow Index being an oscillator, ranges from values of 0 to 100, where under 20 is considered oversold and over 80 is overbought.
Conceptually, you can think of the Money Flow Index as an RSI that incorporates volume information.
Conclusion
I like using the Accumulation Distribution Indicator quite a bit. Now you know why I typically add this indicator to my charts.
We hope you enjoyed this article on the Accumulation Distribution Indicator. If you have any questions, please send an email or leave a comment below.
Trade safe!
Disclaimer: The information above is for educational purposes only and should not be treated as investment advice. The strategy presented would not be suitable for investors who are not familiar with exchange traded options. Any readers interested in this strategy should do their own research and seek advice from a licensed financial adviser.


Very informative. Thanks for the article Gavin.
Great article and very useful. Thanks Gavin!
Great article. Practical and very easy to understand and use.
Thanks, glad you liked it.
Great article Gavin
Where can you find this indicator/ information
Does MarketSmith/IBD have it
I use StockCharts to see it.
Very informative ,and very good explanation, I understand very well,even my English is not good ,thank you .