


If you ever wished you had the popular TTM Squeeze indicator on your charting platform, then this article is for you.
While this indicator is on ThinkOrSwim and Barchart, it is not present in TradingView, StockCharts, and others.
As an alternative, we will use standard indicators to detect squeezes which give a trader an early warning when a stock is about to make a meaningful move.
Before you dismiss this as “just another indicator,” watch how its creator John Carter takes Squeeze setups with options strategies.
He said, “if there is one setup that I can do for the rest of my life, that’s it right there.”
Taylor Horton said, “you can build a career around this one setup,” and that it was the squeeze setup that allowed him to become a full-time trader.
Contents
- Introduction
- Examples
- Using Bollinger and Keltner Channels
- Using Options With The TTM Squeeze Indicator
- Bull Put Spread
- Long Call
- Long Call Diagonal
- A Long Call With Bear Call Spread
- When The Squeeze Fails
- In Summary
- FAQ
Introduction
Like all indicators, you cannot just take every squeeze signal.
You need to be more selective and wait for additional market conditions.
John buys after waiting for five “dots” of the squeeze, and if the price is above the 21 moving average and the other 8, 21, 34, 55, and 89 moving averages are stacked in order.
Traders can also use the 10, 20, and 50 moving averages.
Taylor buys on squeeze signals only when the stock is in an obvious uptrend and price is above and close to the 21-day moving average.
In both their presentations, they are using the “Pro” version of the indicator where there are additional “black” (low-compression) and “orange” (high-compression) dots.
The free version on ThinkOrSwim and Barchart has only the red dots and the green dots and may be labeled as “TTM_Squeeze.” “TTM” stands for “Trade the Markets,” which was John’s company before it was rebranded to “Simpler Trading.”
The red dots indicate that a squeeze is on — energy is building up under compression.
When the dots become green again, it indicates that the squeeze had just “fired,” releasing its built-up energy causing the stock to make a “greater than expected” move (up or down).
This “greater than expected move” means a 2 to 3 ATR move as indicated by the “Average True Range” indicator.
It also means a move greater than the options prices have priced in.
Examples
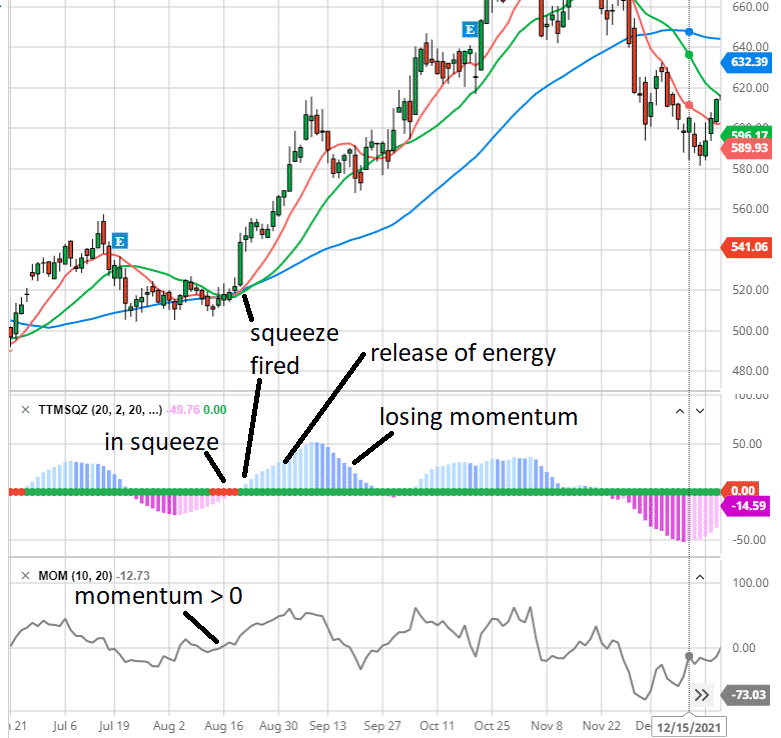
Here is a squeeze in Netflix (NFLX) from August 11th to the 18th of 2021, as indicated by a series of red dots.
source: barchart.com
I would wait until you get a few red dots to consider it a valid squeeze.
The price action will show that the stock is in consolidation.
The next green dot following the series of red dots on the 19th means the squeeze had fired.
This coincided with the tall bullish green candle.
The histogram on the squeeze indicator is above zero and increasing, indicating energy being released, and we see the stock price make a greater than expected move up.
The moving average was bunched up during the squeeze.
And now, the 10, 20, and 50-day moving averages are expanding in sequential order.
On September 9th, the histogram changed color and started decreasing.
This indicates a loss of momentum and is a good time to exit the swing trade.
Some recommend getting into position during the squeeze before the green dot appears. That way, you catch the full move of the big green candle.
Waiting until the green dot to appear may be too late in some cases.
The only difficulty is that you don’t know which direction the stock will run when it fires.
However, you can get clues from the price action and the prevailing trend.
John says to look at the momentum indicator — readings above zero suggest an up move, and readings below zero suggest a down move.
The next example is a bearish example of Oracle (ORCL) under squeeze. It showed red dots from November 22nd to the 29th of 2021.
Oracle Example
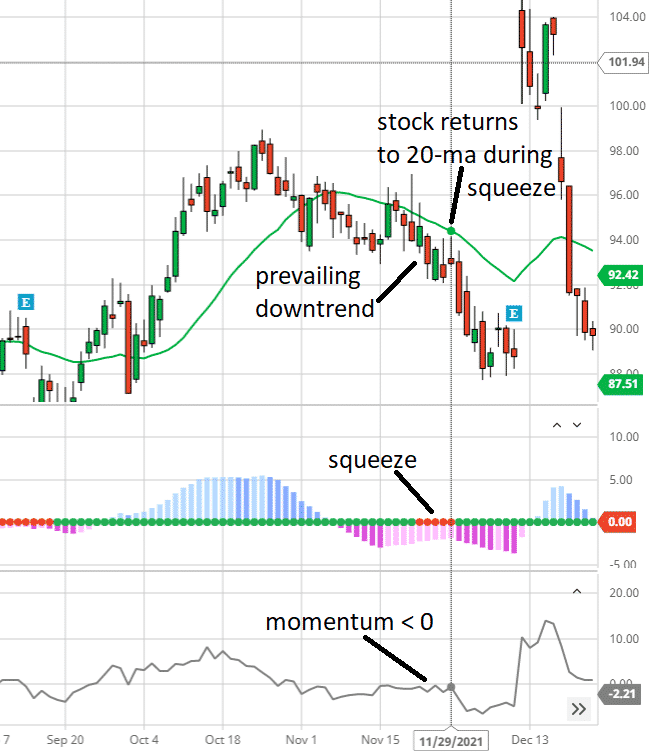
source: barchart.com
Using Bollinger and Keltner Channels
The squeeze indicator is based on the relationship between the Bollinger Bands and the Keltner Channels.
Below is a chart of Netflix on StockCharts.
The Bolling Bands (in blue) is at its standard settings, with the upper and lower bands representing a 2-standard deviation from the 20-period simple moving average.
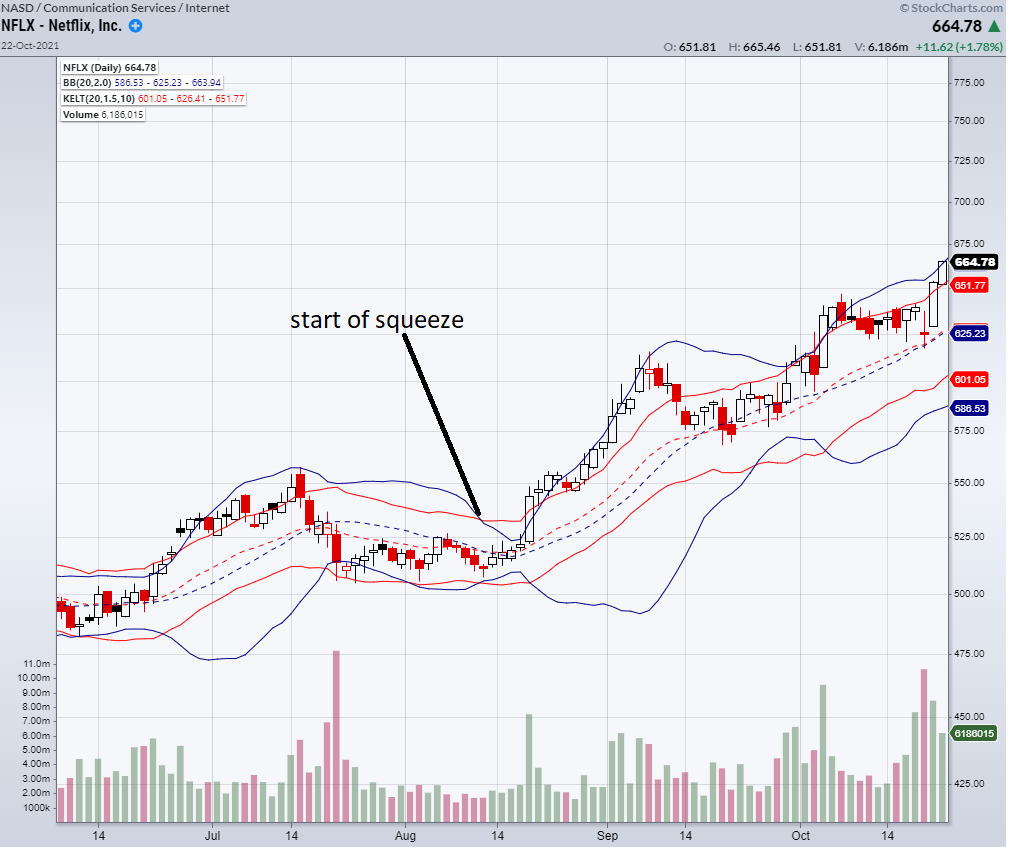
source: stockcharts.com
You might need to adjust the Keltner channel (shown in red above) to have its upper and lower bands set to 1.5 ATR (average true range) from its 20-period exponential moving average.
A squeeze happens when the Bollinger bands get narrow and start to go inside the Keltner channel.
And we do the same on Trading View for Oracle.
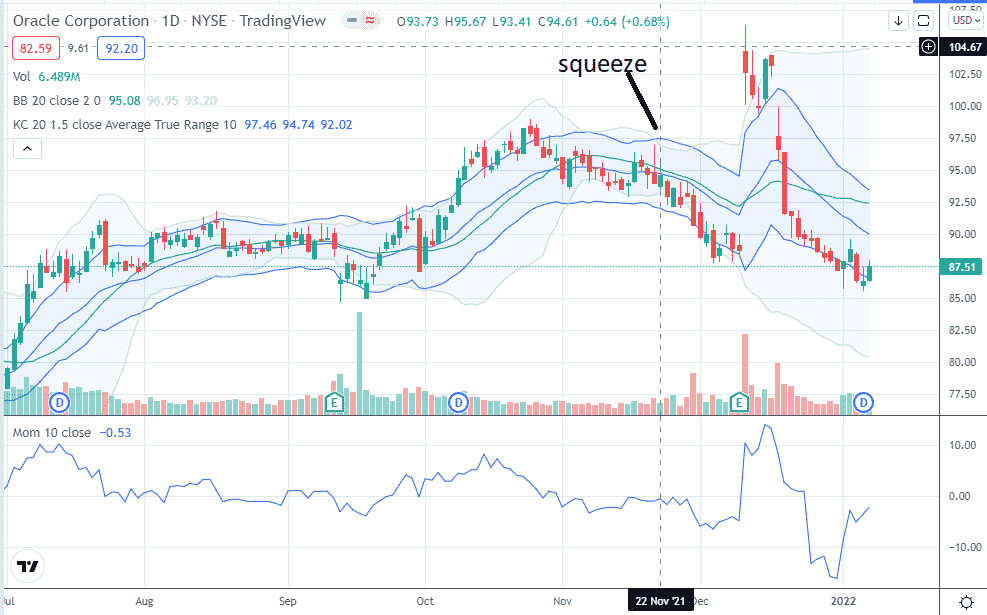
In both these cases, we see that this method of detecting squeeze coincides with the red dots appearing in the squeeze indicator fairly well in many (but not all) cases.
What we don’t have is a nice visual histogram of the squeeze indicator.
The histogram is a smoothed-out version of the momentum indicator.
I admit that the squeeze indicator is more visually appealing and easier to read.
But at least now you have an alternative if you don’t want to switch back and forth between two different charting platforms.
Using Options With The TTM Squeeze Indicator
Look at how nicely the 8, 21, 34, 55, and 89 moving averages are stacked in sequence when the squeeze on Lowe’s (LOW) fired on October 14th, 2021.
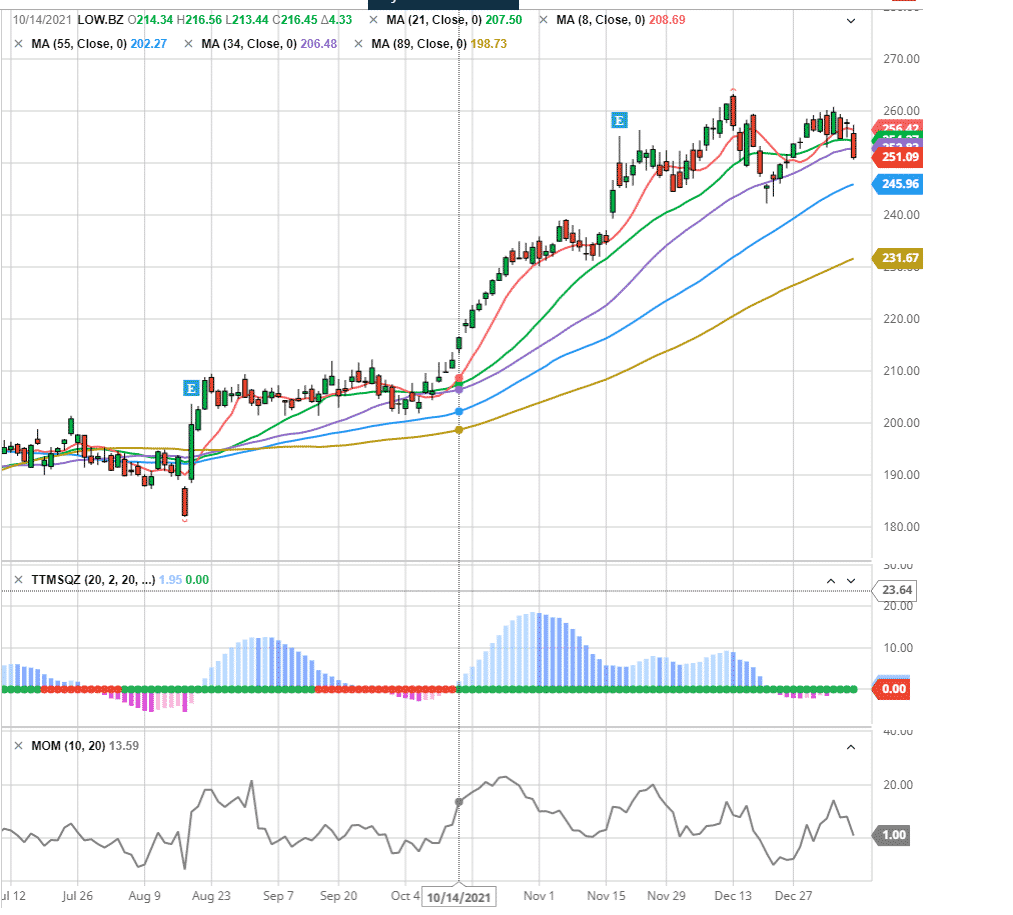
It was a real long squeeze that started on September 19th when the price went flat for a month.
Let’s see some ways an investor could have traded this with options.
Bull Put Spread
Suppose a trader initiated a bull put spread on September 21st after seeing five red dots.
Date: Sep 21
Sell two Oct 29 LOW $195 puts at $2.57
Buy two Oct 29 LOW $185 puts at $1.23
Credit: $1.34
The trade reached 50% of its max profit on October 7th, where the price was still in consolidation (even before the squeeze even fired).
That’s because credit spreads can make money as time passes, even if the price doesn’t move much.
The investor exits the spread to collect $134 in profit.
Since squeeze did not fire yet and the trade thesis is still the same, the investor put on another credit spread further dated out.
Date: Oct 7
Sell two Nov 19 LOW $195 puts at $3.58
Buy two Nov 19 LOW $185 puts at $1.87
Credit: $1.71
This spread picked up another $171 (50% of max profit) on October 14th, which is when the squeeze turned green.
Since there is still time to expiration in this spread, the investor rolls up the spread closer to the price with the short put at around 20-delta.
Date: Oct 14
Buy to close two Nov 19 LOW $195 puts at $1.58
Sell to close two Nov 19 LOW $185 puts at $0.82
Sell to open two Nov 19 LOW $200 puts at $2.28
Buy to open two Nov 19 LOW $190 puts at $1.12
Credit: $0.41
On October 19th, the P&L on this trade is $310 and is getting close to its maximum profit potential.
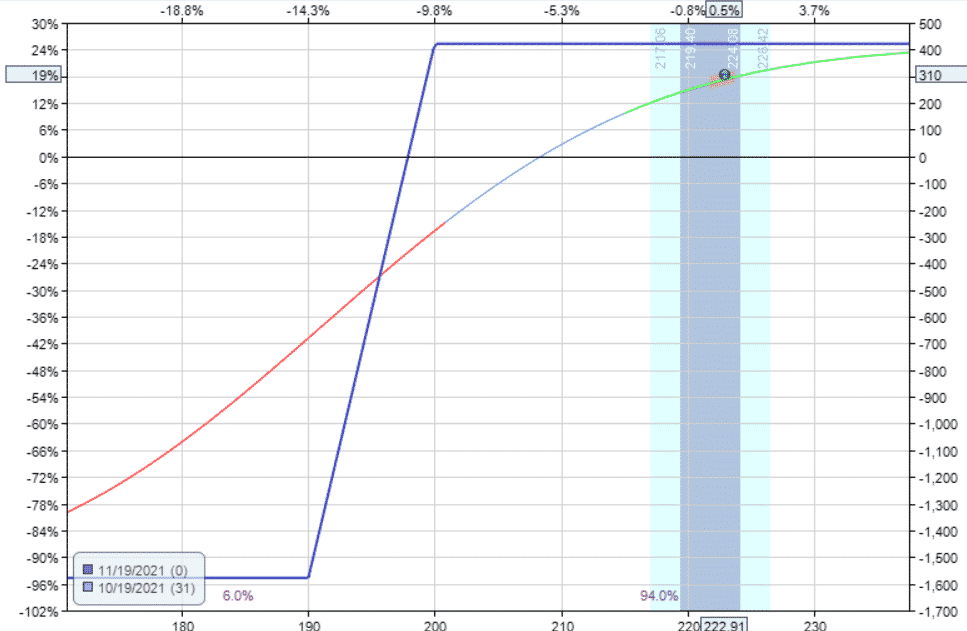
Rolling Up
The investor rolls up again, giving the spread more room to move on the upside.
Date: October 19th
Buy to close two November 19th LOW $200 puts at $1.18
Sell to close two November 19th LOW $190 puts at $0.62
Sell to open two November 19th LOW $207.5 puts at $2.09
Buy to open two November 19th LOW $197.5 puts at $1.00
Credit: $0.53
Rolling up again on October 25th.
Date: Oct 25
Buy to close two Nov 19 LOW $207.5 puts at $1.00
Sell to close two Nov 19 LOW $197.5 puts at $0.51
Sell to open two Nov 19 LOW $220 puts at $2.71
Buy to open two Nov 19 LOW $210 puts at $1.19
Credit: $1.03
On November 1st, the squeeze histogram shows a downturn and changed color, indicating that stock is losing momentum.
The investor exits on November 1st with a P&L of $441, or 27%. Coupled with the profits from the first trade of $134, this totals to $575.
Long Call
What if the investor purchased an in-the-money long call instead.
Date: September 21st
Buy one November 19th LOW $200 call at $13.05
On October 7th, the trade is at break-even.
On October 14th, the day the squeeze fired, the long call showed a 34% return with a profit of $447 from an initial capital of $1305.
Holding until the squeeze histogram changed color on November 1st, the profit is now $2008, a 154% return.
Long Call Diagonal
One drawback of a long call is that if you hold it while waiting for the squeeze to fire, the call loses value day by day with time (assuming all other factors are equal).
By selling short calls against the long call, we offset the time decay and have positive theta, meaning that the spread gains value as time passes.
Let’s see how the long diagonal does.
Date: Sep 21
Buy one Nov 19 LOW $200 call at $13.05
Sell one Oct 15 LOW $215 call at $1.79
Debit: –$11.26
On October 7th, the P&L is $125, or 11%.
We rolled the short call on October 11th when it had only four days till expiration.
Date: October 11th
Buy to close one October 15th LOW $215 call at $0.61
Sell to open one October 29th LOW $220 call at $0.83
Credit: $0.22
On October 14th, the day the squeeze fired, the long call diagonal showed a 45% return with a profit of $517.
Rolling the short call again.
Date: October 25th
Buy to close one October 29th LOW $220 call at $11.43
Sell to open one November 12th LOW $240 call at $0.96
Debit: –$10.47
Holding until the squeeze histogram changed color on November 1st, the long call diagonal has profits of $1058, a 49% return.
Long Call With Bear Call Spread
Another way to offset the negative theta decay of the long call is to sell bear call spreads against it. To fully offset the negative theta, we needed three bear call spreads to bring theta back to positive.
Date: September 21st
Buy one November 19th LOW $200 call at $13.05
Sell three October 15th LOW $215 call at $1.79
Buy three October 15th LOW $222.5 call at $0.57
Debit: –$9.38
The payoff diagram shows that the upward sloping T+0 line is not capped on the upside (unlike the long diagonal).
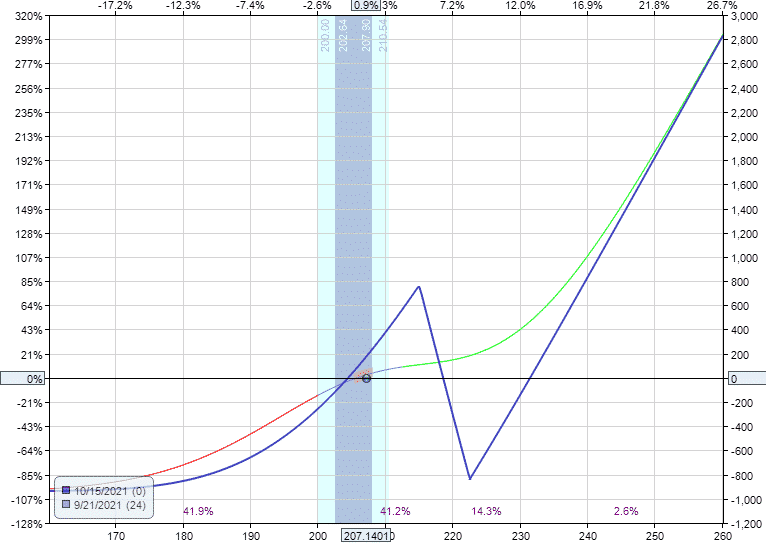
source: OptionNet Explorer
On October 7th, the P&L is $225, or 24%.
It is also time to roll the bear call spreads because the T+0 line is bent.
source: OptionNet Explorer
We have to roll the bear call spread further out in time.
Date: October 7th
Buy to close three October 15th LOW $215 call at $0.55
Sell to close three October 15th LOW $222.5 call at $0.08
Sell three October 29th LOW $215 call at $1.67
Buy three October 29th LOW $225 call at $0.31
Credit: $0.89
On October 14th, the P&L is $221 at 19%.
We roll again.
Buy to close three October 29th LOW $215 call at $3.30
Sell to close three October 29th LOW $225 call at $0.44
Sell to open three November 19th LOW $230 call at $1.95
Buy to open three November 19th LOW $240 call at $0.70
Debit: –$1.61
The trade ends on November 1st with a P&L of $837.50, a 71% return.
When The Squeeze Fails
The example we showed in LOW may sound great as you read this.
But in reality, these trades do not come very often.
It took me a lot of time looking back through many charts to find you this example.
Also, there are plenty of examples where the squeeze fails.
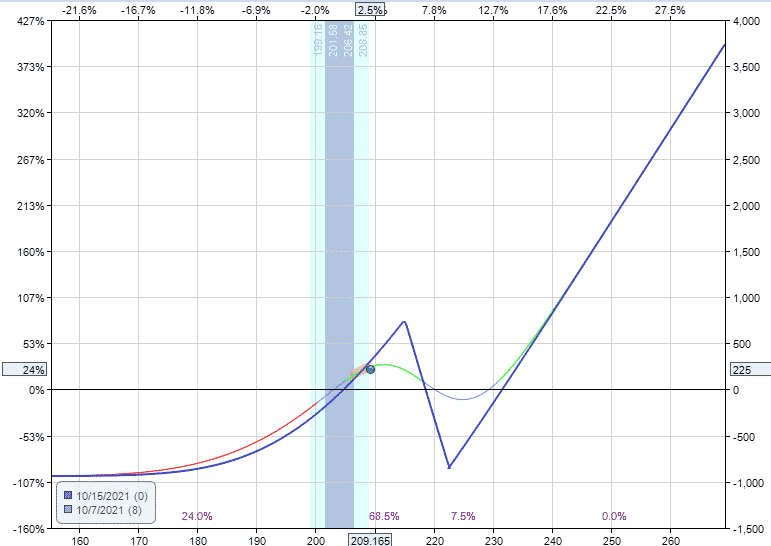
Suppose an investor bought a long call on the 5th red dot of the squeeze in Bristol-Myers Squibb (BMY) on August 24th, 2021.
Buy four October 15th BMY $67.5 calls at $2.44 for a total investment of $976.
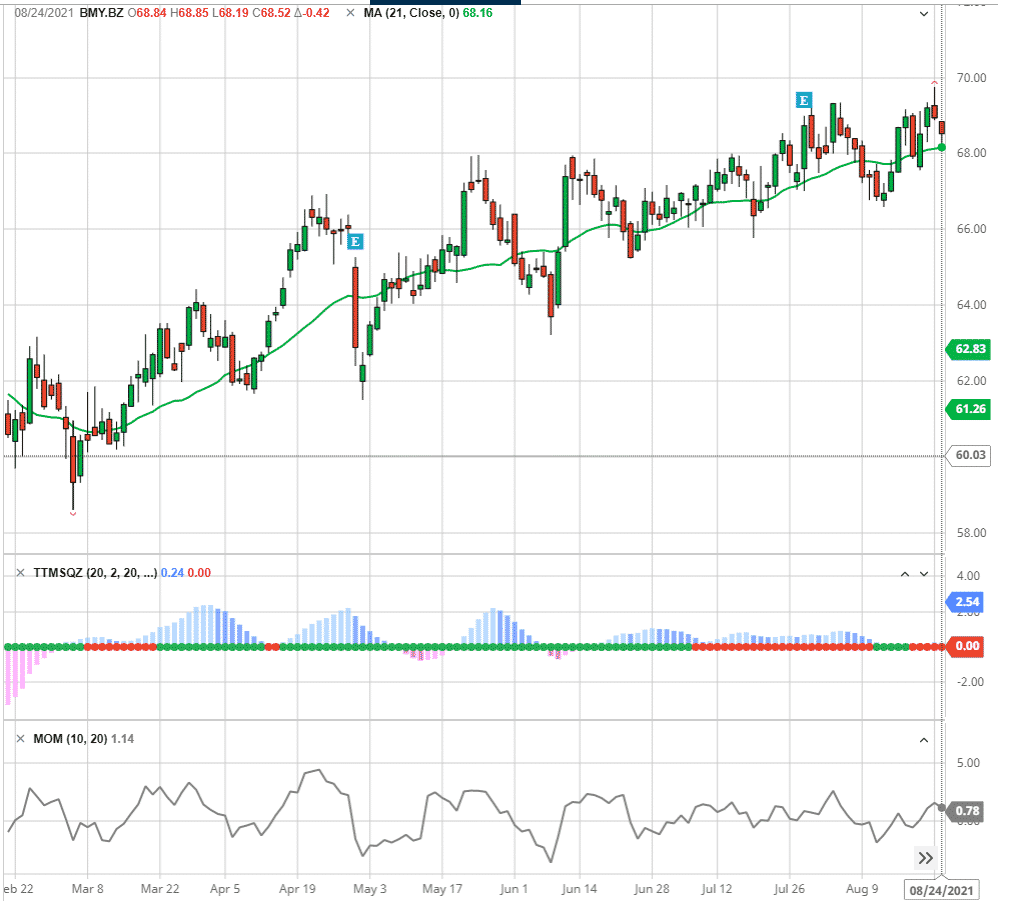
The 20-day upward sloping moving average and the positive momentum indicator both suggest that the price would go up when the squeeze is triggered.
But what happened was that the squeeze triggered a trend reversal.
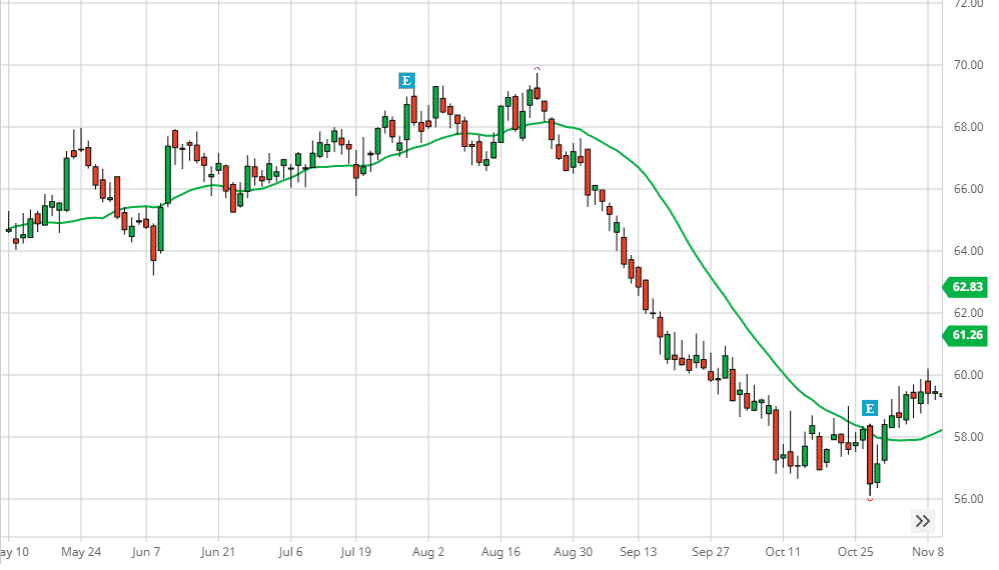
Oops. How much money the investor would have lost depended on when the investor decided to abandon the trade.
Exiting on September 1st on that big red candle that broke support at the $66.50 price level would be wise. The long call would have lost 66% of its value, and the investor would have lost –$644.
If held till September 13th, the long call would have lost more than 90% of its value, and the stock still has not finished falling.
The stock didn’t stop falling until after the long call expired.
In Summary
The ttm squeeze indicator is a great timing tool for directional and swing traders to tell the trader when a meaningful move is about to come.
This lets the trader get in, extract some profits, and get out without being exposed to the markets in choppy conditions.
Non-meaningful back-and-forth action is tough to trade and is where many profits are lost.
It can still be of benefit to the non-directional trader.
Suppose you are in an iron condor with some profits and decide whether to stay longer or exit.
Well, if the stock is in a squeeze, the choice is clear — get out before the big move comes.
Next time you put on a calendar, check if the stock is in a squeeze.
The worst thing is to initiate a calendar after seeing the price consolidate and then make a move in one direction or another.
We’ll leave it there for now.
FAQ
What is a TTM Squeeze?
A TTM Squeeze is when a stock price is in tight consolidation and is about to make a big move as indicated by the TTM Squeeze indicator.
Is the TTM Squeeze a good indicator?
The TTM Squeeze indicator was developed by John Carter at the time when his company is called Trade The Market. It has gone through several iterations since then and is now called Squeeze Pro available at his new company SimplerTrading where he employs about a dozen traders. John himself as well as many of these traders uses the indicator as part of their technical analysis. So yes it is a good indicator.
What is the best time frame for TTM Squeeze?
The Squeeze indicator works on all timeframes. The Simpler Trading traders often trade in the intraday timeframe and talk about one hour squeeze, 5-minute squeeze, etc all the time. Yet they also look at squeezes in the daily and weekly and monthly timeframes as well.
How much is the TTM Squeeze Pro?
The Squeeze Pro can be purchased at SimplerTrading.com and is currently priced at $697 at the time of this writing.
Trade safe!
Disclaimer: The information above is for educational purposes only and should not be treated as investment advice. The strategy presented would not be suitable for investors who are not familiar with exchange traded options. Any readers interested in this strategy should do their own research and seek advice from a licensed financial adviser.


In all the examples above, the options entry was during or before the squeeze, why not take options trade (spread or long) after the squeeze ends for a directional bet! Wouldn’t it have more probability of winning considering we check momentum and stack moving averages?
Yes, we are taking a directional bet with options. In the examples, we put on the option position when the squeeze is in effect, meaning that the squeeze indicator dots are red (preferably on wait for the 5th red dot — because that is how John said he does it in the video). That way, we are already in position when the squeeze fires. The squeeze has fired when you see a green dot appear after the series of red dots. For some traders, they would like to wait for the green dot to appear before putting on the position because there is more certainty in the direction. That is fine too. The trade-off is that you catch the big move just slightly later. The choice is up to the trader’s personal style and preference.
Thank you, appreciate the response.
I like how John Carter says the trader’s job is to kill bad trades, very phylosophical