


The formation of different patterns on the trading charts reveals the action of buyers and sellers. Further, it also helps to understand and predict the price movement based on their actions. Today, we will be looking at one such pattern named Ascending Broadening Wedge.
Contents
- Definition of Ascending Broadening Wedge Pattern
- How to identify the Ascending Broadening Wedge Pattern
- Trading the Ascending Broadening Wedge Pattern
- Conclusion
Definition of Ascending Broadening Wedge Pattern
Ascending Broadening Wedge Pattern is often regarded as a bearish reversal pattern.
It is mainly because the formation of such a pattern in an uptrend usually signals a reversal of a trend.
In addition, the pattern usually signals increased market volatility due to the buyers trying to maintain their control and the sellers trying to gain it.
The pattern is formed with price making higher highs and higher lows, and the price tends to fluctuate between the upper and lower trendlines.
The upper trendline seems steeper than the lower trendline, and the two lines diverge as the price volatility increases.
The price volatility indicates the tug of war between the buyers and sellers, eventually trying to overpower each other.
It does not mean exhaustion on the part of the buyers; rather, it indicates the sellers trying to gain control.
For such a pattern to form, the price must touch each trend line at least three times.
The volume tends to increase over time.
The break of the lower support line usually results in a fast and rapid fall, with the sellers entering into fresh short positions.
How To Identify The Ascending Broadening Wedge Pattern
An Ascending Broadening Wedge is formed with the price rising after making a low.
The price movement continues with the formation of higher highs and higher lows within a range.
The higher highs and higher lows representing the peaks and troughs are joined to form upper and lower trend lines.
The price oscillates between the two trendlines.
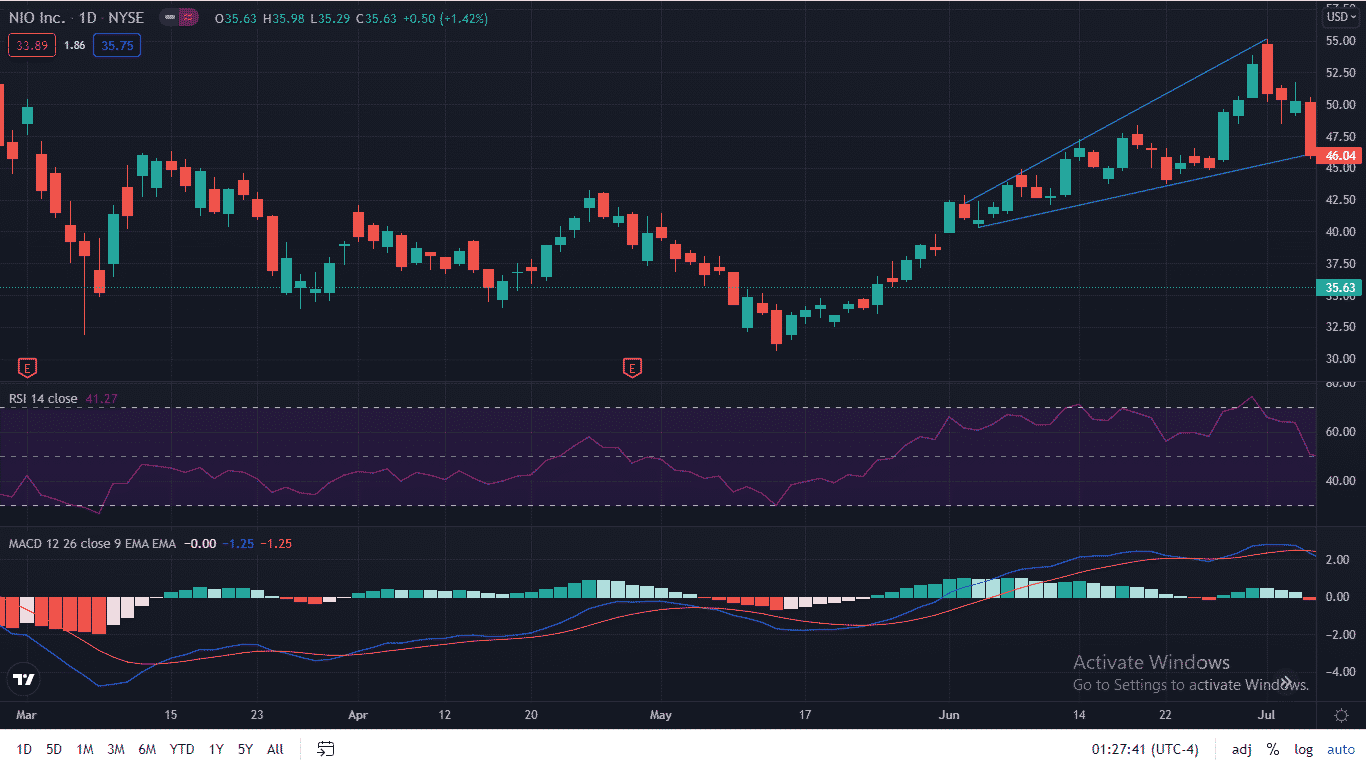
The chart below of NIO INC. (NIO) reveals the formation of Ascending Broadening Wedge on a daily timeframe in July’21.
The formation of the pattern starts on June’21.
It continues with the price oscillating between the upper and lower trendlines as it continues making higher highs and higher lows.
Trading the Ascending Broadening Wedge Pattern
The Ascending Broadening Wedge provides numerous trading opportunities for traders.
The traders often trade within the range and even the breakouts from the trendlines.
Usually, the probability of downside exit of the price from the range is higher than the upside.
Hence, a breakdown of the price below the lower trend line provides a perfect opportunity to short.
The chart below is of NIO Inc. (NIO) on a daily timeframe.
The price broke the lower trend line support with a gap down on July 8th’2021, only to retest it and continue falling further.
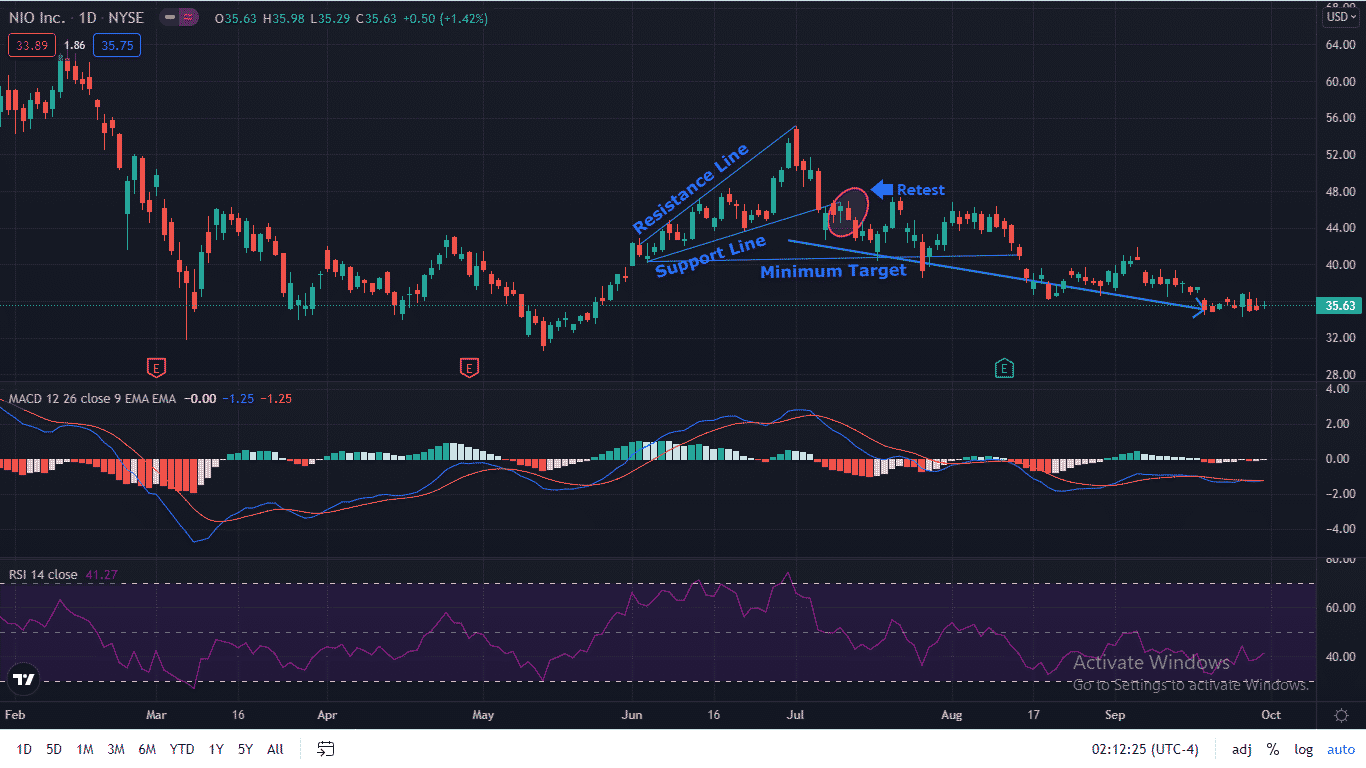
Traders can look for a short opportunity after the price retest the previous support trend line at around $47 for a minimum target of $40-41.
The stop-loss can be placed just above the support line.
Thus, it can be seen that the price has continued a downtrend after breaking the trendline support.
Most aggressive traders even prefer shorting at the resistance line at around $55 by placing a stop-loss above the previous high.
Shorting at the resistance line provides a more significant profit potential.
Though the breakout happens on the downside most of the time, the upside breakout of the price from Ascending Broadening Wedge Pattern can’t be neglected.
The upside breakout possibility is relatively lesser than the downside breakdown.
Traders can also use the pattern to trade the upside breakout.
Again, the potential target can be approx the price range of the pattern.
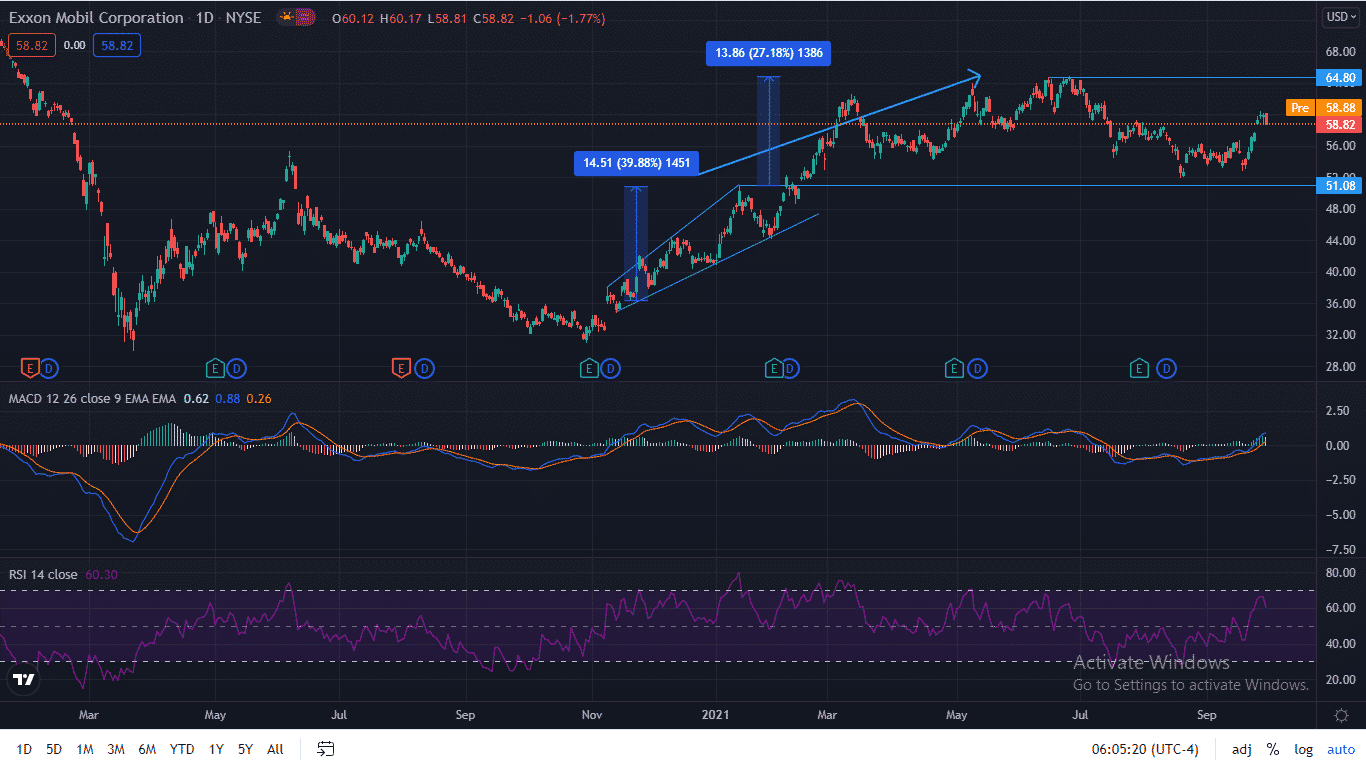
For example, the chart below is of Exxon Mobil Corporation (XOM) on a daily timeframe.
The downtrend preceded the formation of Ascending Broadening Wedge Pattern in the chart.
It can be seen that the price bounced back and crossed its upper resistance after having taken support at the lower trendline.
The traders can look for a potential long trade above the upper trendline, i.e., $51.
The potential target can be the price range of the pattern, which is approx $14-14.50.
The price touched a high of $64.92 in June’2021, an approximate increase of $14 after the upside breakout.
Conclusion
The Ascending Broadening Wedge pattern provides ample trading opportunities.
The formation of such a pattern in an uptrend generally indicates a probable bearish reversal.
Similarly, in a downtrend, it indicates a continuation of the bearish trend.
However, the probability of a potential upside breakout of the price from such a pattern cannot be ignored.
Though the upside breakout probability seems to be less than the downside breakdown, even such an upside breakout gives great trading rewards.
Trade safe!
Disclaimer: The information above is for educational purposes only and should not be treated as investment advice. The strategy presented would not be suitable for investors who are not familiar with exchange traded options. Any readers interested in this strategy should do their own research and seek advice from a licensed financial adviser.


