


Many sources claim the head and shoulders pattern to be one of the most reliable reversal patterns.
That is a bold claim, and we are not going to disagree.
What is important is to understand why it is a reversal pattern.
In this article, we will break down the pattern in terms of trend and trend reversal with the usual talk of higher highs and higher lows, etc.
With this understanding, you will come to realize that the triple top chart pattern is a variation of the Head and Shoulders, and hence is also a reversal pattern.
Contents
- Head And Shoulders Pattern Must Occur In An Uptrend
- Volume Analysis Of Head And Shoulders
- Trend Analysis
- Slanted Neckline
- Using The Zig Zag Tool
- Another Head And Shoulders Example
- Failed Head And Shoulders Pattern
- Double Top
- Triple Top
- Ambiguous Top
- Summary
Head And Shoulders Pattern Must Occur In An Uptrend
For the head and shoulders pattern to be a valid reversal pattern, it needs to occur in an existing uptrend.
There must be an existing trend for it to reversal. If you see something that looks like a head and shoulders in a middle of a sideways range, it is to be ignored.
An uptrend is defined as having higher highs and higher lows, as in the case here on the daily line chart of JP Morgan Chase (JPM) that starts on May 13, 2020.
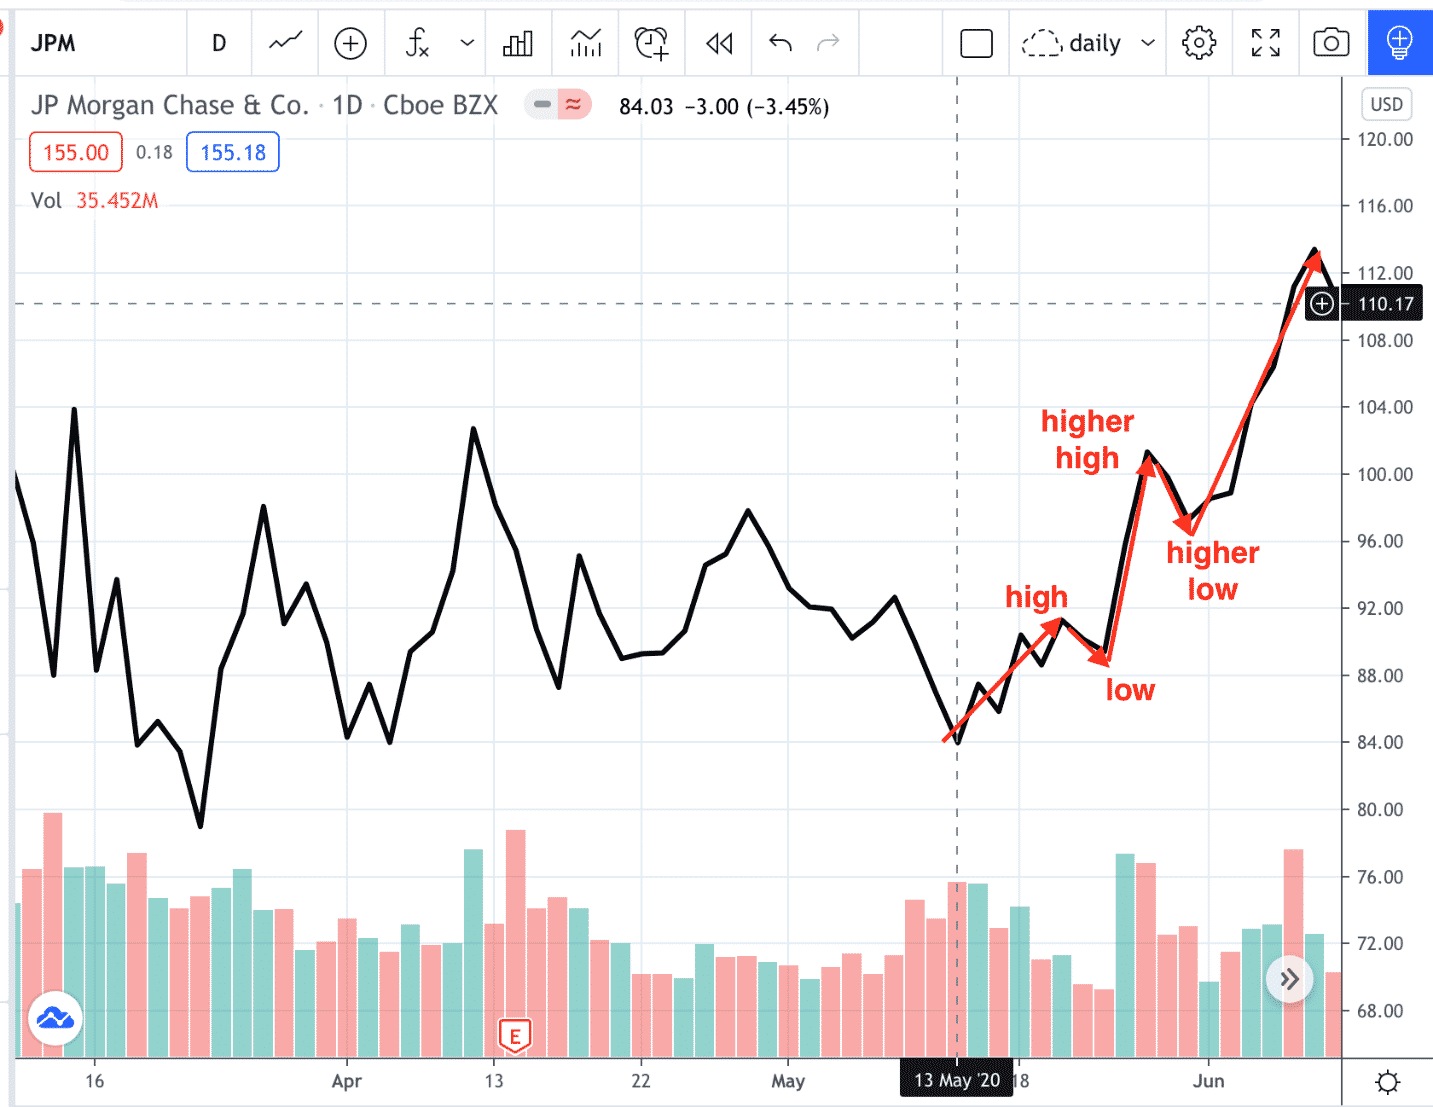
If you have a peak, a valley, another higher peak, and another higher valley, you have a confirmed uptrend.
You just need those four points.
In our example, this is a strong uptrend, because we see that the pullbacks are shallow pullbacks.
The “higher low” (at $97) does not come all the way down to the previous “high” (at $89).
Let’s see what happens next.
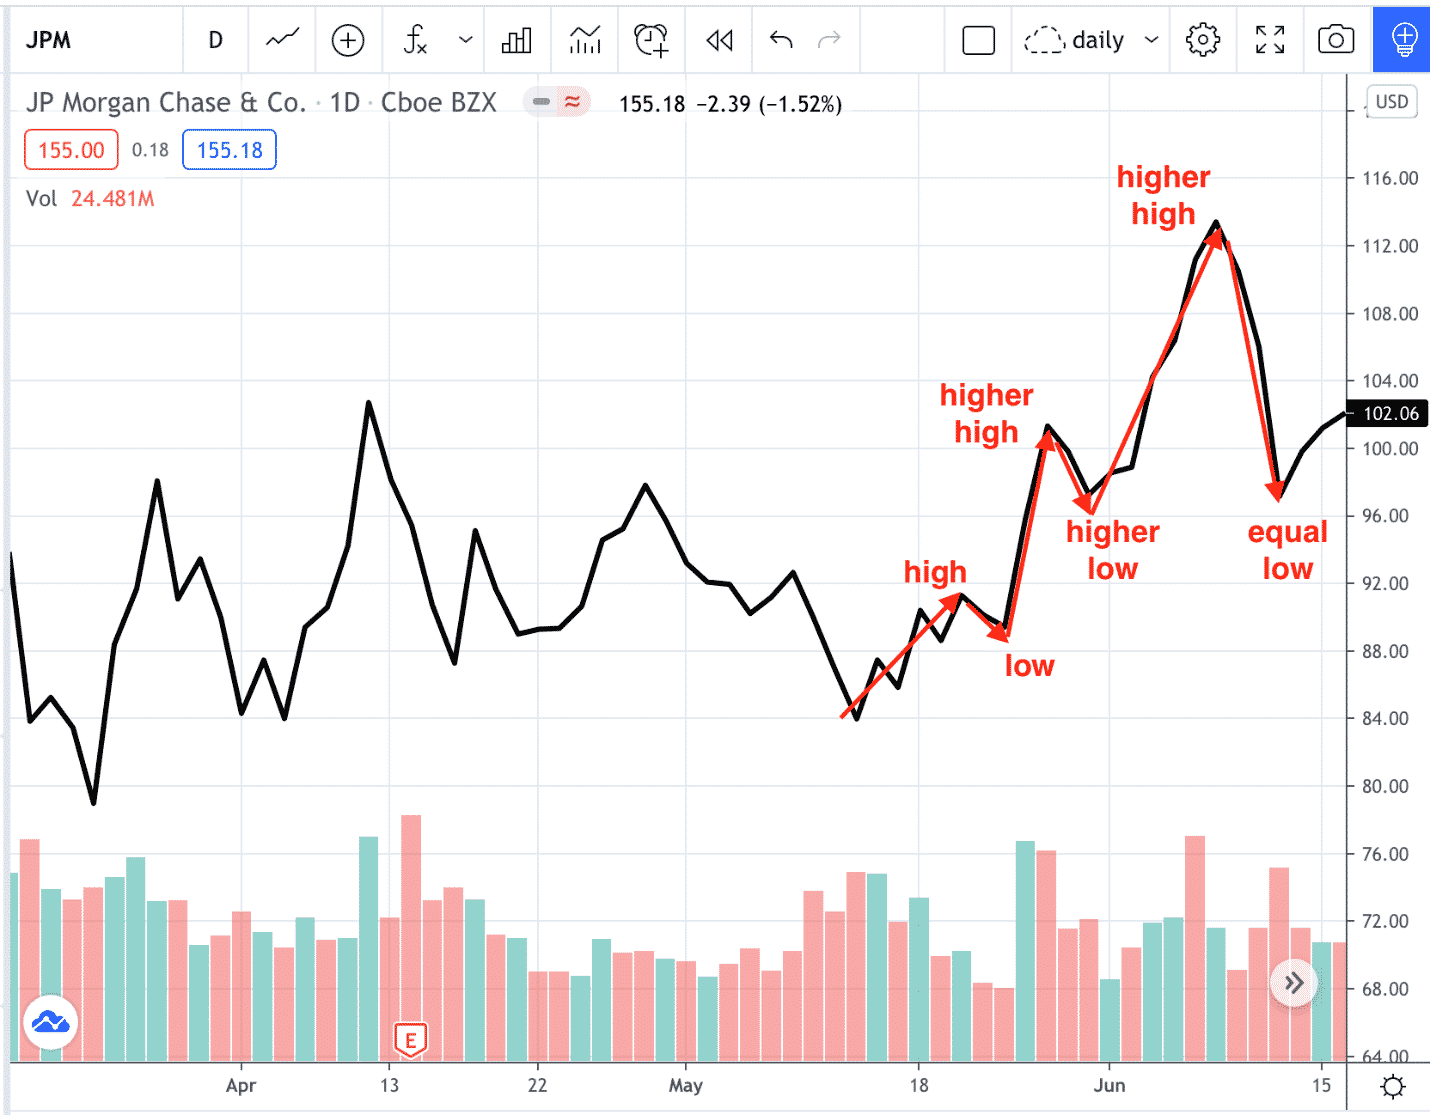
Uh oh. We spoke too soon.
The trend is not looking strong anymore.
Because that last pullback came all the way down to $97, which is equal to the previous low.
The valley is no longer a “higher low”.
We are labeling it as an “equal low”.
This is not a shallow pullback; it is a deep pullback.
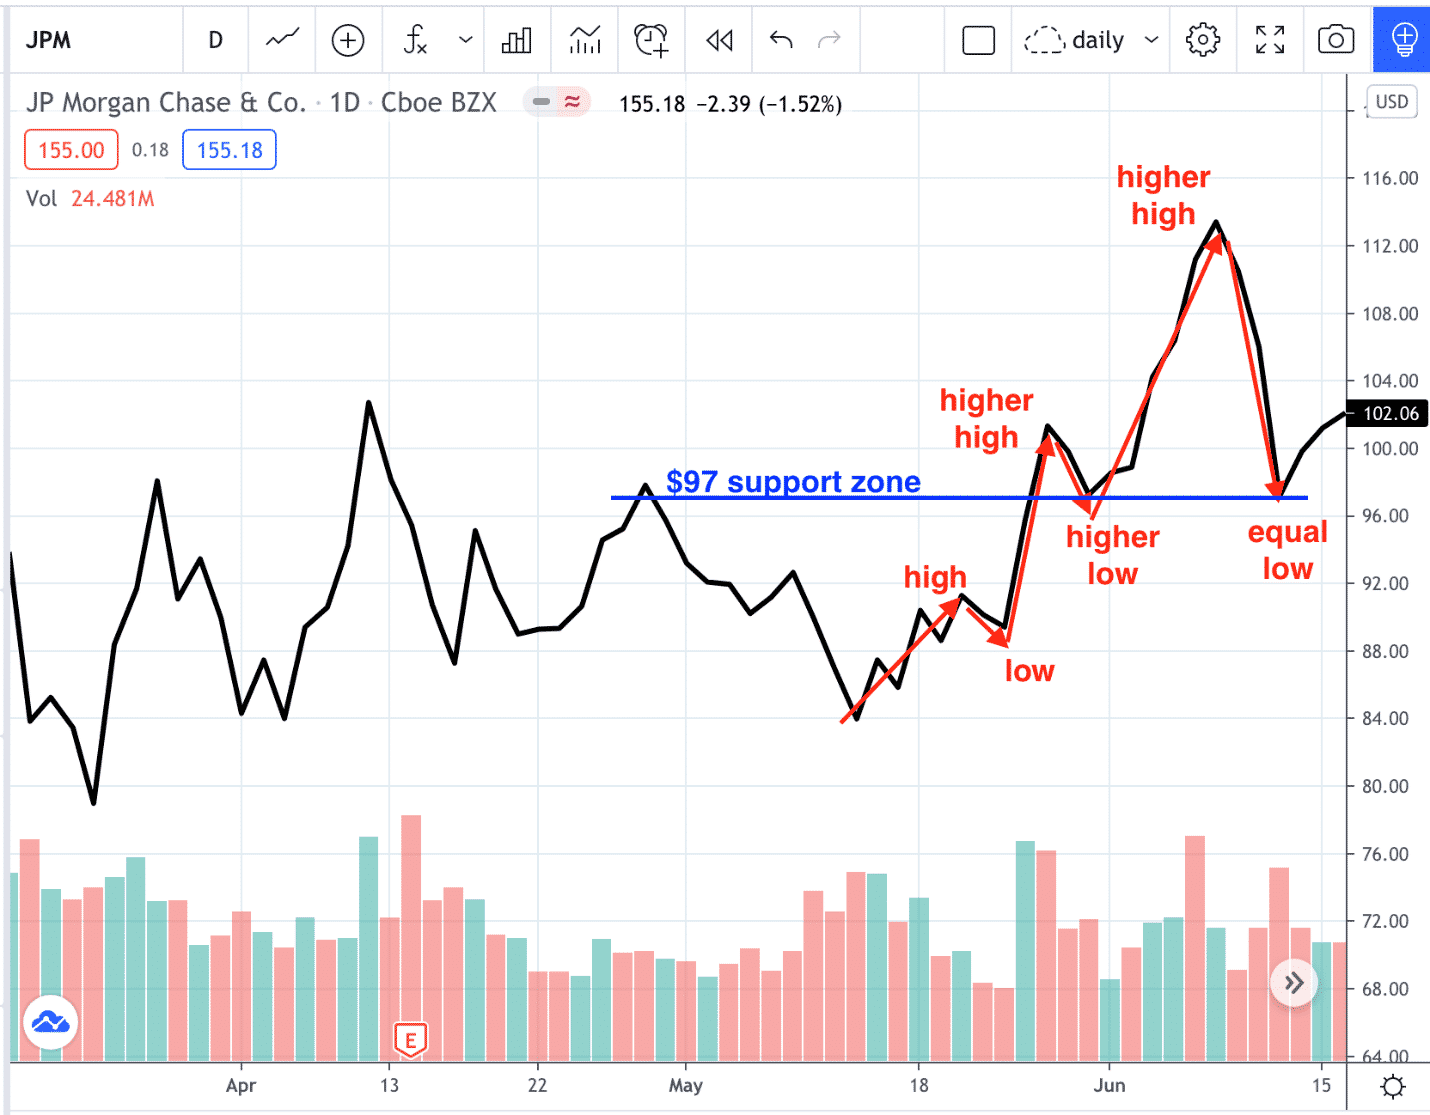
There are now two valleys stationed at $97.
These two points define a “support level” which is drawn in blue here:
Neckline Support
Let’s continue.
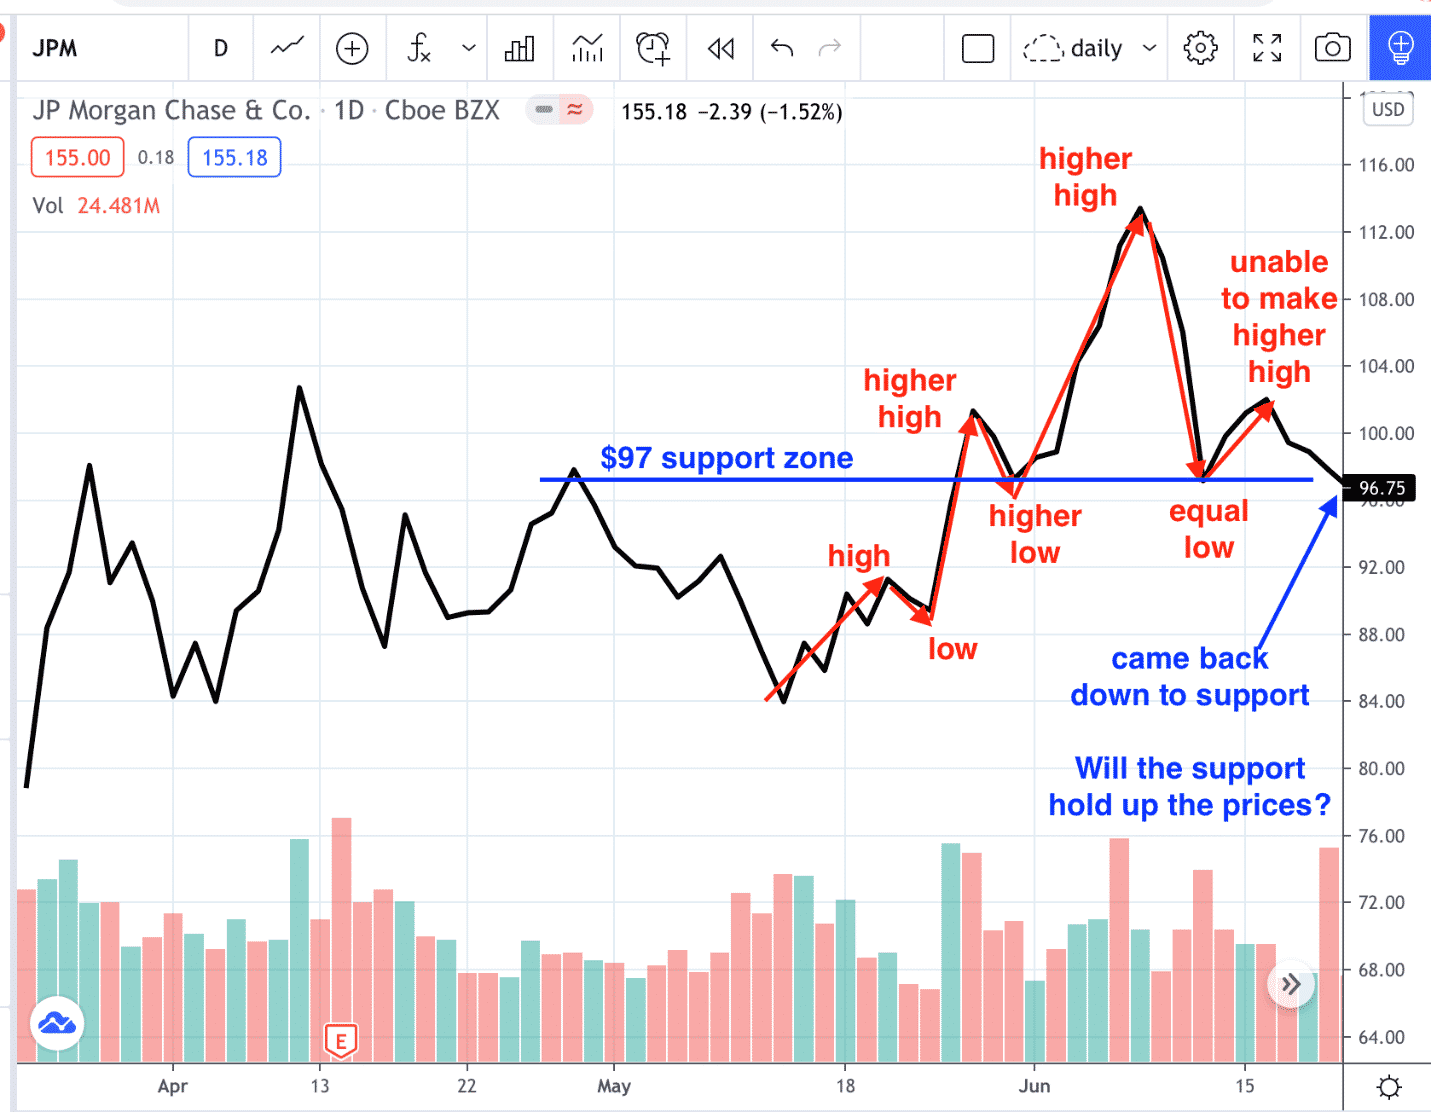
Now the trend is weakening.
Because it is not able to make it up to the previous high.
If it cannot surpass the previous high, it is no longer in an uptrend.
Furthermore, it came back down to touch the $97 support level.
This is the third time prices pulled back to the $97 level.
The question on every investor’s mind is will price hold at the $97 level or will it drop down through support.
Let’s see.
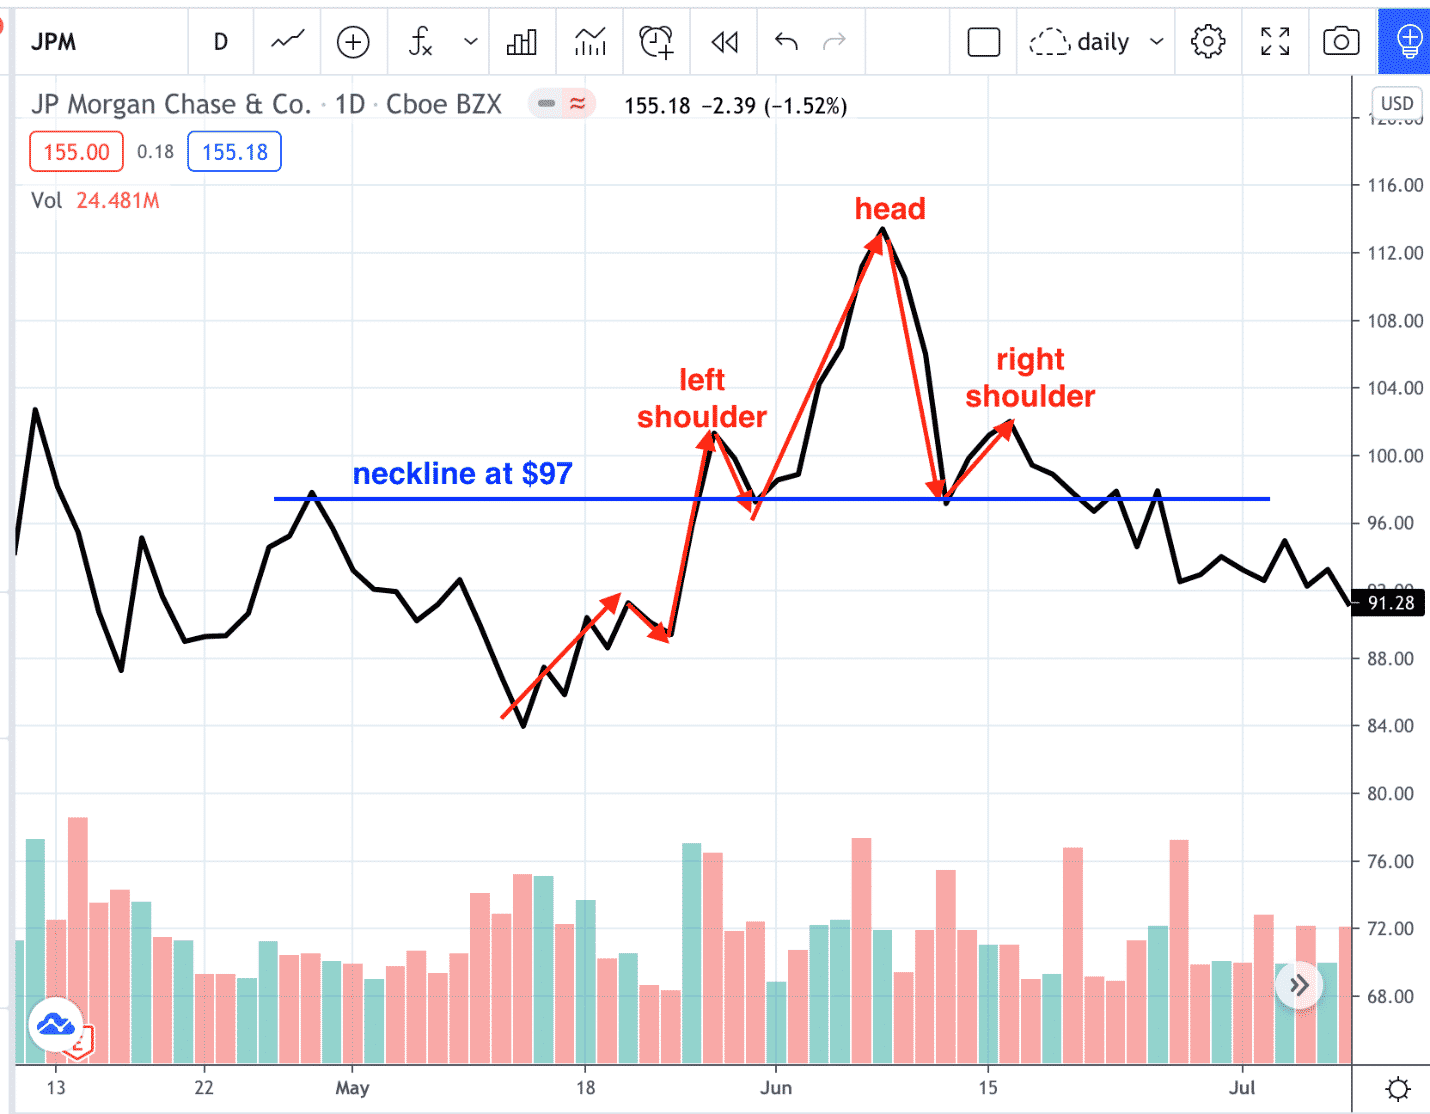
Price did drop below the $97 support.
Once that happens you have a confirmed head and shoulders pattern.
The uptrend reversed into a downtrend as the pattern suggested.
If on the other hand, prices refused to go below support or bounce at support and continued upward again, you have a “failed head and shoulders” pattern.
It is how prices react to the pattern that is important. The wise investor will sit and watch to see what prices do at the completion of the right shoulder.
If prices break down below support, that is the standard signal to go short.
Go Short on a Support Break
Many traders will have criteria to clearly define what “break down below support” means.
Because the support level is not an exact number like $97.00.
It is a zone of numbers ranging from maybe $96 to $98.
Some criteria can be if prices close below $97 two days in a row.
Or it can be if the price trades below 3% of $97.
When going short on the break of support, a good stop loss placement may be just above the peak of the right shoulder.
If prices go above that, it invalidates the pattern.
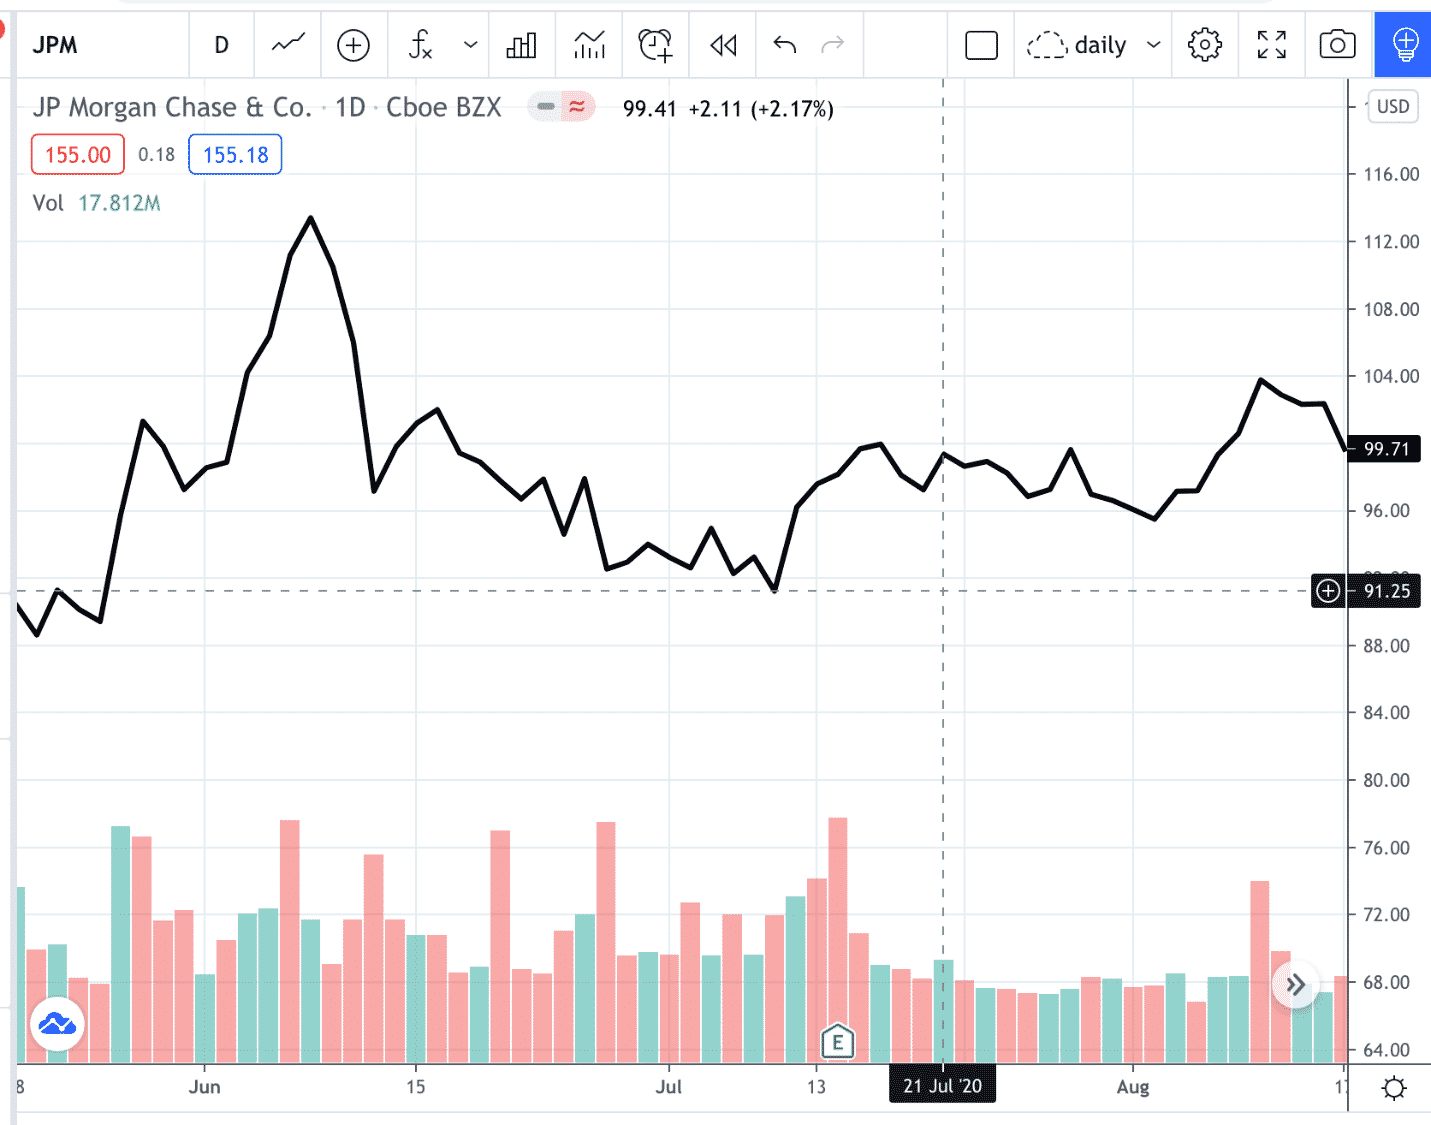
In our example, prices went all the way down to $91.25 before trending up again and going above the right shoulder at $104.
To get an idea of how far down prices might go after breaking of the neckline, one can use “measured moves”.
If prices will make symmetrical moves, we project down from the neckline the same distance as the head height or the shoulder height.
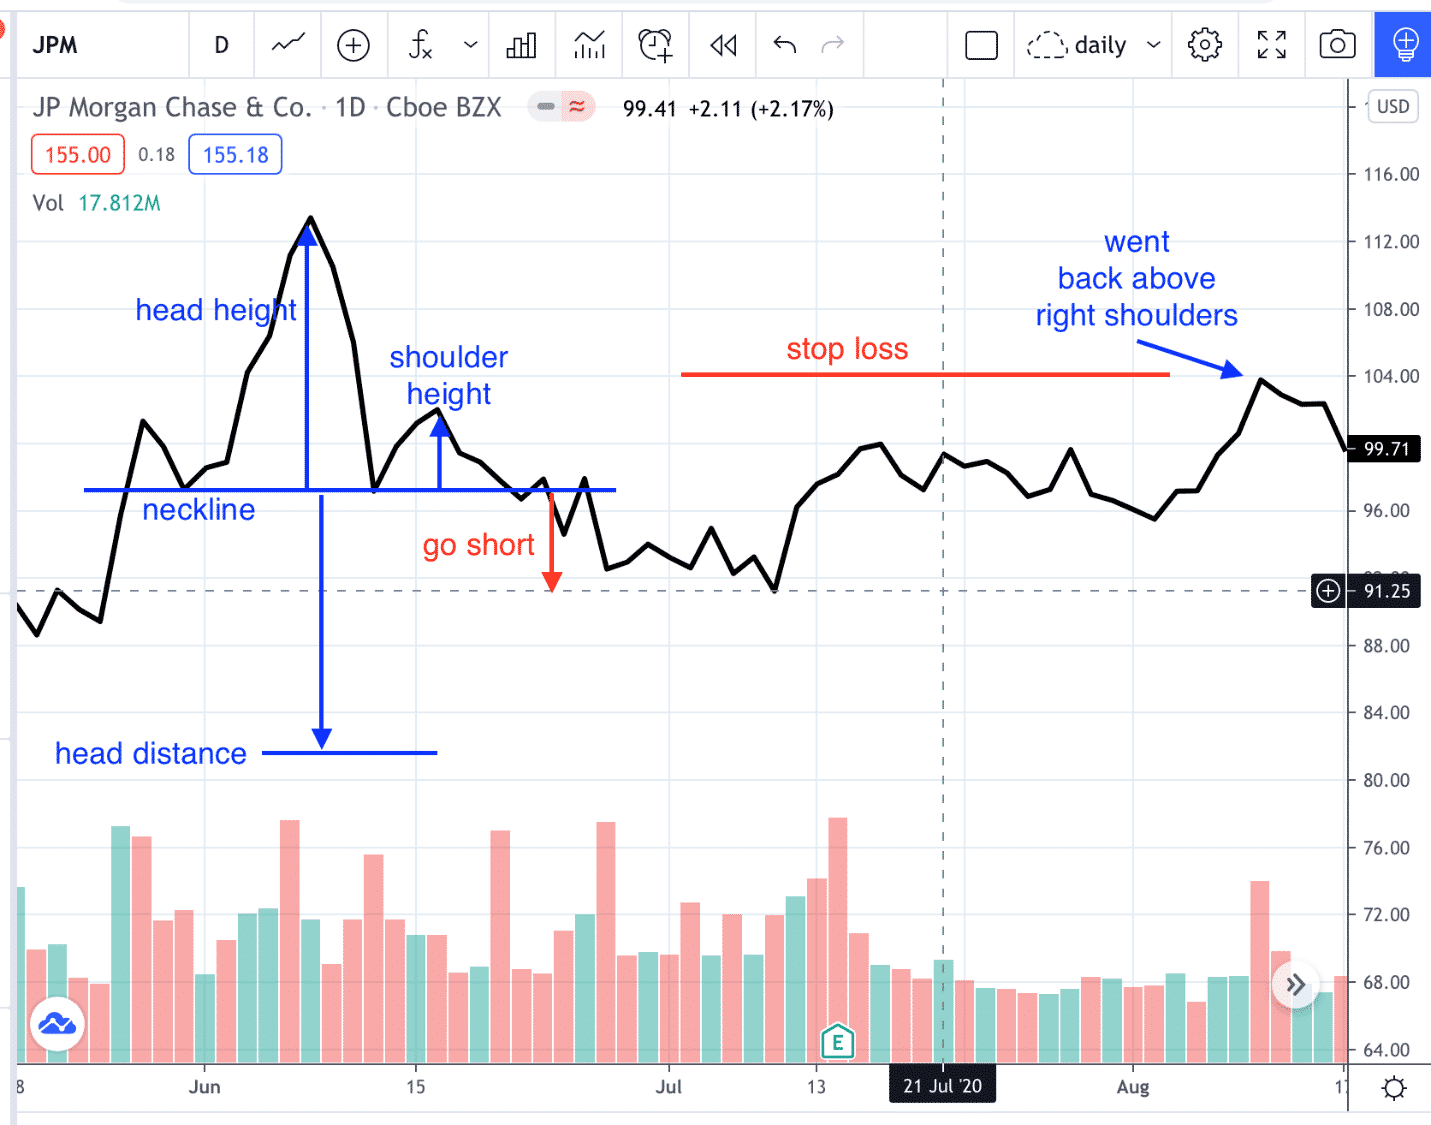
In this case, the prices went down to about shoulder distance before going back up.
With stop loss above the right shoulder, some investors may want to target movement of shoulder distance for a one-to-one reward to risk.
While others may target head distance for a larger reward to risk ratio.
And others may just trail the stop loss until stopped out.
Volume Analysis Of Head And Shoulders
Compare the volume of the up move for the left shoulder with the volume of the up move for the head, and with the volume of the up move for the right shoulder.
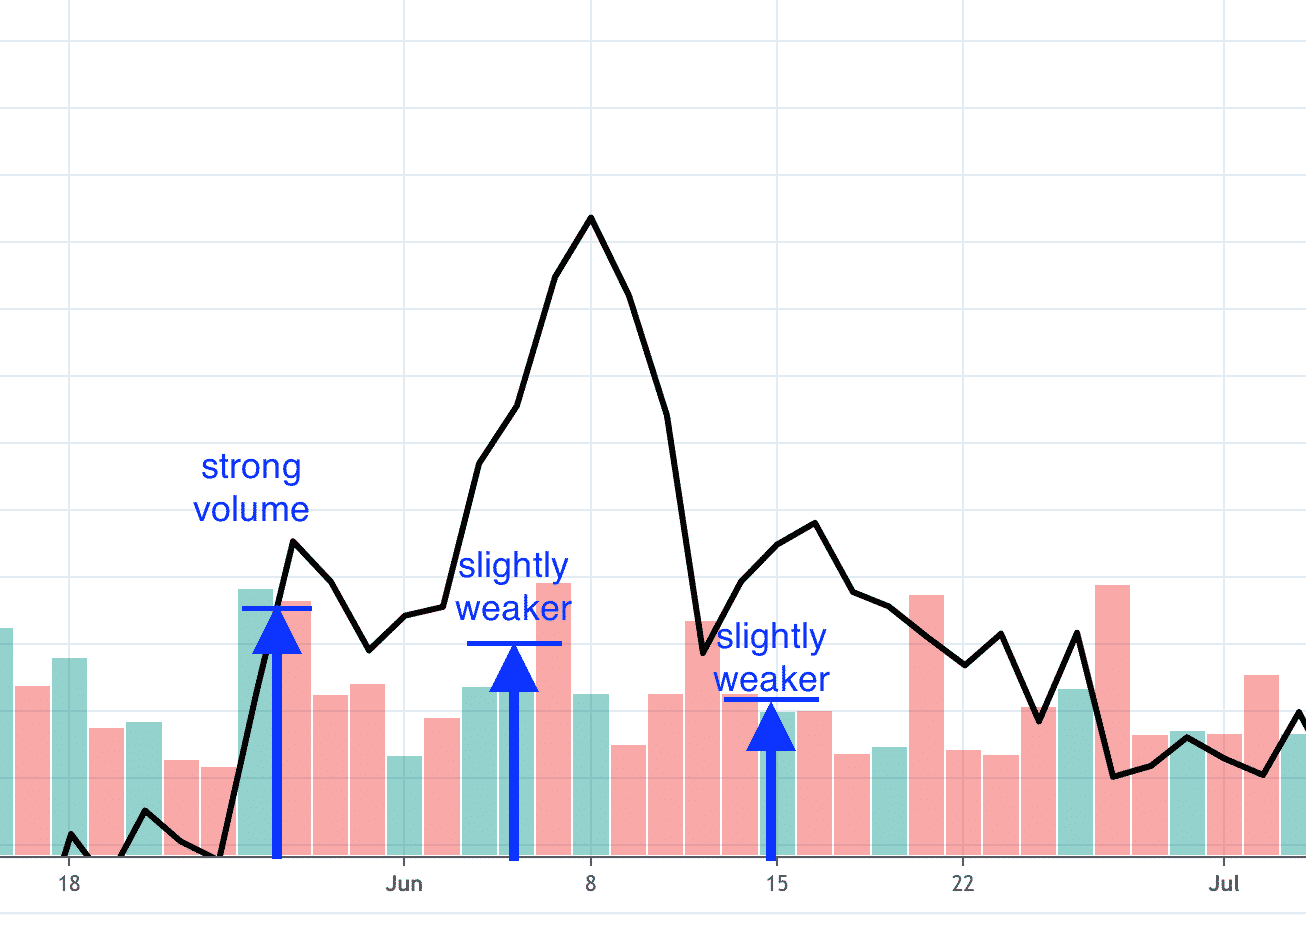
For a good head and shoulders reversal pattern, the up move for the head and right shoulders should be less than that of the left shoulder.
That would be ideal, but in real-life trading, you do not always get that.
So, we are not going to make that a requirement to get into a trade.
Trend Analysis
Look at Veeva Systems (VEEV) at the start of the year 2021.
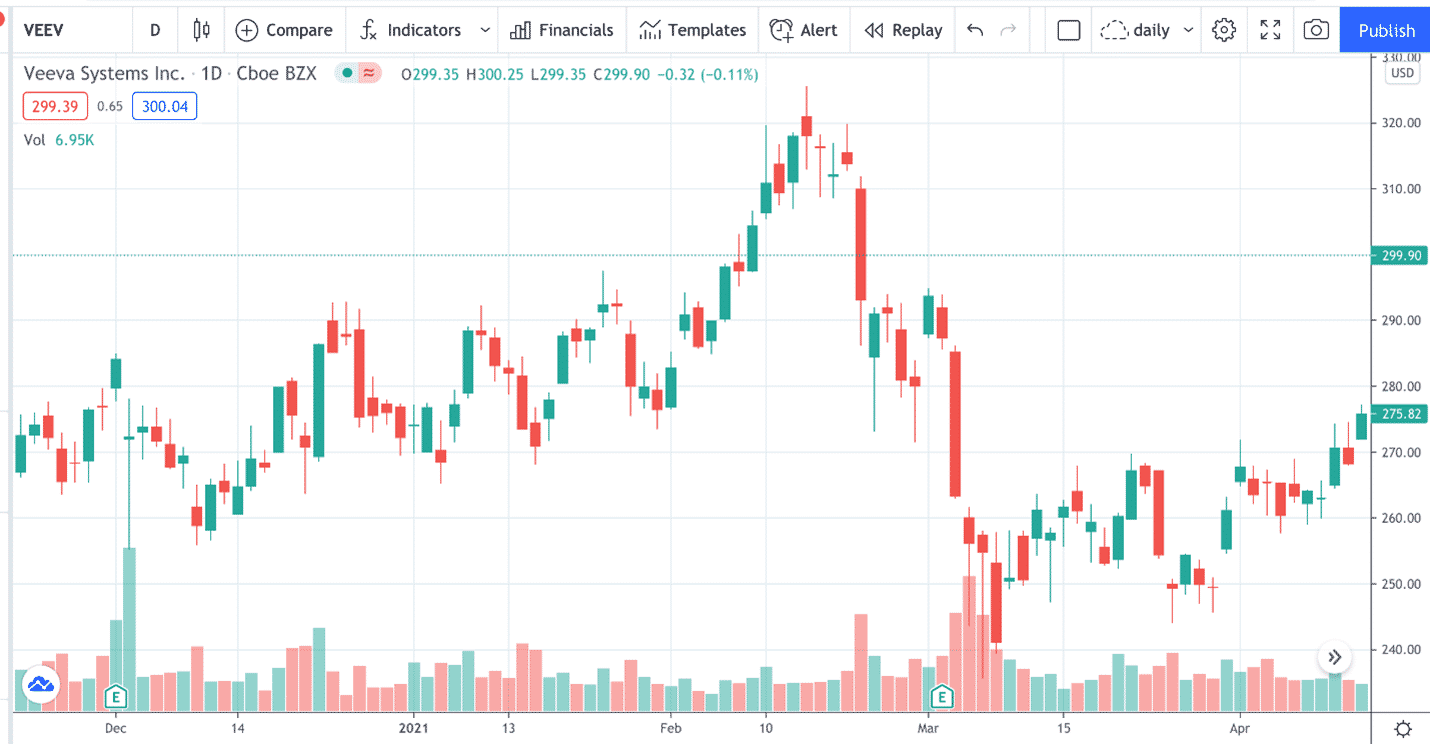
Do you see a head and shoulders pattern?
It may be difficult to see unless the eyes are trained to spot them after looking at many charts.
Sometimes it helps to use a line chart of the closing prices.
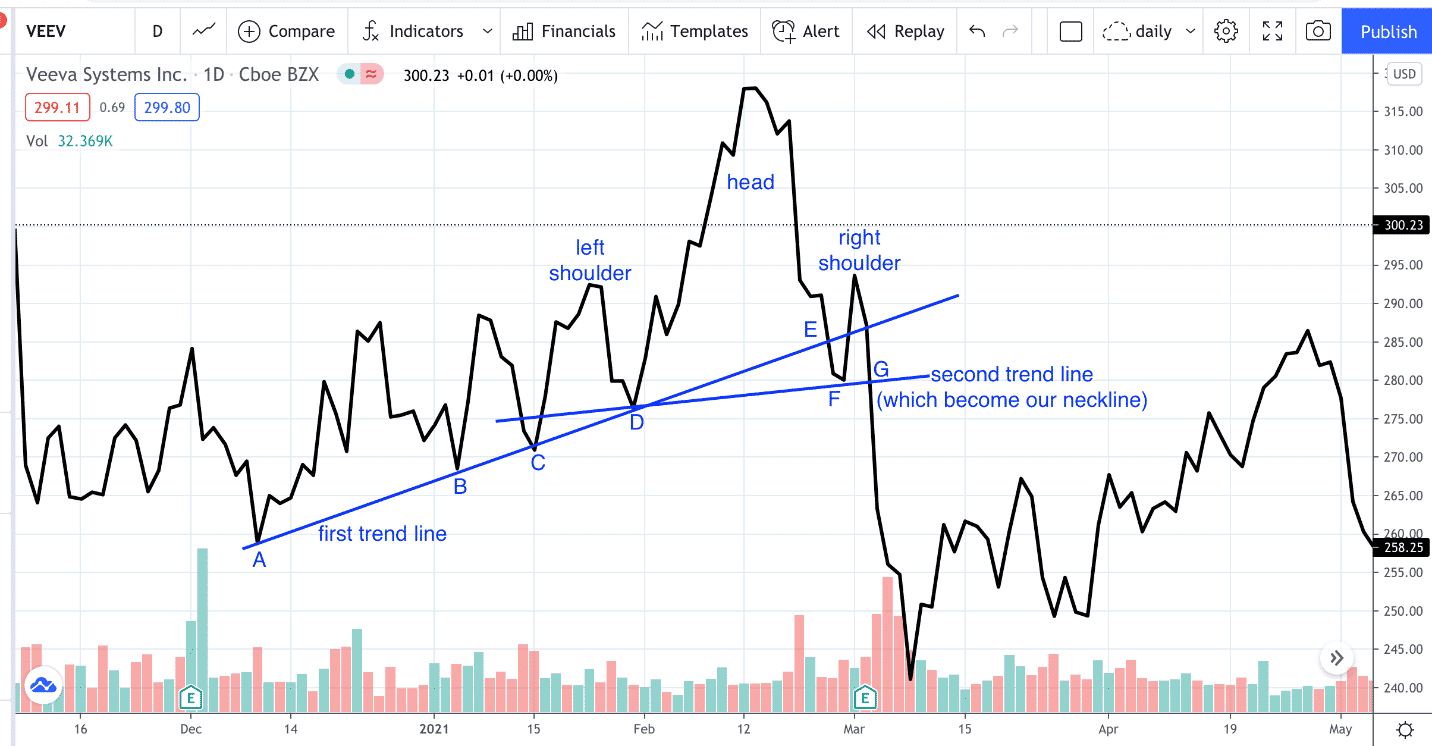
Here we have an existing uptrend as defined by points A, B, C, and D, which are the successive higher valleys.
We also have successive higher peaks as well — but just barely. So, this is not a strong trend.
From the beginning of 2021 to the top of the “head” on February 12, Veeva System is in a valid uptrend.
The important point is that this first trendline broke as prices went down through it at point E.
Now that our first trend line is no longer valid, we re-draw a new trend line based on new prices.
The second trendline is defined by points D and F.
This becomes the neckline of the head and shoulders pattern. We see the right shoulder not being able to make it up to the head.
The peak of the right shoulder is the first peak that is no longer a higher high.
Comparing the slope of A-B-C-D with the slope of D-F, we see that the second trendline is less steep than the first trendline.
This means the trend is softening.
Point G is the third touch of the second trendline.
Will the second trendline support prices? Or will price break down through the trendline?
We see that price decisively broke through the support at point G, and on large volume.
An indication of a good reversal is large volume on the break of support.
However, that is not necessarily a requirement.
Slanted Neckline
The neckline does not need to be horizontal.
It is common that the neckline is slanted up in the same direction as the prior trend — as in the case here.
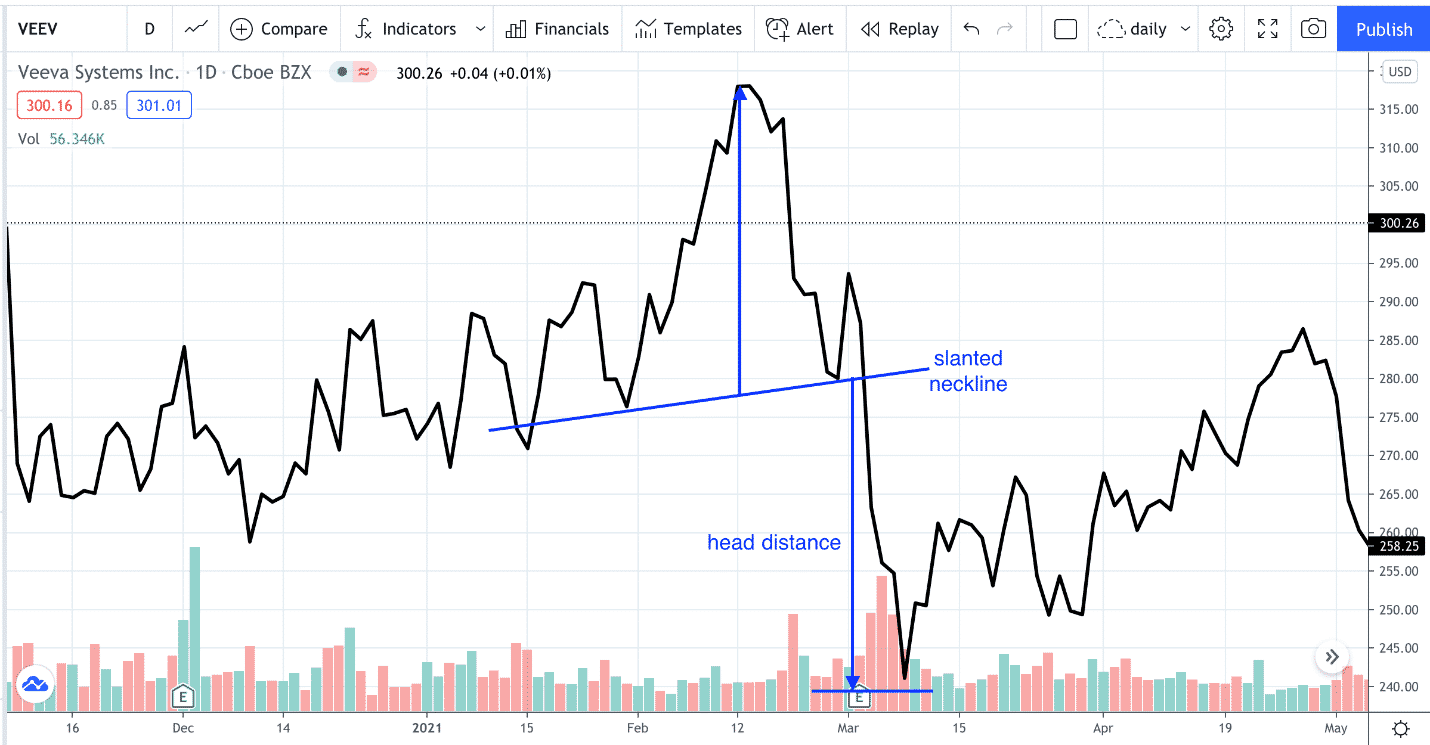
In this case, the down move almost made it down the same distance as the head distance.
Using The Zig Zag Tool
Next, we see chart of Johnson & Johnson (JNJ) with the Zig Zag tool turned on.
You may need to fine-tune the settings of the tool for it to match prices more closely.
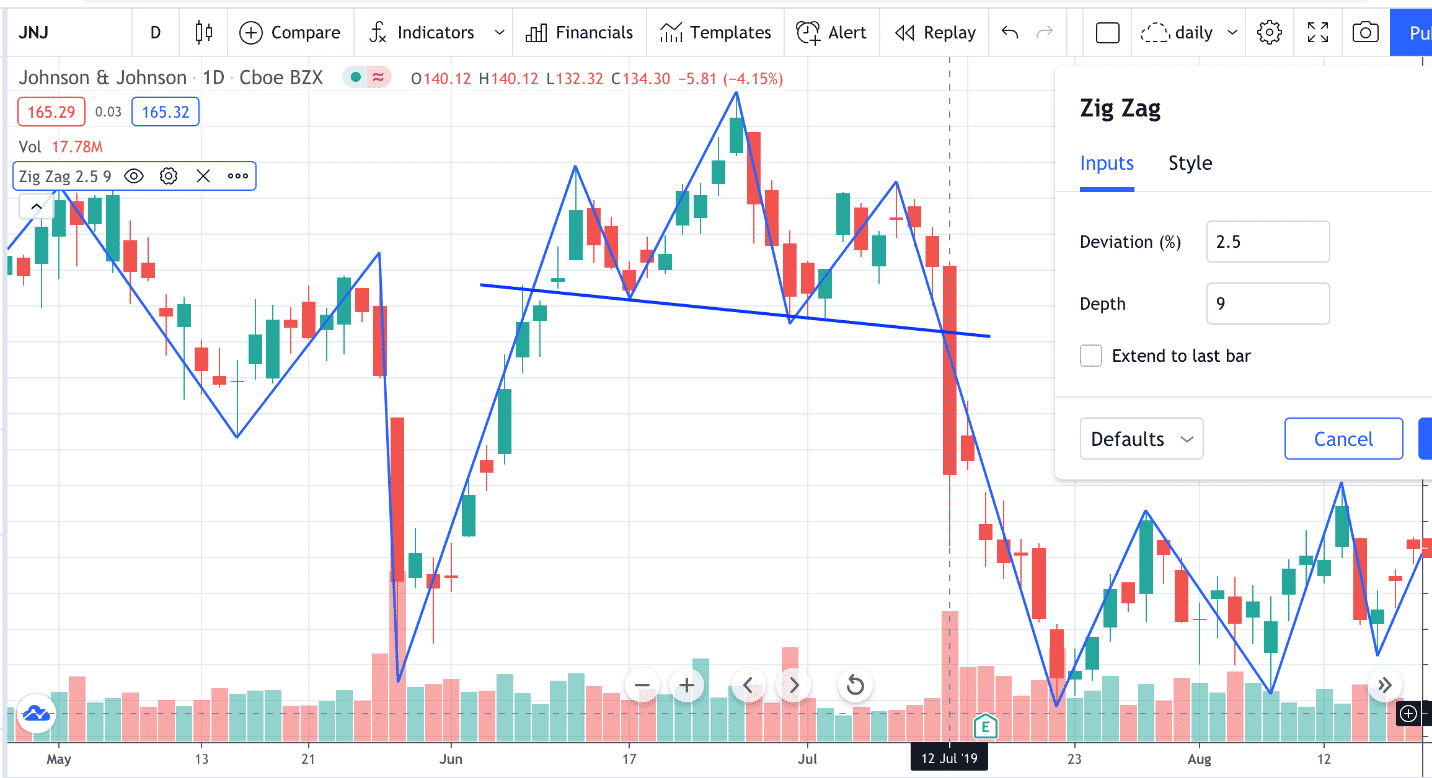
We see a break of the neckline with a big bearish candle on July 12, 2019, under heavy volume.
Although less common, this neckline is slanted slightly downward.
This time, the down move did make it past the head distance.
Another Head And Shoulders Example
Here we see American Express (AXP) reversed from an uptrend to a downtrend on June 5, 2020.
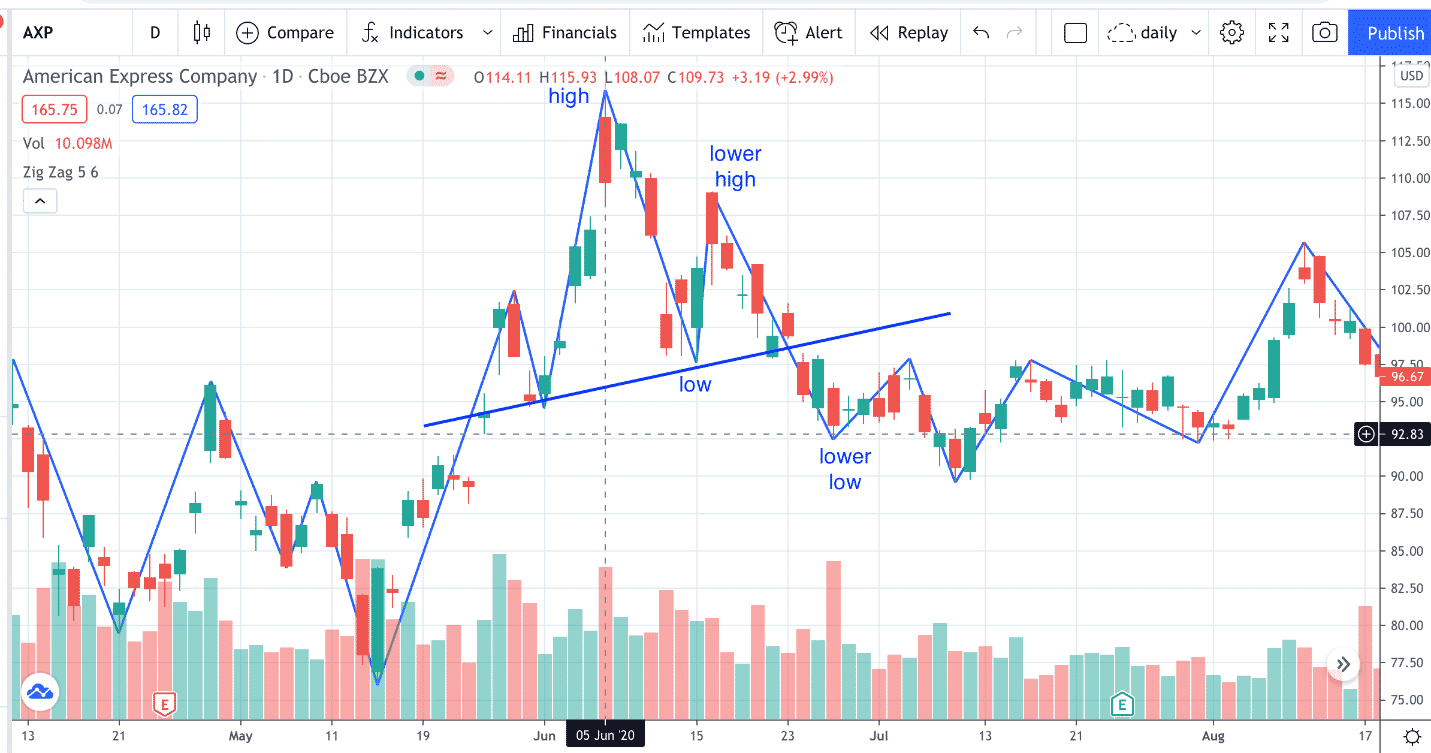
The downtrend is defined as having lower highs and lower lows as marked.
Note that in this case, the downtrend did not go far.
Failed Head And Shoulders Pattern
Sometimes the head and shoulders pattern fails to produce a downtrend at all, as in the failed head and shoulders pattern made by Amgen (AMGN) during April of 2021.
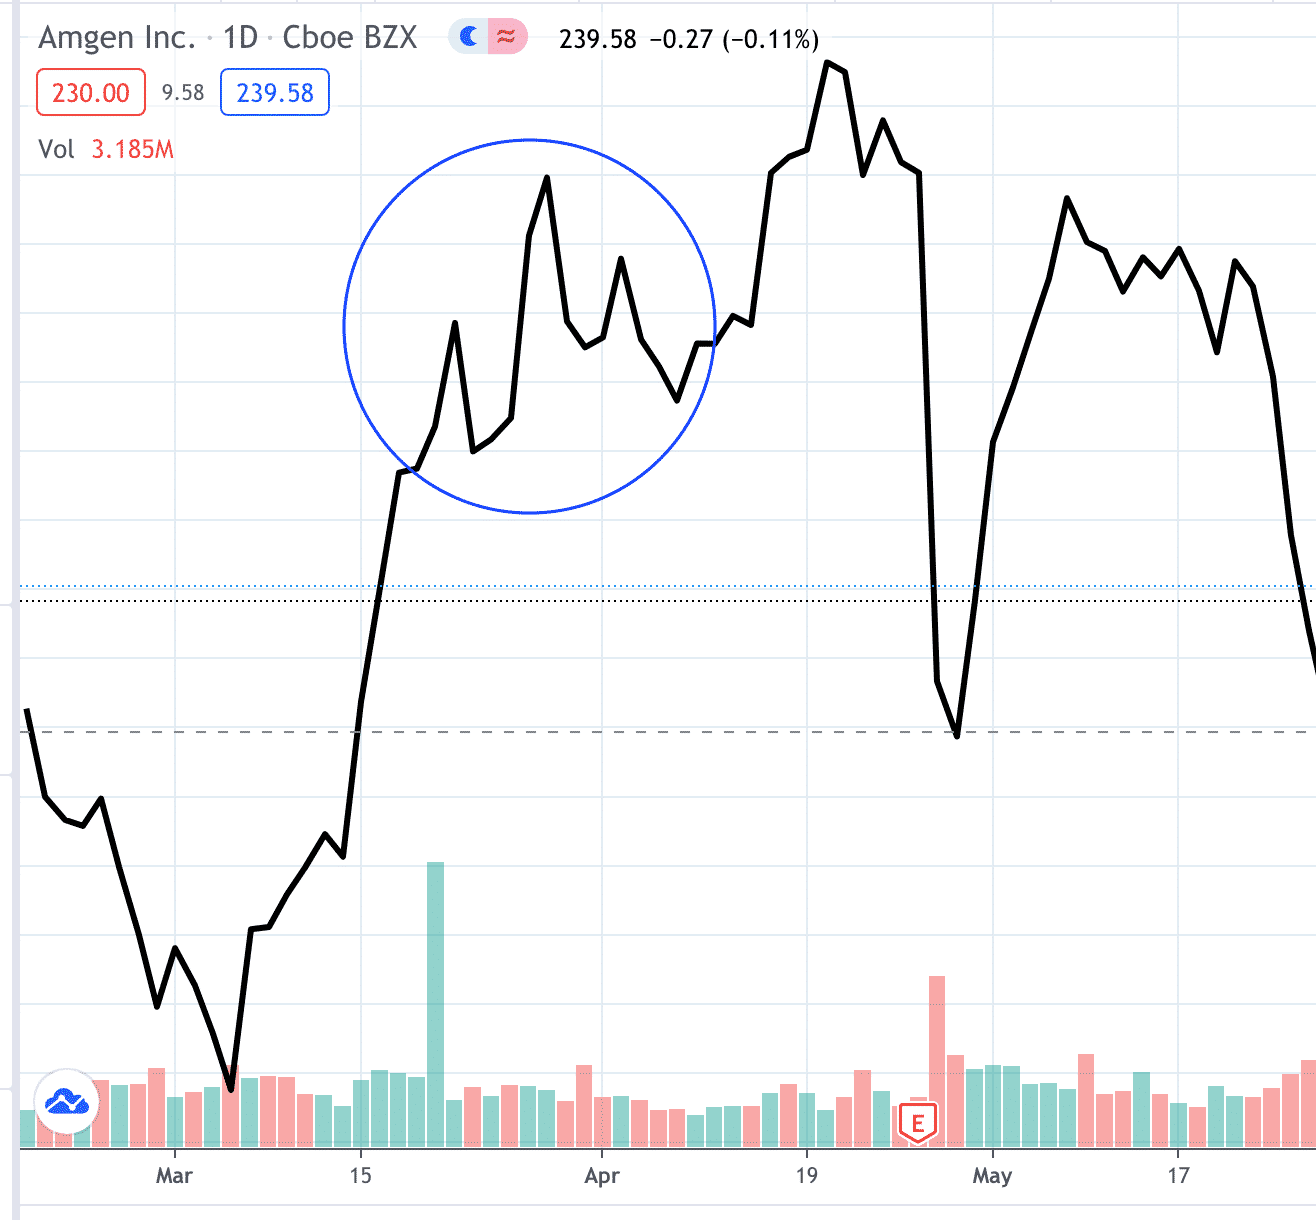
This failed even though volume confirmed the pattern with strong volume in the uptrend of the left-shoulder and weaker volumes on the uptrends of the head and right shoulder.
Double Top
The double top is also a reversal pattern.
It is usually caused by a malformed head and shoulders pattern where the left shoulder is very tiny, and the right shoulder turned out to be as high as the head.
For example, instead of seeing the Coca-Cola (KO) stock as a highly skewed head and shoulders…
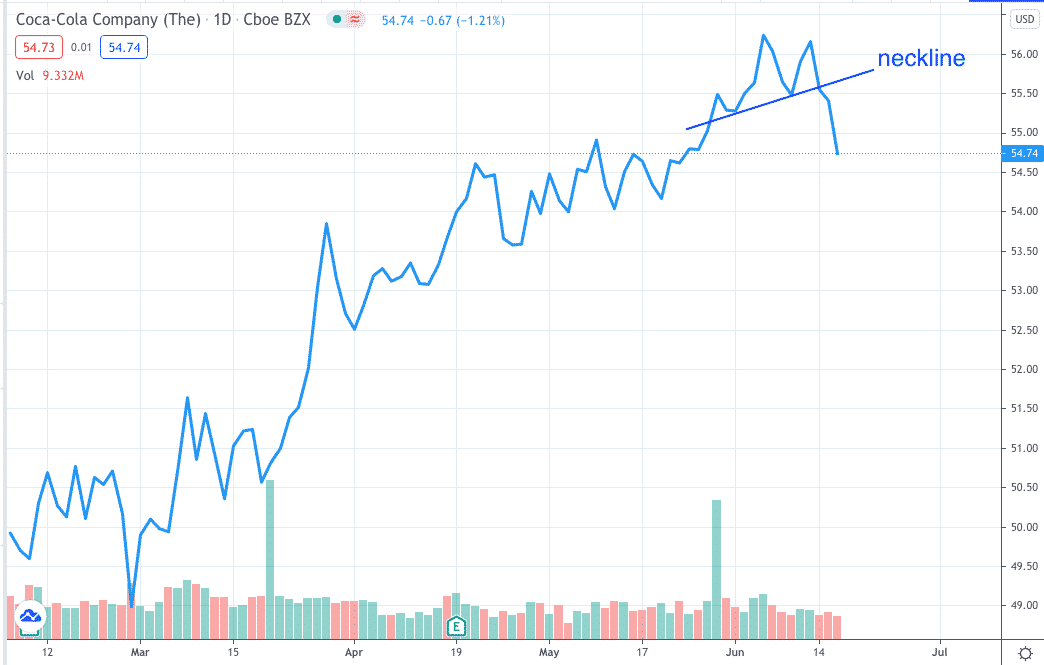
this pattern is more commonly interpreted as the “double top” …
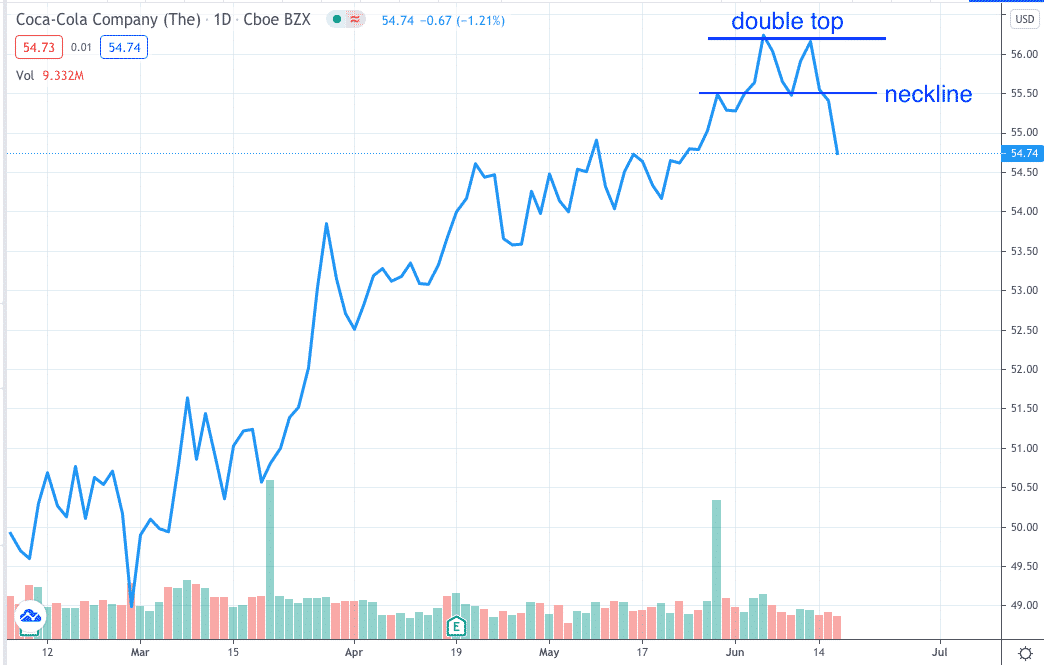
Either way, the price broke the neckline and is a bearish reversal.
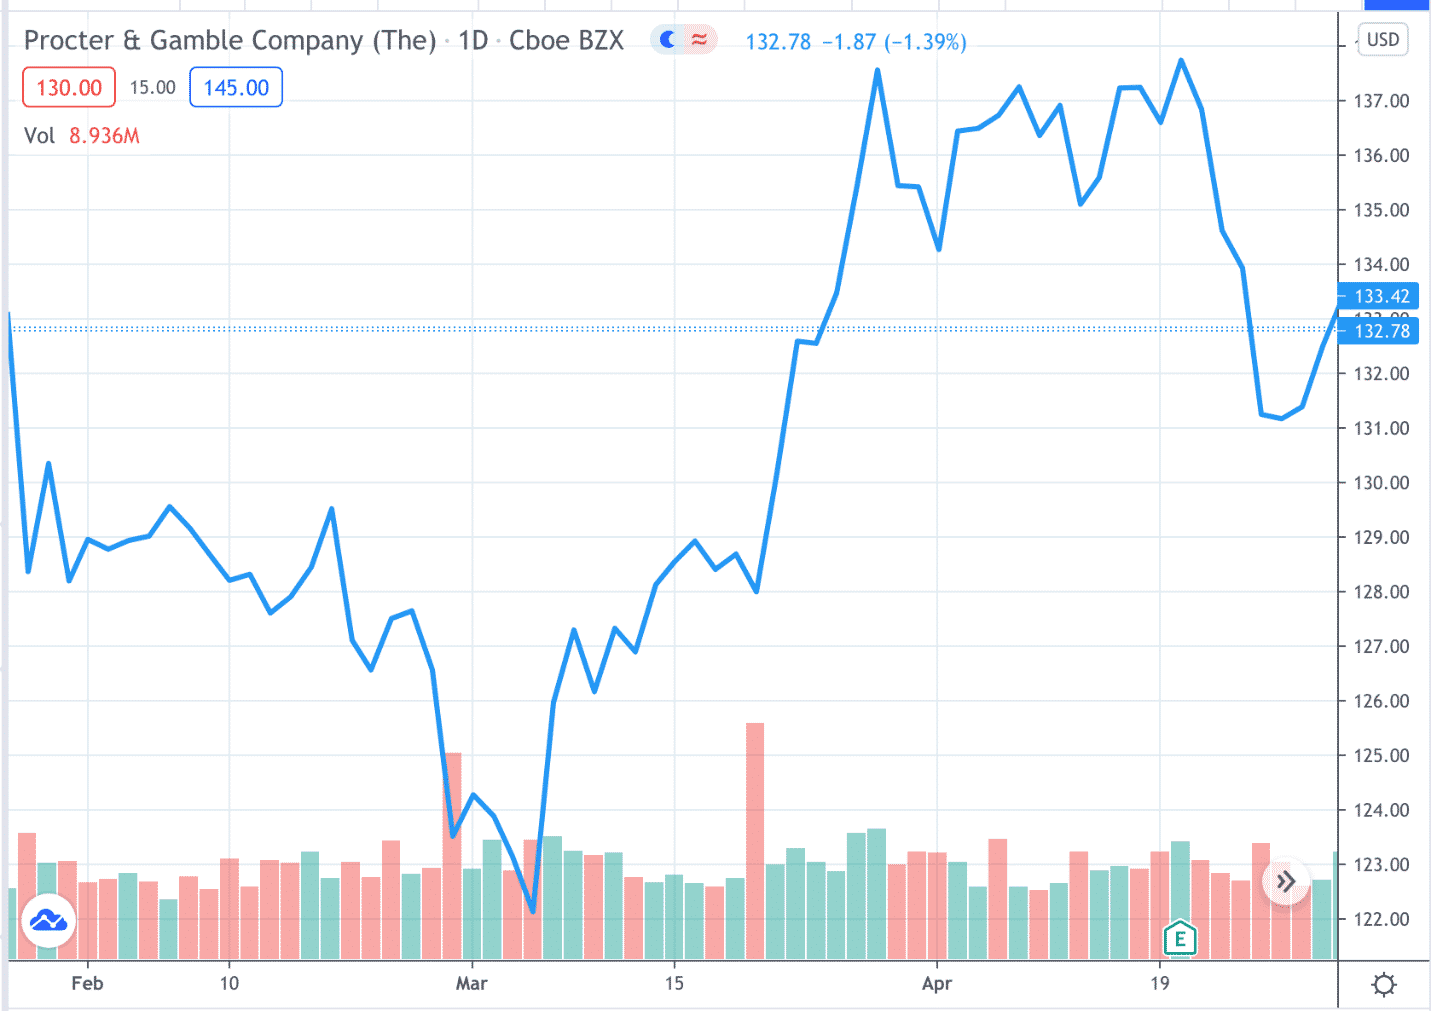
Triple Top
Similarly, we have the triple top where the left shoulder and the right shoulder happens to be as high as the head.
This triple top was seen on Procter & Gamble (PG) in April 2021…
Ambiguous Top
Live charts are not going to give you clear textbook pictures of patterns.
Is this chart of Caterpillar (CAT) a head and shoulder pattern?
A triple top?
Or double top?
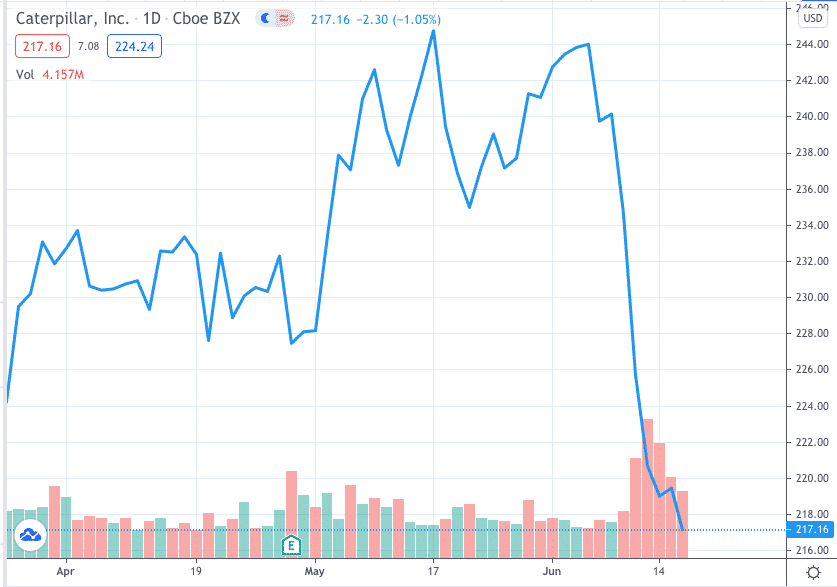
Regardless of how you name it, the interpretation is the same.
It is a topping reversal pattern.
Look at that huge volume on the downtrend that broke the neckline.
Summary
You now have the foundational understanding of the head and shoulders pattern, and the triple top, and double top pattern as well.
But wait. Your education is not complete.
We will continue our learning in the next article where we will take off the training wheels.
No more switching to the line chart as a crutch, and no more using the zig zag tool.
It is too inefficient to switch back and forth to those tools.
We will have to train our eyes to spot the pattern among the candlesticks.
We will be looking for the inverse head and shoulder pattern, which shows up in a downtrend and is a bullish reversal pattern.
Spotting the pattern is not enough, you will need to learn how to capitalize on those patterns.
In the next article, we will show some example trades.
Until then, trade safe.
Trade safe!
Disclaimer: The information above is for educational purposes only and should not be treated as investment advice. The strategy presented would not be suitable for investors who are not familiar with exchange traded options. Any readers interested in this strategy should do their own research and seek advice from a licensed financial adviser.


