


Today, we are looking at the best indicators for day trading.
What are they and how can you use them to your advantage?
Contents
- Introduction
- Trend Following Indicators
- Momentum Indicators
- Volume Indicators
- Volatility Indicators
- Top Five Indicators for Day Trading
- Conclusion
Introduction
Indicators are at the heart of all technical analysis that takes place in day trading.
The tools allow traders to gain an edge in price prediction by tracking trends and patterns crucial to predicting where prices will go next.
Indicators are broadly split into four categories:
Trend Following Indicators
Trend following indicators show whether a stock is trending up or down.
Typically, they are oscillators that move between high and low values providing an idea of which direction price is likely to move.
Such indicators allow traders to have an edge on whether to place long or short trades at a given time.
These types of indicators include Moving Averages and MACD.
Momentum Indicators
Momentum indicators compliment trend following indicators as they signal the strength of price action in a given direction.
The indicators also provide a warning of a potential reversal from a given trend.
Relative Strength Index and Stochastic Indicator are the best for determining momentum in each direction for day trading.
Volume Indicators
Volume is the catalyst that causes the price to move in a given direction.
When volume is higher, the probability of price changing rapidly is usually high.
Such indicators show how the volume changes with time.
On Balance Volume is one such indicator.
Volatility Indicators
Day trading is all about entering position and closing before the end of the day.
This can only be made possible by knowing the best time to enter the market and take advantage of high price changes.
Volatility indicators show how much price is changing in each period.
The best time to day trade is periods of high volatility as the high price changes that come into play make it possible to enter and exit positions.
Top Five Indicators for Day Trading
Moving Averages
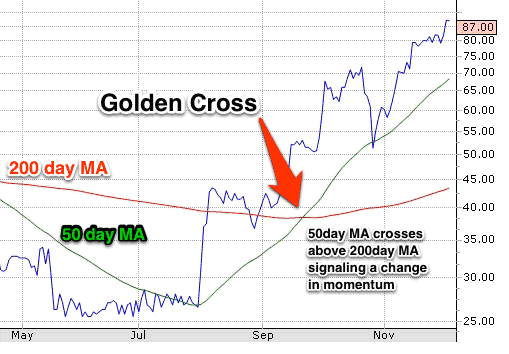
Day trading is all about taking advantage of short-term price movement in any direction. Moving averages are one such indicator used to identify the direction in which price is trending, up or down.
Day traders use short and long-term moving averages to determine the direction in which price is trending.
For instance, whenever a 50-Day moving average crosses the 200-day moving average from below, the same is interpreted as a buy signal.
This is known as a golden cross.
If the price is above the 200MA, traders will look to enter long positions.
Source: Azcoinnews.com
Short positions are only triggered when the 50MA crosses the 200MA from above and moves lower.
This is known as a death cross.
If the price is below the 200MA, traders look to enter short positions.
Bollinger Bands
Bollinger bands are a technical indicator that allows traders to study market volatility.
The indicator comes with lower and upper bands and the middle line.
Price tends to oscillate between the lower and upper band and vice versa.
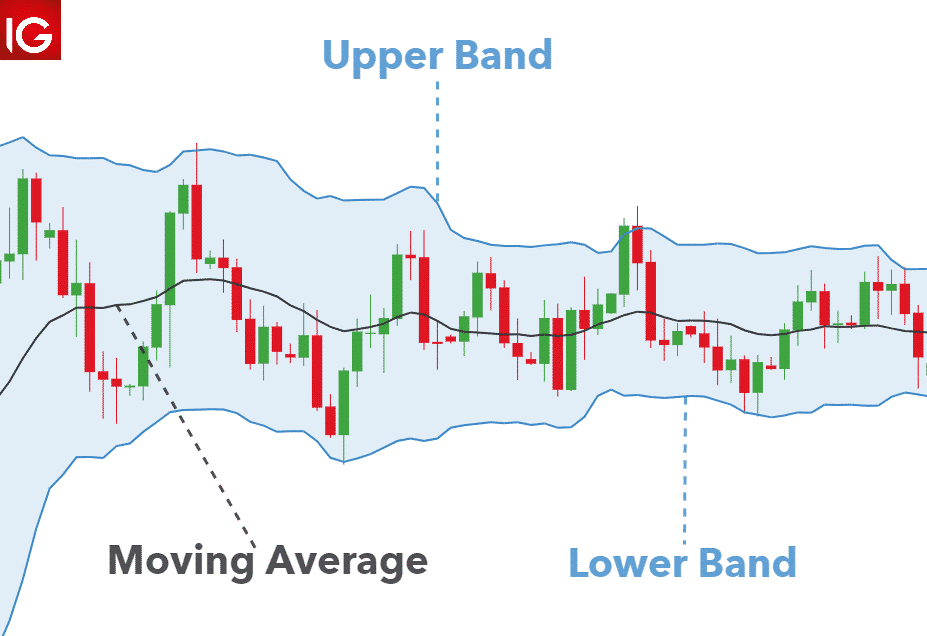
Source: IG / Dailyfx.com
During periods of heightened market volatility, the bands widen, signaling it is the best time to open positions to take advantage of rapid price changes.
The wider the band, the greater the volatility, ideal for day trading.
The smaller the band, the lesser the volatility during which price don’t change much to allow for opening and crossing of positions with ease
Relative Strength Index
RSI is a momentum indicator that signals price momentum in a given direction. The higher the momentum, the likelihood of the price moving fast.
The indicator has readings of between 0 and 100.
Whenever the reading is above 50, it implies the momentum is to the upside and that prices are likely to increase.
In this case, day traders look to enter long positions.
Likewise, whenever the indicator reading is below 50, it implies momentum is to the downside and that prices are likely to continue edging lower.
In this case, day traders look to enter short positions.
Source: Pinterest.com
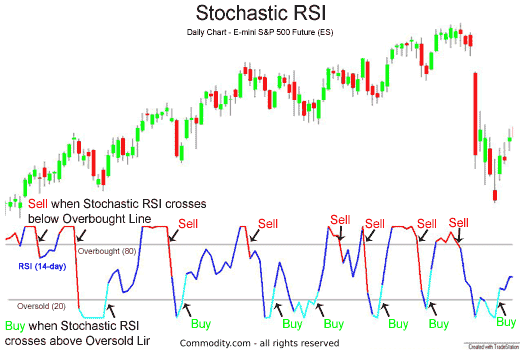
Similarly, whenever the RSI reading is above 80, it implies overbought conditions.
In this case, day traders are usually cautious given the likelihood of price reversals to the downside.
Additionally, whenever the RSI is below 20, it implies oversold conditions, and day traders watch out for potential price reversals to the upside.
Traders will watch for a cross back above 20 (going long) or below 80 (going short) for trade entry.
On Balance Volume indicator
The On Balance Volume indicator signals volume flow into a stock.
Being a leading indicator, it changes direction before price does.
The indicator is plotted as a single line chart, one separate chart from the price chart.
Whenever the price is moving up, the OBV indicator wills also be trending higher, signaling most traders are placing long positions.
Similarly, whenever the indicator makes a new high, it is often expected that price will also follow suit and make a new high.
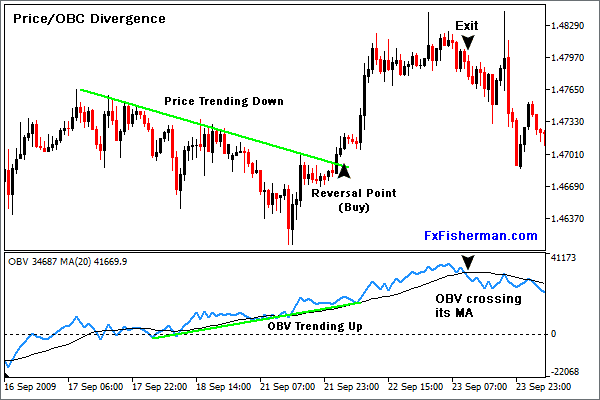
Source: Mql5.com
However, divergence occurs whenever the indicator makes a lower low, but the price continues to edge higher.
In most cases, this acts as a warning sign of a potential price reversal, given that only retail traders are entering positions.
A bearish divergence occurs whenever price fails to make a new higher high even as the OBV indicator makes a new higher high.
If this were to happen, it acts as a warning sign that institutional traders are ramping up short positions; therefore, day traders look to enter short positions given the likelihood of price correcting lower.
Similarly, whenever price makes lower lows and the OBV makes higher highs, it is interpreted as a bullish divergence signaling institutional traders are ramping up buy positions.
What often follows is price correcting higher.
MACD Indicator
The MACD indicator is another indicator used to ascertain the underlying trend as well as market momentum.
The indicator comes with two lines.
The fast-moving line is known as the MACD line, while the slow-moving line the Signal line.
Whenever the MACD line is above the zero line, it signals momentum is to the upwards and that prices are likely to continue edging higher.
Likewise, whenever the MACD line crosses the Signal line from below, it signals buyers are flocking to the market and pushing the price higher.
Therefore, traders use this opportunity to enter long positions.
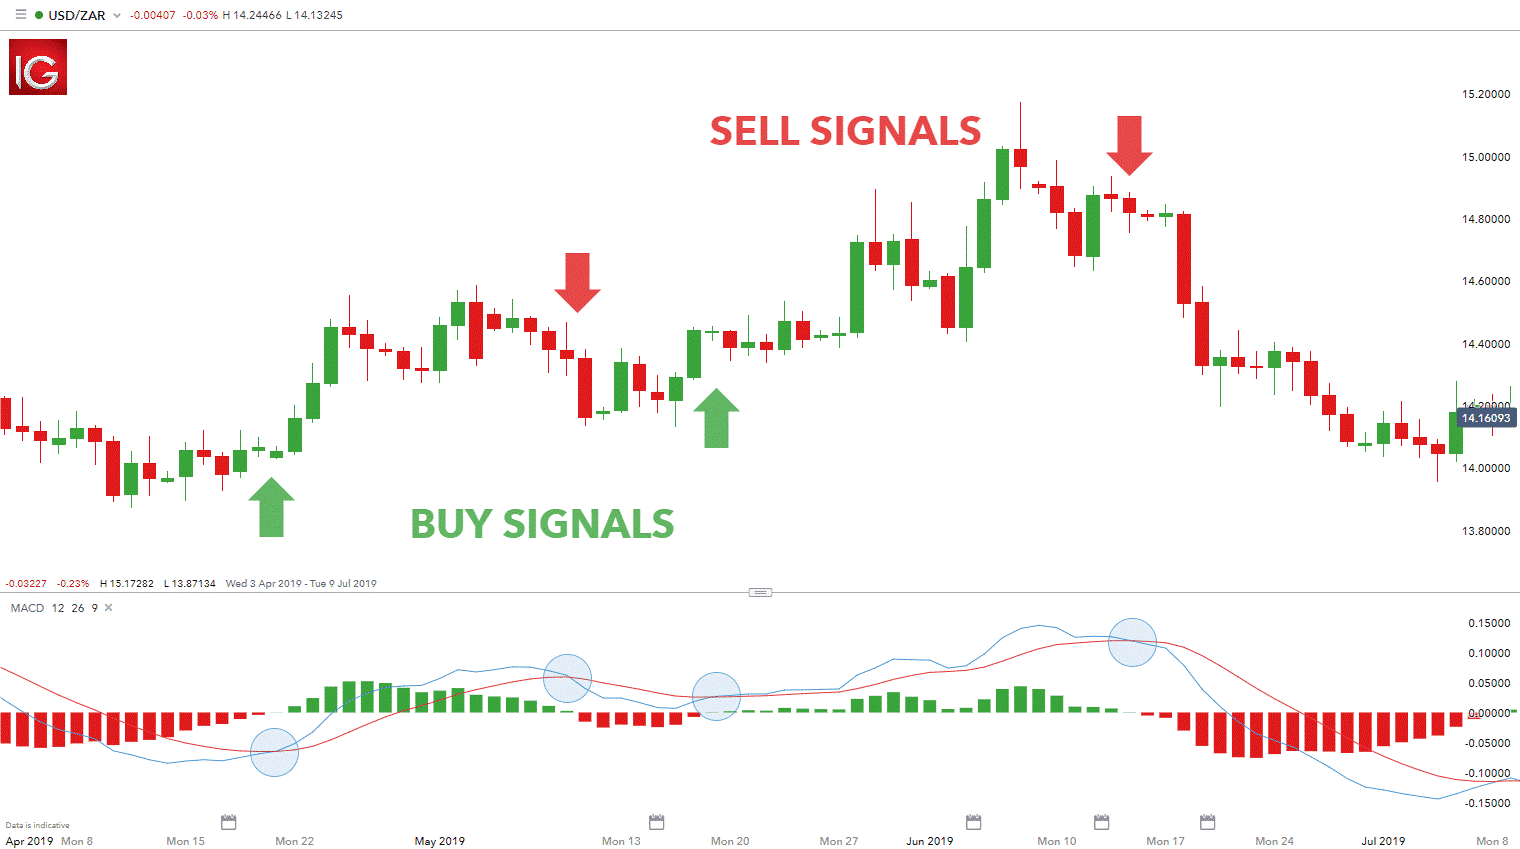
Source: IG / Dailyfx.com
Additionally, whenever the MACD line is below the zero line, it signals momentum is to the downside, and that price is likely to continue tanking.
When the MACD line crosses the signal line from above and moves lower, it acts as a signal to focus on short positions.
Parabolic SAR
While most technical indicators are used to catch the beginning of new trends, the Parabolic SAR indicates the end of a trend.
The indicator is mostly used when traders are vested in position as it is used to provide a warning sign of potential price reversal.
The indicator comes in the form of dots or points placed on the chart to indicate potential reversal points.
The dots oscillate below and above candlesticks to signal reversals.
Whenever the dots are below candlesticks, they act as a buy signal.
When the dots are above the candlesticks, they signify a sell signal.
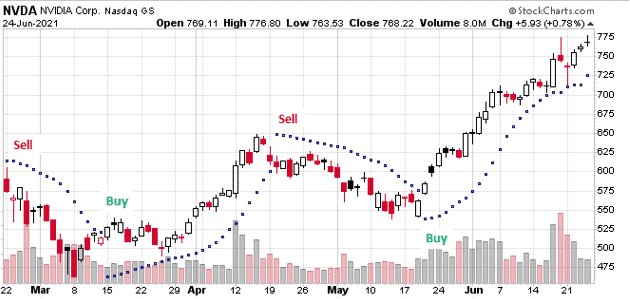
The chart above shows buy and sell signals which would have all worked well.
Conclusion
Technical indicators are at the heart of the analysis that takes place in day trading.
The tools allow traders to gain an edge and understanding of where the price is likely to move.
Traders use them to time the market on entry points and potential reversal points, which act as exit points.
A combination of trend following, momentum, volume, and volatility indicators allows traders to gain an edge in profiting from short-term price changes.
Trade safe!
Disclaimer: The information above is for educational purposes only and should not be treated as investment advice. The strategy presented would not be suitable for investors who are not familiar with exchange traded options. Any readers interested in this strategy should do their own research and seek advice from a licensed financial adviser.


