


Today, we are looking at the inverse head and shoulders pattern.
This is the sequel to the previous article on the head and shoulders pattern.
If you have not read that yet, read it first for the details of the concepts of trend reversal.
Here, we will flip the pattern on its head to look for the “inverse head and shoulder” pattern, which is a pattern that indicates a potential reversal of an existing downtrend.
Contents
- Example of Inverse Head and Shoulders
- Bull Put Spread On Inverse Head And Shoulders
- Breaking Of Neckline On Heavy Volume
- Slanted Neckline
- Double Bottom
- Conclusion
Example Of Inverse Head And Shoulders
KLA Corporation (KLAC) was in an existing downtrend in the early part of 2020.
It was still in the downtrend with lower lows and lower highs as it formed the left side of the inverse head and shoulders.
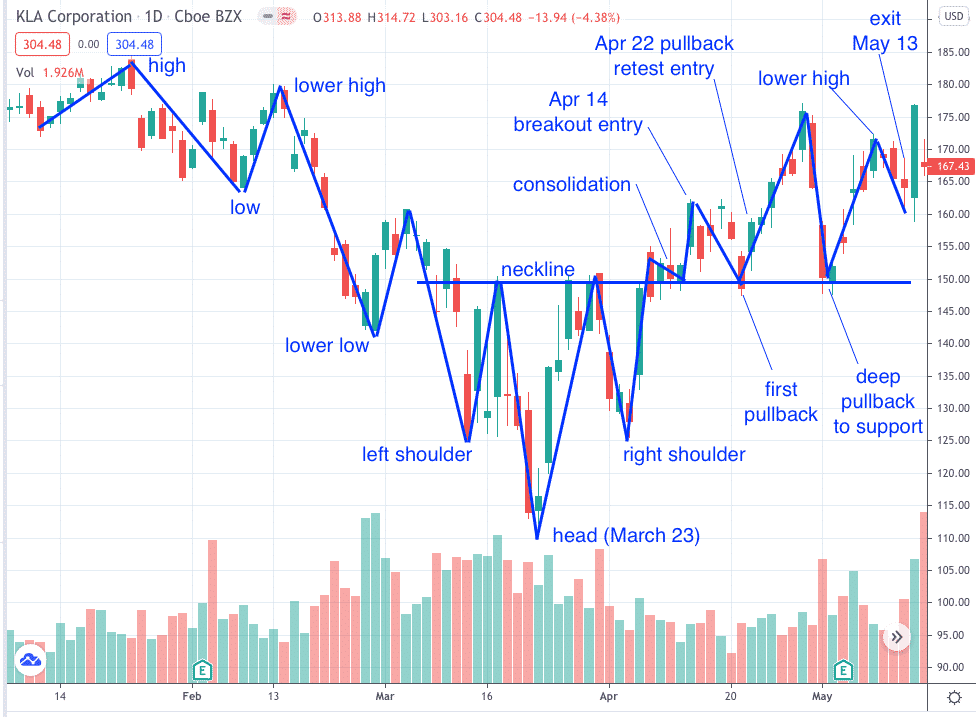
However, once it made the lowest low on March 23rd at around $110, the next swing low was only able to make it down to $125, forming the right shoulder and no longer able to make any lower lows.
We see the neckline is a zone of heavy resistance at around the $150 level.
For a few days in early April, the price consolidated around that level until it broke above on April 14th.
This is a bullish signal to go long on April 14.
Bull Put Spread On Inverse Head And Shoulders
Investor A goes long with a bull put spread on April 14th.
Date: April 14, 2020
Price: KLAC @ $161.73
Sell two May 15 KLAC $145 put @ $6.25
Buy two May 15 KLAC $135 put @ $4.45
Credit: $360
A more conservative investor may wait for the first pullback after this breakout before going long on April 22nd.
After the first pullback, you will have a confirmed uptrend defined by higher highs and higher lows.
Investor B goes long with a bull put spread on April 22nd.
Date: April 22, 2020,
Price: KLAC @ $158.68
Sell two May 15 KLAC $145 put @ $5.00
Buy two May 15 KLAC $135 put @ $2.70
Credit: $460
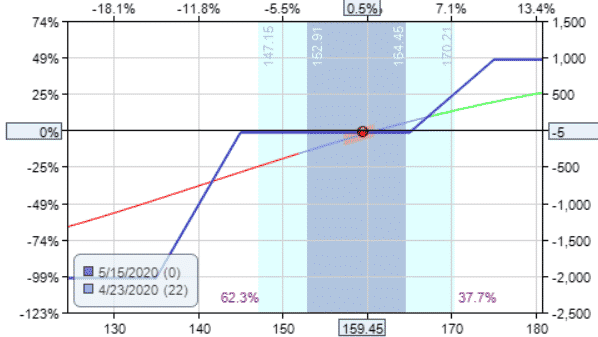
At this time, Investor A also sees the pullback and adds to the position by adding a bull call spread to the exiting bull put spread turning it into a bullish risk reversal.
Adding a Bull Call Spread
Date: Apr 22, 2020
Buy one May 15 KLAC $165 call @ $7.25
Sell one May 15 KLAC $175 call @ $3.35
Debit: $390
The payoff diagram for Investor A now looks like this:
The price made it up to $175 when it retraced a deep pullback all the way down to the previous $150 level support on May 1st, suggesting that the trend may be weak.
Both investors watch to see if the $150 support will hold.
If it breaks, they both will exit. But fortunately, the support held and price rallies up from the $150 support.
On May 6, Investor B’s profit is at $380, more than 50% of the max profit for the trade.
So, Investor B takes the profit and exits the position.
While Investor A continues with the trade basing the decision on price action rather than profit and loss (P&L).
The rally off support took the price up to only $170 before a pullback.
Seeing this peak in price did not get up to the previous high of $175, investor A decides to exit at this point on May 13th with a profit of $257.50.
Breaking Of Neckline On Heavy Volume
Let’s look for another inverse head and shoulders pattern to train our eyes to see them more easily.
Zoom Video Communications (ZM) was in an existing downtrend when it formed the following inverse head and shoulders pattern.
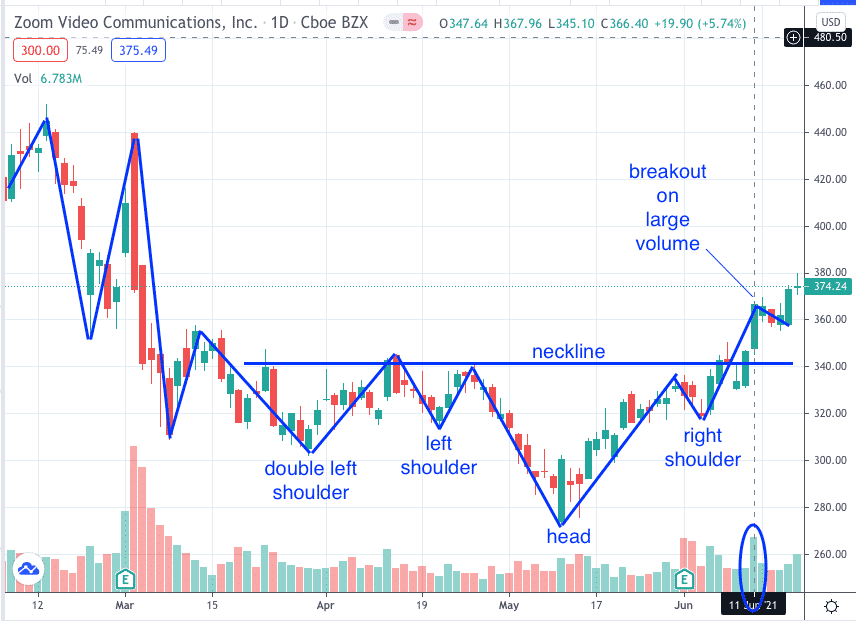
This chart can be interpreted as having two left shoulders, which is possible.
It is also possible to have two right shoulders before a breakout as well.
Once price made the lowest low on May 11 at around $273, the next major swing low was only able to make it down to $320, forming the right shoulder.
The important point is that the right shoulder is not able to make a lower low, which means that the downtrend is no longer a downtrend.
Looking left we see the neckline is a zone of heavy resistance at $340. Yet ZM was able to break through above it on June 11 with large volume.
Large volume on the breakout is a good sign.
Slanted Neckline
The neckline does not need to be horizontal.
It can sometimes be slanted in the direction of the downtrend as in the case of Apple (AAPL) in March 2021.
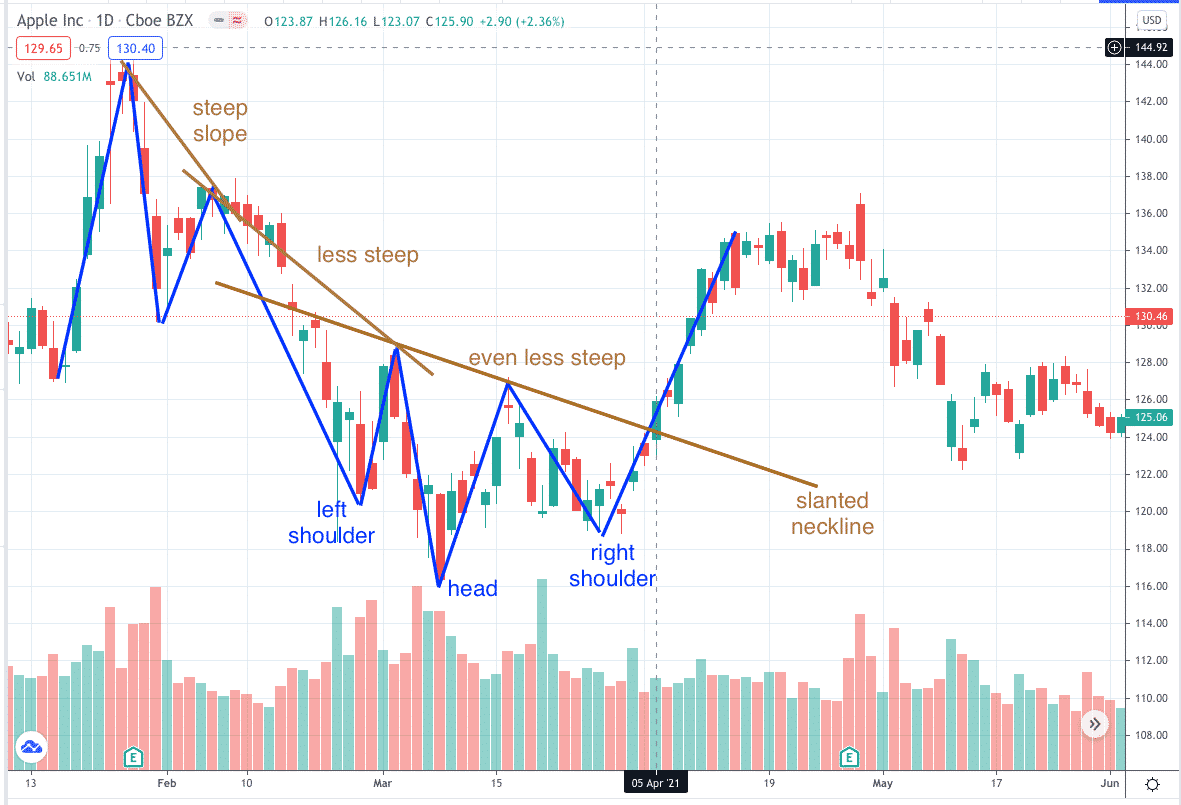
On the left side of the chart, you see lower highs and lower lows forming a steep slope.
Note that the subsequent lower highs are producing less and less steep of slope.
This illustrates the fan principle in effect suggesting that the downtrend is weakening.
The downtrend can no longer be categorized as a downtrend when the right shoulder formed.
Because the right shoulder is not making a lower low.
When prices broke above the neckline on April 5th, it also broke and invalidated the downtrend line.
How can an investor capitalize on this reversal pattern that is spotted?
An investor who does not mind owning Apple stock may put on a bullish ratio spread as follow.
Date: April 5, 2021,
Price: AAPL @ $125.90
Buy one May 21 AAPL $125 put @ $4.95
Sell two May 21 AAPL $120 put @ $2.92
Credit: $88
The payoff diagram looks like this.
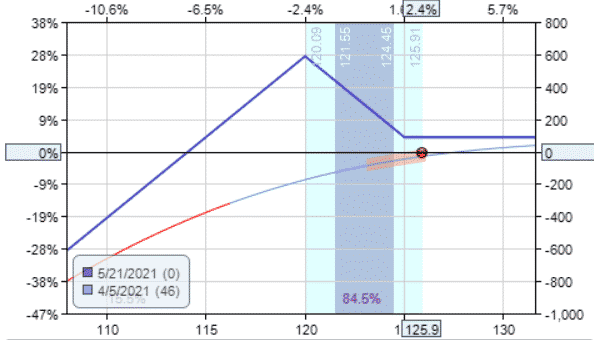
The breakeven point is $114.12, which means that we would be profitable if the price is any point above this at expiration.
This point is lower than the lowest point of the inverse head at $116.21, which AAPL should not go below if the pattern holds.
Keep in mind that if AAPL drops below $120 at expiration, the investor would have to take ownership of 100 shares of AAPL.
On May 21, AAPL closed at $125.43.
All three put options expired worthless and the investor keeps the initial $88 credit as profit.
Double Bottom
The double bottom pattern is the head and shoulders pattern missing one shoulder.
When Nvidia (NVDA) broke the neckline of the double bottom on August 16, 2019, on heavy volume, an investor may initiate a bullish position at that time.
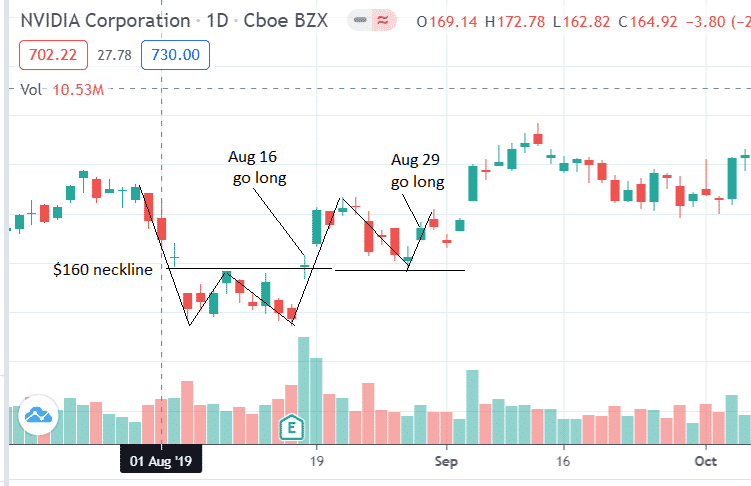
Alternatively, if the investor feels the need for greater confirmation, he or she may wait for the first pullback after the breakout.
This occurred on August 28 when the doji candle touched back down to the $160 support level.
The investor will see how price reacts at that level.
Will it break through lower? Or will it bounce up?
It bounces up on August 29 and the investor takes a bullish position.
This time let’s do a bullish risk reversal where we sell a put and buy a call spread.
Date: Aug 29, 2019,
Price: NVDA @ $167
Sell one Oct 18 NVDA $160 put @ $6.15
Buy one Oct 18 NVDA $170 call @ $8.03
Sell one Oct 18 NVDA $180 call @ $4.13
Credit: $225
The payoff diagram looks like this.
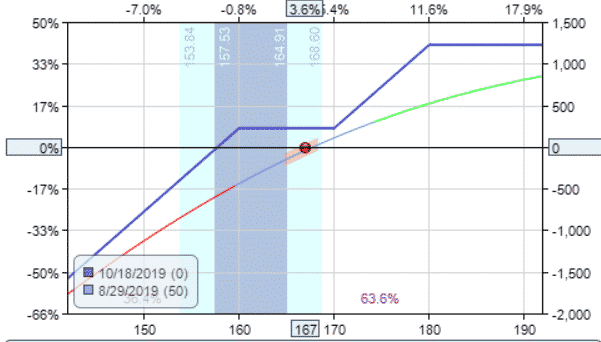
On September 12, the P&L is at $801.50.
But let’s say that the investor did not exit at the top (which is difficult to pick).
Suppose the investor exited on September 20th, then the P&L would be $463.50.
Conclusion
These are just some example trades on how to take advantage of the inverse head and shoulders pattern.
I am sure you will have many (possibly even better ways) of capitalizing on this structural chart pattern.
These patterns are a bit difficult for a computer to scan for.
As you can see, they can come in all different shapes and sizes.
You will gain an advantage if you train your eyes to spot these patterns.
The more time you spend looking for them, the better you will get finding them.
Trade safe!
Disclaimer: The information above is for educational purposes only and should not be treated as investment advice. The strategy presented would not be suitable for investors who are not familiar with exchange traded options. Any readers interested in this strategy should do their own research and seek advice from a licensed financial adviser.


