


Contents
- What Is The Market Profile?
- Identifying Support and Resistance Levels
- Anticipating Trend Reversals
- Recognizing Market Imbalances
- Books On The Market Profile
- Developing A Trading Strategy With The Market Profile
Market profile trading is a powerful strategy that can help traders identify support and resistance levels, anticipate trend reversals, and recognize market imbalances.
With this comprehensive guide, traders will learn the basics of the market profile, how to interpret the data and strategies for successful trading.
By the time you finish this guide, you’ll know how to effectively use the market profile to make informed trading decisions and increase your chances of success.
What Is The Market Profile?
The market profile is a charting study that uses volume data to reveal market tendencies.
By looking at the number of shares that were traded at each price level, traders can see where the supply and demand levels were during the given period.
The result is a visual profile that shows the supply and demand at different price levels over a specific period.
The market profile consists of four main components:
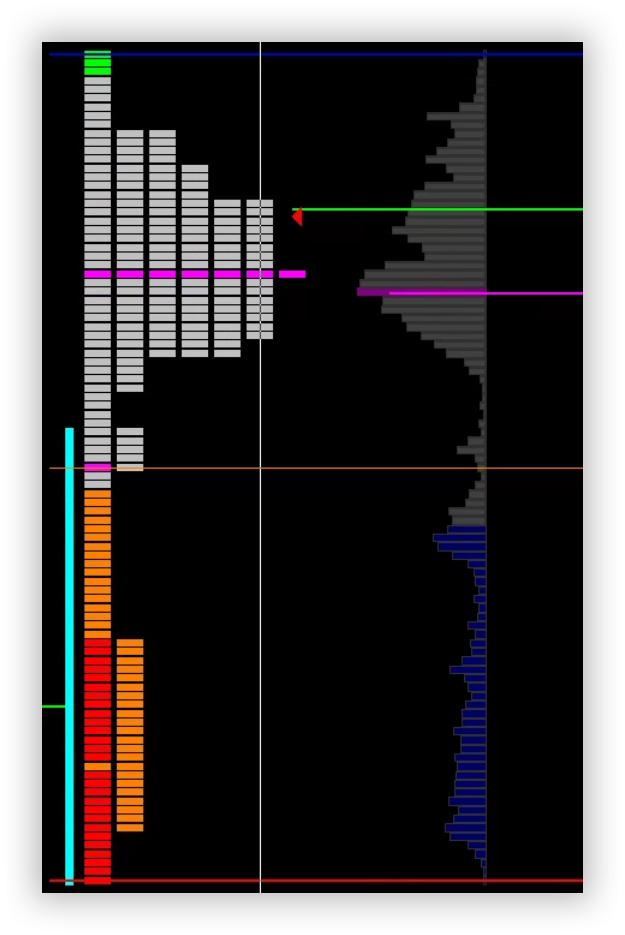
1. The Volume Profile shows the relationship between prices and trading volume over a given period. The profile shows if more volume was traded at higher or lower prices. This is the gray and blue profile on the right.
2. The Price-Volume Graph shows the stock price on the vertical axis and the volume of shares traded on the horizontal axis. The graph reveals the number of shares traded at each price level and the volume at each price level. This is not shown in the picture to the right.
3. The Price Distribution Graph shows the number of shares traded at different price levels. It shows the distribution of prices at which shares were traded over a given period. The light gray, orange, red, and green profile is on the left.
4. The Demand and Supply Graph represents the demand for shares at each price level and the supply of shares at each price level. The graph shows the relationship between demand and supply at each price level. This is also not shown in the picture to the right.
Identifying Support and Resistance Levels
The market profile can help traders identify support and resistance levels.
When there is an increase in demand at a particular price and a decrease in supply at that price, the support level is likely to be found just below that price level.
If there is an increase in supply at a particular price and a decrease in demand at that price, the resistance level is likely to be found just above that price level.
When the demand and supply at a particular price level are equal, that price level is considered to be neutral.
By monitoring these levels and watching for changes in supply and demand, traders can anticipate trend reversals.
If there is an increase in demand at a particular price, it may indicate that the support level will be broken.
If there is an increase in supply at a particular price, it may indicate that the resistance level will be broken.
Support and resistance can be seen on an intraday chart by monitoring the volume profile and can be monitored on a daily chart by looking at how the price profiles line up around certain levels.
Anticipating Trend Reversals
First off, it is nearly impossible to predict what the market will do and where it will go, that said, using the market profile, you can see how price and volume are reacting around price levels, and this can give you some insight into the market.
First is the time component.
If the price has been trending down over the past several weeks and most of the time is spent at the bottom of the profile, and all of a sudden price starts spending entire sessions at the top end of its profile, it can be considered a sign that a reversal is possible.
The other component is volume; as the price is trending down, what do the volume profiles look like?
Is each push lower on light volume, and the bulk is distributed elsewhere, or is strong volume pushing down?
If the volume is light on pushes lower and can be hypothesized that the price may reject higher and reverse because the volume is building higher.
Recognizing Market Imbalances
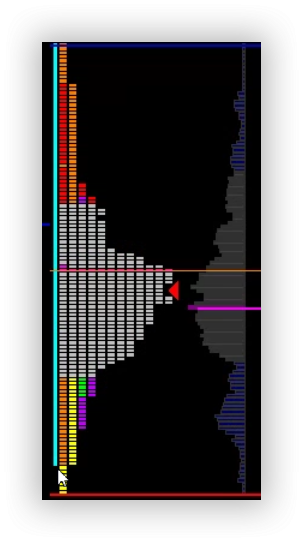
Markets typically like balance; this is visualized on a market profile as a sideways bell curve (an example is to the right).
The ultimate form of balance is when both the price profile and volume profile are nice bell curves; this is a little rare.
An imbalance occurs when the price trades towards the top or bottom of the profile.
When this occurs, it can tell about where the market may trade next.
What this means, though, depends on the timeframe that you are trading on.
In the shorter time frame, it can mean the price will stay where it has been concentrated.
On a larger time frame, you will often see price and volume trade out so that a nice bell curve exists.
This is not a 100% tried and true event, but it does happen often enough to be noticed.
Books On The Market Profile
Hundreds of books cover the basics of the market profile and how to use the data within the chart. Here are a few of our favorites:
- The market profile: An Introduction to Trading Behavior. This is a good guide for those who are just starting out and looking for the basics of the market profile.
- Trading the market profile: Profiting from the Shifting Winds of Supply and Demand. This book provides an in-depth look at how to use the market profile to make successful trading decisions.
- The Stock Market Indicator. This book provides a detailed overview of how the market profile works and how to use the data.
Developing A Trading Strategy With The Market Profile
The market profile can be used to develop a trading strategy that takes advantage of supply and demand levels.
By studying the relationship between prices and trading volume at different price levels over a specific period, you can see where the supply and demand levels were during that time.
This can help you anticipate changes in the market and make trading decisions with more confidence.
There are three steps to developing a market profile trading strategy.
They include understanding the basics of the market profile, collecting the necessary data, and interpreting the data to create a trading strategy.
First, you need to understand the basics of the market profile.
You should know what each of the four main components is, how each component works, and how you can use them to create a trading strategy.
Next, you need to collect the data for the market profile.
You can use real-time data or end-of-day data. You can also use data from a variety of markets in order to create a broader trading strategy.
Finally, you need to interpret the data and create a trading strategy.
You can use the data from the various components of the market profile to deduce support and resistance levels, anticipate trend reversals, and recognize market imbalances.
This can help you create a trading strategy that allows you to profit from changes in supply and demand levels.
The above steps are fairly broad, but as with all things trading, everyone must interpret things the way that they feel fits them.
There is no one-size-fits-all approach, and if you consistently profit from the strategy you create, then it is the right strategy for you.
We hope you enjoyed this article on market profile trading.
If you have any questions, please send an email and leave a comment below.
Trade safe!
Disclaimer: The information above is for educational purposes only and should not be treated as investment advice. The strategy presented would not be suitable for investors who are not familiar with exchange traded options. Any readers interested in this strategy should do their own research and seek advice from a licensed financial adviser.


