


Today we’ll see how to draw support and resistance lines.
Traders use different parameters to make trading decisions.
Support and resistance is one parameter that traders use to enhance their trading decisions.
Identifying the best support and resistance levels requires experience, which leads to excellent trading decisions.
So, let’s see how to draw the support and resistance levels and use them effectively for trading.
Contents
- Support and Resistance Explained
- How To Draw Support And Resistance Levels
- Significance Of Support And Resistance For Trading
- Bottomline
Support And Resistance Explained
The support and resistance are key price levels where the price previously has shown some reaction.
Support is the price zone from where the price rose due to immense buying interest.
Similarly, resistance is the zone from where the price fell due to supply concentration and demand exhaustion.
The price pause near the support level in a downtrend and reverses with the emergence of considerable buying interest.
The increase in the buying interest is due to the price drop in the asset.
Likewise, the resistance zone is the price level where selling interest emerges, as the sellers view the asset price as overstretched.
The traders base their decision on whether the price will break or halt near the support or resistance level.
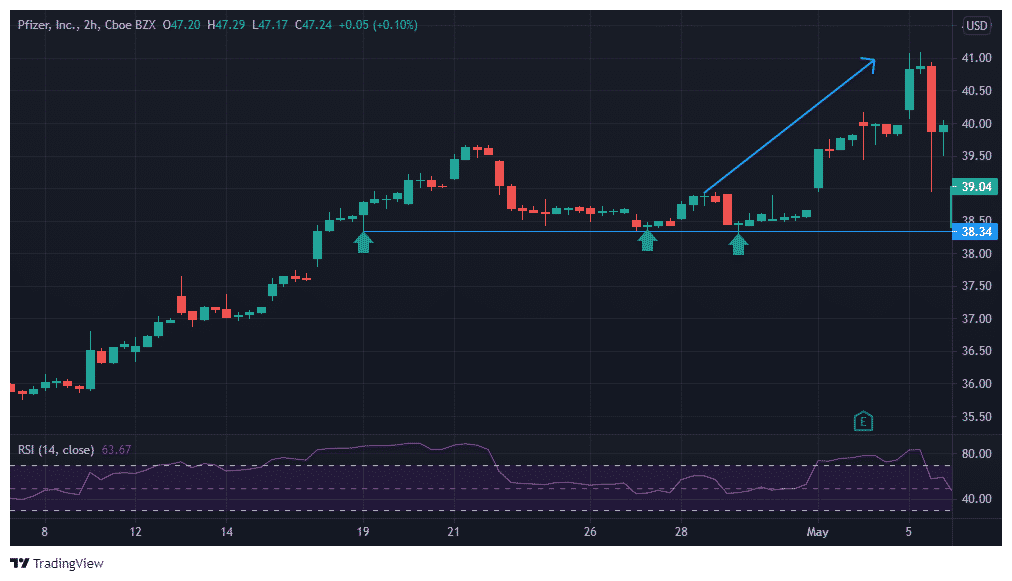
The 2-hour chart of Pfizer, Inc. (PFE) reveals the significant support of the price at $38.34.
After testing the support for the third time, the price surged.
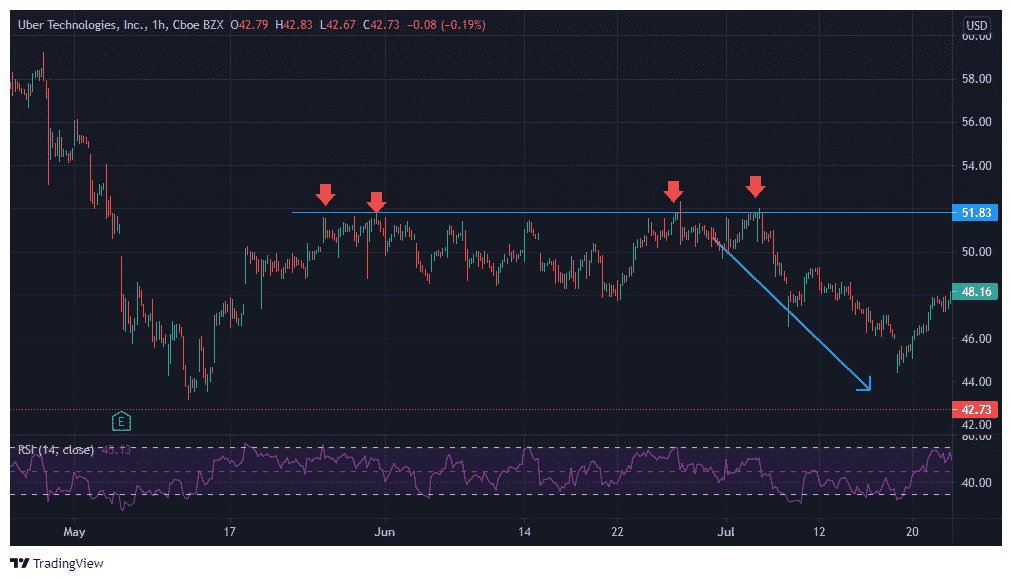
Let’s see the example of resistance. The hourly chart of Uber Technologies, Inc. (UBER) reveals stiff resistance around $51.83.
The price tested the resistance level several times before falling due to an increase in supply.
It is essential to note the price action at the support or resistance level.
For example, the price may reverse or break the support level to advance to the next support.
Similarly, the price may face pressure at the resistance level and slide down or cross it with heavy force due to increased demand.
How To Draw Support And Resistance Levels
You should draw support and resistance carefully so that the crucial levels are not left behind.
To draw support and resistance, you need to follow the below steps: –
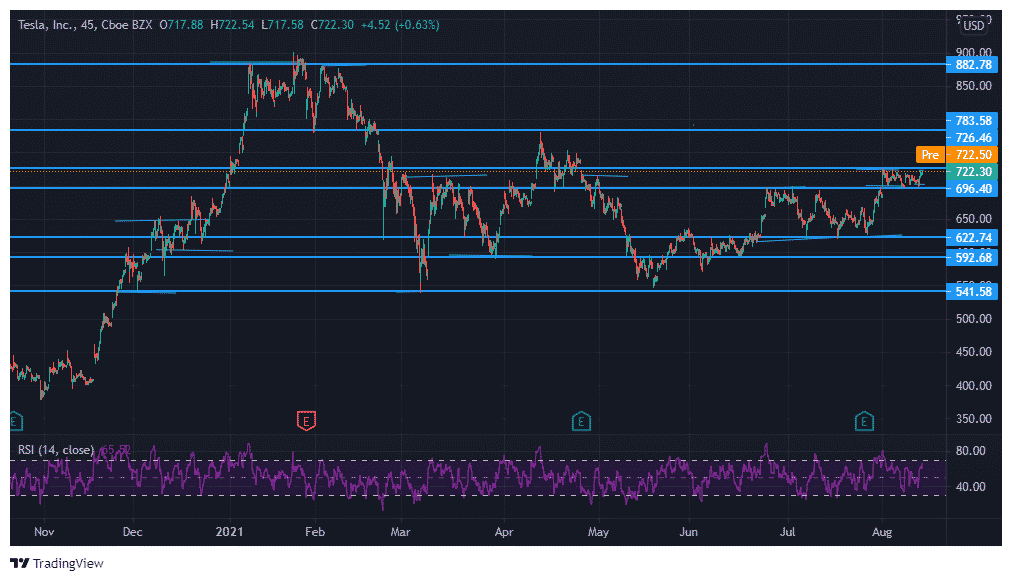
- First, identify all the swing highs and lows in the chart. It would require you to dig a bit over the past data.
The swing highs/lows are marked on the 45-min chart of Tesla, Inc. (TSLA).
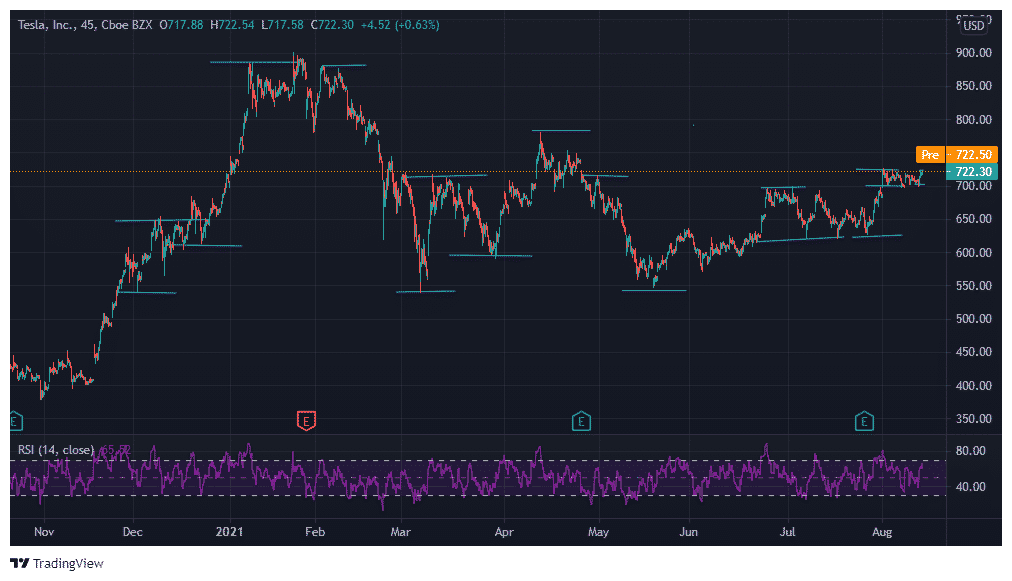
- Next, draw the horizontal lines linking the different swing highs and lows. Of course, the highs and lows may not be precisely located on the horizontal line. But you can always draw a horizontal line connecting two or more swing highs/lows.
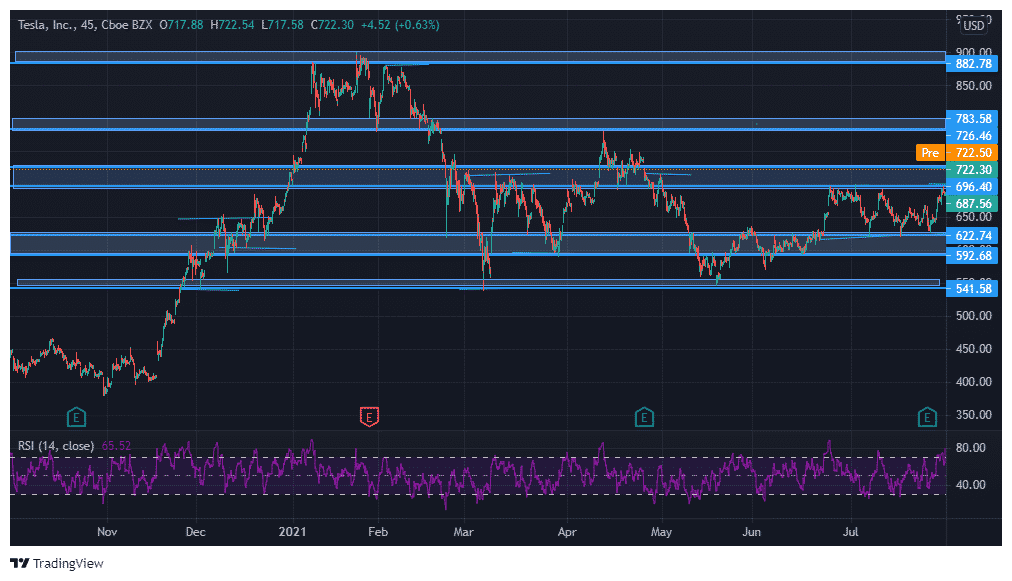
- The market often turns volatile, and the price spikes through the levels or turns away before the support/resistance. Hence, instead of using support/resistance lines, it is helpful to use the support/resistance zones to improve the trading decisions.
The Tesla 45-min chart below reveals the support/resistance zones.
Access the Top 5 Tools for Option Traders
Significance Of Support And Resistance For Trading
The price tends to float between the support and the resistance during range-bound markets.
However, the price breaches the support/resistance levels during trending markets to advance to the next level.
It continues its trend until it faces massive selling or demand pressure from the opposite end.
To overcome the resistance, the buyers need to overpower the sellers with greater force.
Similarly, the sellers need to exert more significant pressure to overcome the buying interest of buyers for the price to breach the support level.
Various factors influence the significance of support/resistance levels.
Let’s have a look at them.
- The number of times price touches the support/resistance levels- The support/ resistance becomes more significant if the price tests it multiple times. Hence, to break such a level, a colossal force is required from the opposite end.
- The ‘price move’ before it tests the support/resistance- The price in a fast and ferocious uptrend will be halted at a more crucial resistance level as the sellers exert more significant pressure.
- Volume at certain support/resistance levels- The support/resistance level where the buying and selling volume is more is likely to act as a substantially strong level. The resistance level that sees a high volume activity with a price drop is expected to be the sellers’ dominance area. Hence, the price will tend to struggle near it and would reverse.
- Time- The significance of the support/resistance zones increases if the same has been tested at frequent time intervals.
Bottom line
The traders use support and resistance levels for technical analysis to understand the price action.
These levels are respected or violated with a greater opposite force.
Hence, the traders use these levels to initiate a reversal trade or a directional trade depending upon their view and judgment.
The support and resistance levels are vital in making trading decisions ranging from intraday to short-term investing.
Trade safe!
Disclaimer: The information above is for educational purposes only and should not be treated as investment advice. The strategy presented would not be suitable for investors who are not familiar with exchange traded options. Any readers interested in this strategy should do their own research and seek advice from a licensed financial adviser.


Gavin,
Great explanation. A question that always nags at me when it comes to reading charts: What date range should I use? A 1 month chart or a 1 year chart, etc.? A daily candle, vs. a 30-minute candle, etc.? Any guidance along those lines? Thanks!
You should match it to your trading time frame. If you swing trading for 1-3 days look at a short-term term chart for example. If you’re hold period is 2-3 months, then look at a 6 month or 12 month chart. Hope that helps.
Ah, I see. That helps. Thanks