


Today, we will be looking at one important candlestick pattern, i.e., the Long Wick Candles.
Candlestick patterns represent different price actions between the buyers and the sellers and help us identify the market trend.
The body and wick of the candle reflect the open, high, low, and close prices and reflects the price action during a particular period.
Contents
- What Does Long Wick Candle Mean?
- How To Spot Long Wick Candles?
- How To Trade Long Wick Candles?
- Final Thoughts
What Does Long Wick Candle Mean?
A candlestick consists of the body and the wick.
A candle with a short wick indicates trading action around open and close prices.
In contrast, a long wick candle means the trading activity of the buyers and sellers extending beyond the open and the close.
Long wick candles reflect the price rejection at higher or lower levels.
But, first, you must understand how such long wick candles get formed.
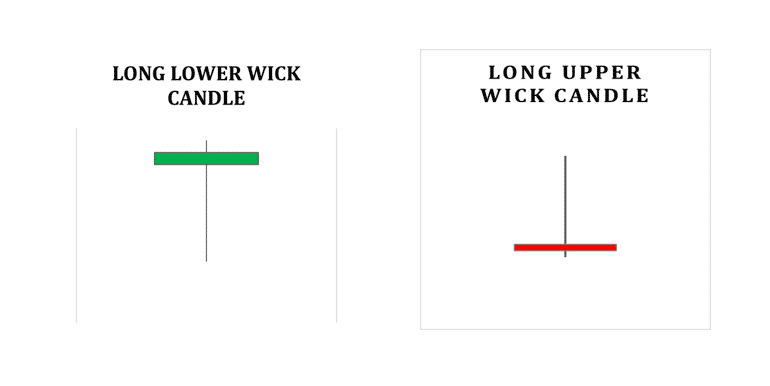
There are two kinds of long wick candles, the long upper wick and the long lower wick.
A long upper wick candle indicates the buyers’ dominance for a more significant period, but the sellers finally lowered the prices.
Therefore, it suggests exhaustion of the demand at higher levels.
Similarly, a long lower wick candle shows sellers dominating the session, but buyers eventually managed to push the price up from the lower level.
It reflects enormous demand at the lower levels, due to which the price resist falling further and tend to move up.
How To Spot Long Wick Candles?
To identify long wick candles, you can follow the below steps:-
- First, try to spot the candle with a long wick considerably longer than the wicks of surrounding candles.
- Identify the vital price levels such as support/resistance that coincides with the long wick.
- Finally, try to find trading opportunities with the combination of key price levels and long wick candles.
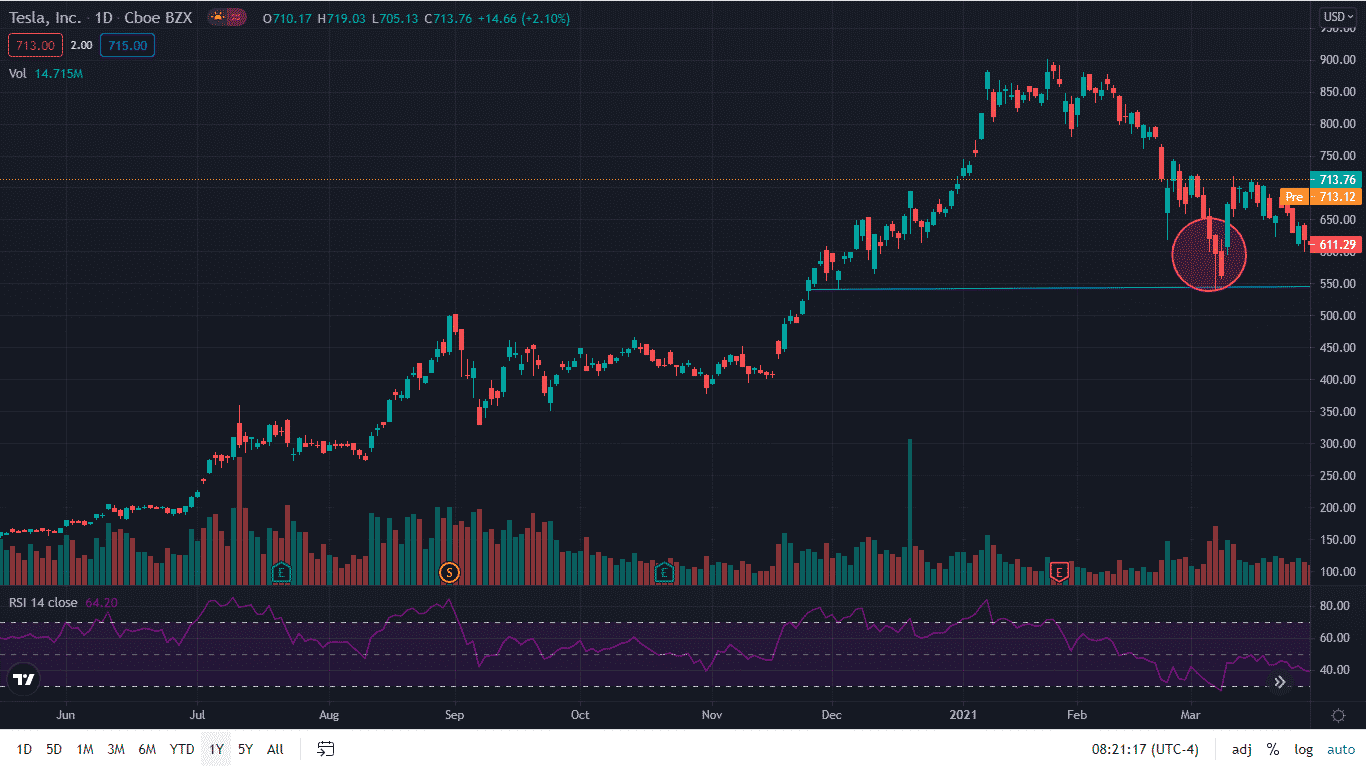
The chart below of Tesla Inc. (TSLA) reveals the formation of a long lower wick candle on a daily timeframe on 05th March 2021.
Furthermore, you can see that the long wick candle is formed around $ 550 level, which had earlier acted as support, and the price had reversed from there.
Hence, with the formation of such a long lower wick candle, you can initiate a long trade in Tesla.
Click Here For My Top 7 Technical Indicators
How To Trade Long Wick Candles?
Long Wick Candles are generally price reversal candles.
The long upper wick candle signals the possible downward price reversal, whereas the long lower wick candle signals upward price movement.
First, you need to understand the market trend.
Second, you must identify the available trade opportunity and pounce on it after spotting such candles.
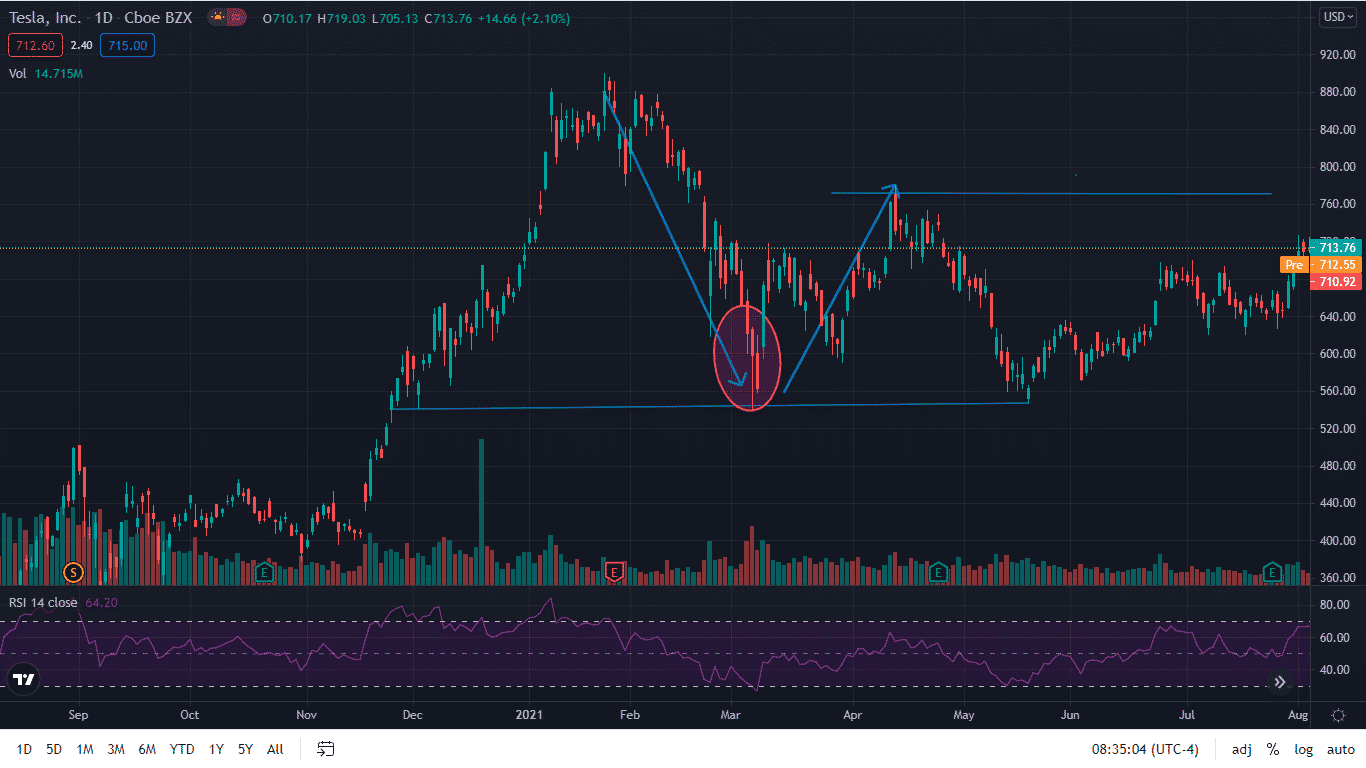
Let’s take the example of Tesla Inc. (TSLA).
The Tesla Stock was downtrend, falling from $900 to $550 on a daily timeframe.
The level $550 was a strong support zone.
Further, the formation of the lower wick candle near it confirmed a possible upside reversal.
Though the sellers were dominant, the buyers managed to push the price up from the support level.
Hence, with the buyers come into the act, one can expect a possible reversal.
After spotting the lower wick candle on the daily timeframe, you can initiate a long trade on the stock at around $550 level.
You can notice that the stock touched $780 within one year, as reflected in the chart below.
The long wick candles can occur in any timeframe.
However, the larger the timeframe, the more reliable is the chance for the possible price reversal.
Let’s take an example of how such candlesticks formation in a shorter timeframe, say hourly, can also provide excellent trading opportunities.
The below is the hourly chart of Microsoft Corp. (MFST).
The long upper wick candle was formed in an hourly timeframe on 16th June 2021, during the first hour of the day.
The long upper wick candle formation at around $283 coincided with the earlier resistance.
Hence, you can expect a possible downside reversal.
Therefore, shorting the stock seemed to be a great trading opportunity.
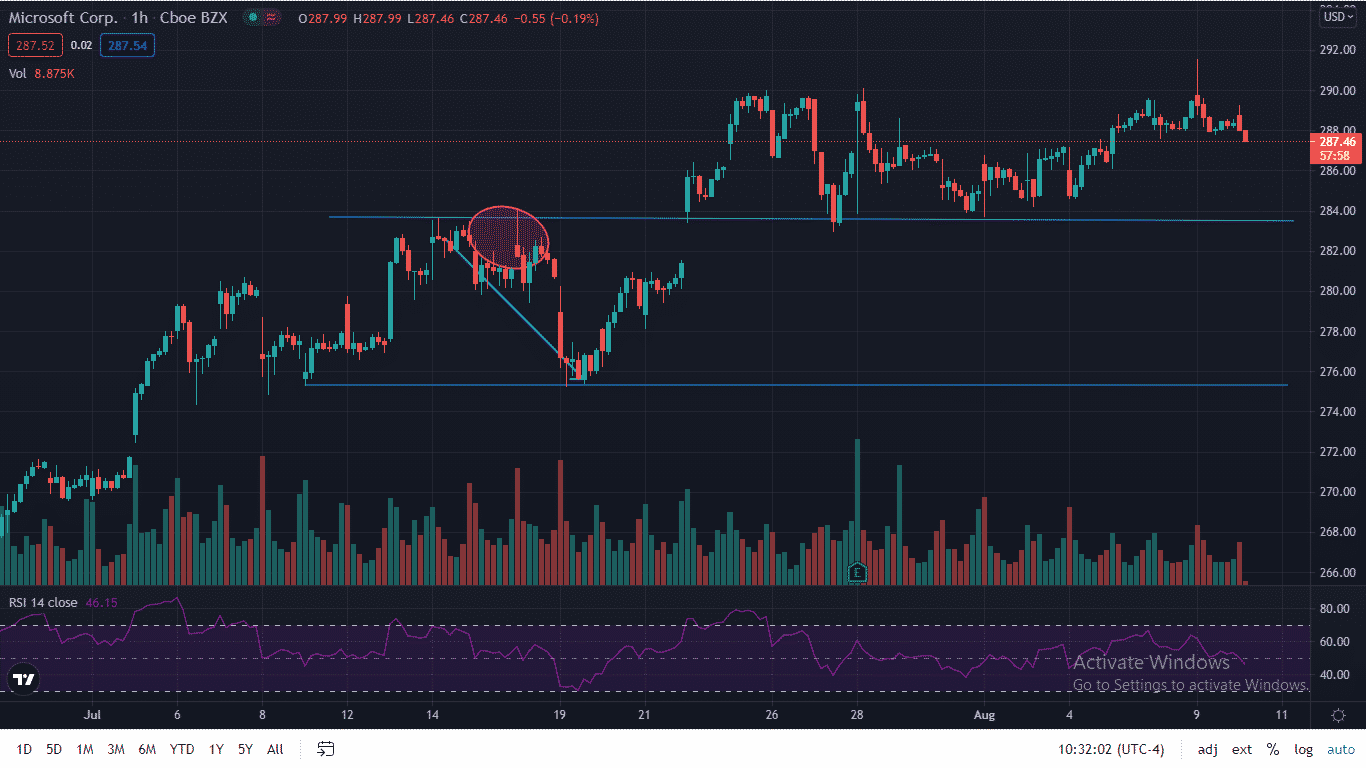
The price reversed and fell to its support level of $275 within a couple of trading sessions.
Thus, such long wick candlesticks can be used to gauge the possible price reversal in timeframes from 15-min to hourly and daily.
Final Thoughts
Long wick candles are formed at the top or bottom of a trend.
It indicates the possible price reversal.
Such candles should be used in combination with crucial support or resistance level to identify the trading opportunity.
The long wick candles formation in a 5 or 15 min timeframe help the day traders, whereas the swing traders spot such candles on 3-hour or 4-hour charts.
Thus, long wick candles, along with other trading indicators, provide excellent trading opportunities.
Trade safe!
Disclaimer: The information above is for educational purposes only and should not be treated as investment advice. The strategy presented would not be suitable for investors who are not familiar with exchange traded options. Any readers interested in this strategy should do their own research and seek advice from a licensed financial adviser.


