


Heikin Ashi charts look slightly different from the typical candlestick charts that you are used to.
Contents
Here is a traditional candlestick chart of the RUT in the last half of 2021.
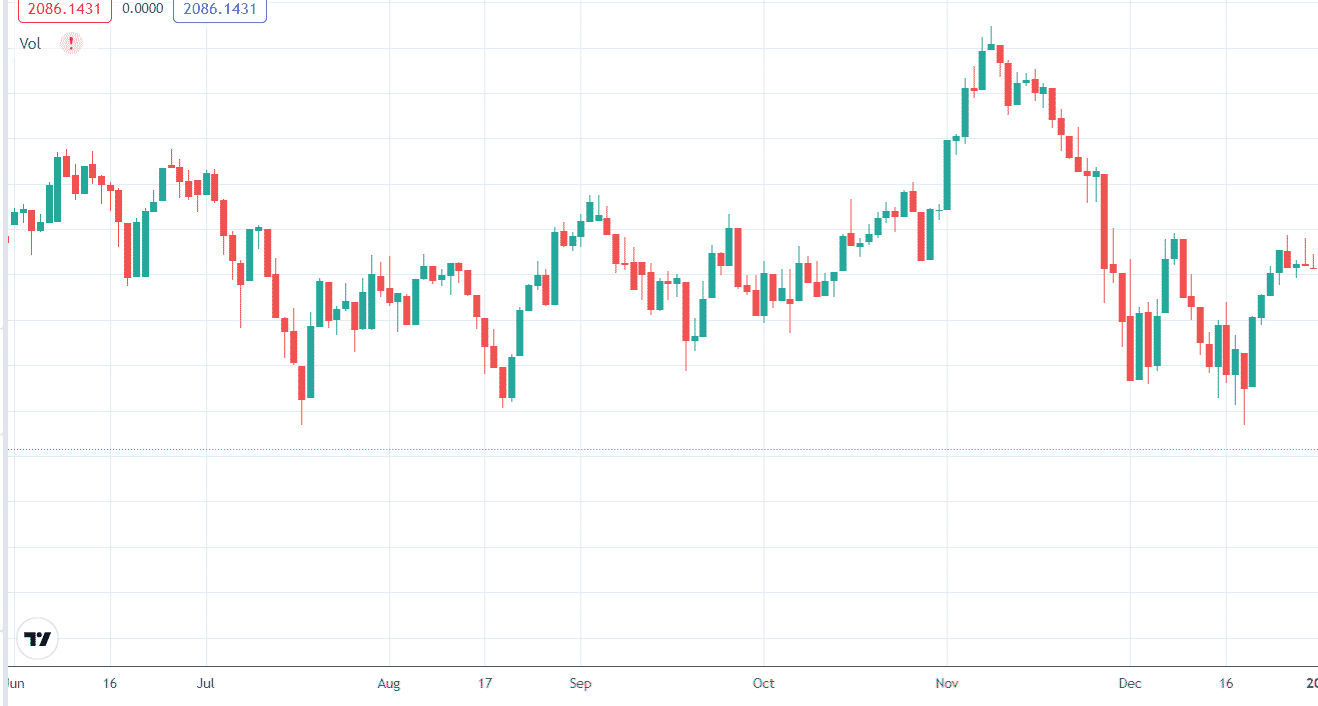
source: tradingview.com
There are 71 candle color changes during this six-month period.
Below is a Heikin Ashi candlestick chart of the RUT for the same time period.
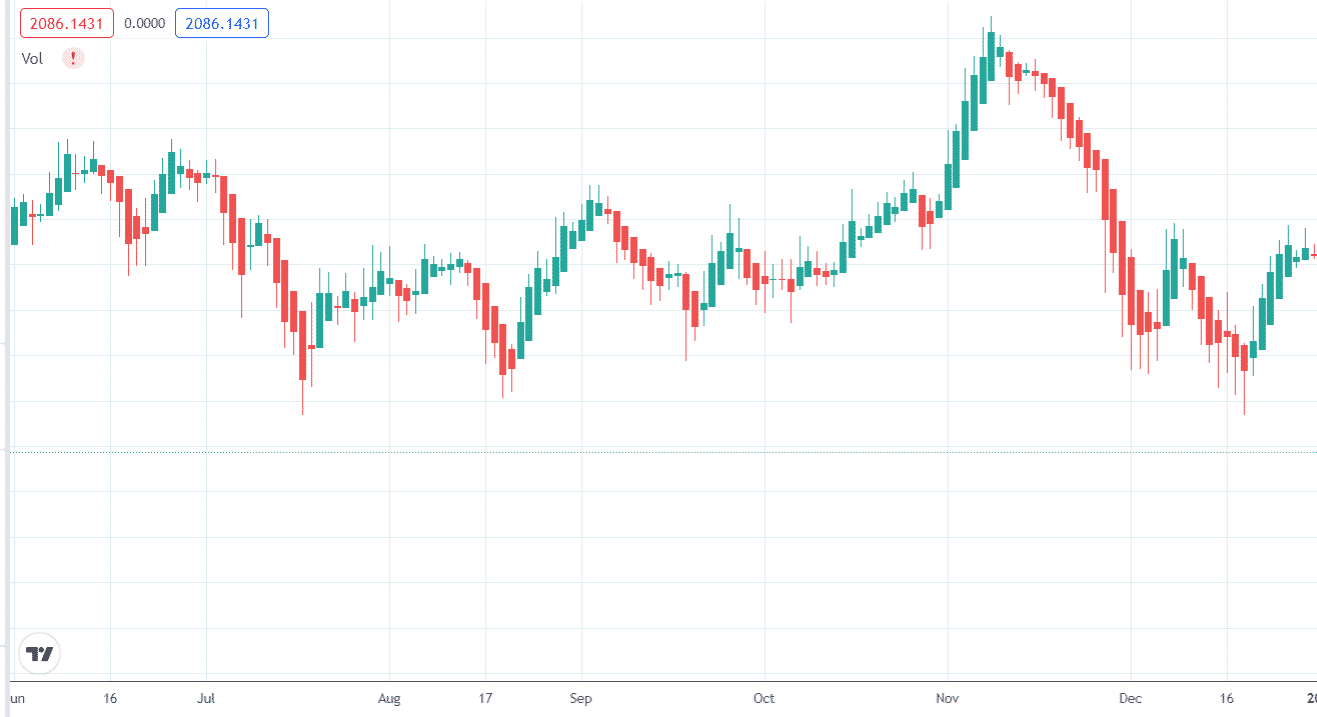
source: tradingview.com
It has only 39 color changes.
It looks smoother with more extended series of greens and reds, making it easier to spot a trend.
More important is that it helps traders stay in the trend because it gives fewer false signals.
They are less likely to be shaken out of an existing trade when a red candle appears, followed by a switch back to a green candle.
Those who tend to anxiously look at the price chart constantly while in a trade, will become less emotional when looking at the Heikin Ashi chart.
Fewer color changes mean fewer decisions you have to make and fewer questions about whether to get out.
Why Doesn’t Heikin Ashi Change Color As Often?
It has to do with the formula in which the candles are calculated.
The traditional candlestick is drawn using only four numbers of the current day: the high, the low, the open, and the close. It doesn’t use any information from the past to draw the current candle.
The Heikin Ashi candlestick uses information from the previous candle to compute the current candle.
In particular:
The Heikin Ashi Open of the current candlestick is the midpoint of the previous Heikin Ashi candle’s body.
HA_Open = ( Prev_HA_Open + Prev_HA_Close ) / 2
By this equation, the Heikin Ashi chart can not have any gaps from one candle to the next.
The Heikin Ashi Close of the candle is computed by
HA_Close = (Open + High + Low + Close) / 4
It is the average of the current day’s open price, high price, low price, and close price.
The Heikin Ashi High is the maximum of the High, Open, and Close.
The Heikin Ashi Low is the minimum of the Low, Open, and Close.
For example, on July 20, 2021, the Heikin Ashi candle had a high of 2206.6 and a low of 2131.8. The traditional candlestick on the same day has the same high and low.
That means the candle’s range and location on the charts are the same. Only the shape and color of the candles are different.
In short, the calculations are doing a lot of averaging of the numbers.
I don’t speak Japanese. So when I put in “Heikin Ashi” into Google Translate, this is what I got:
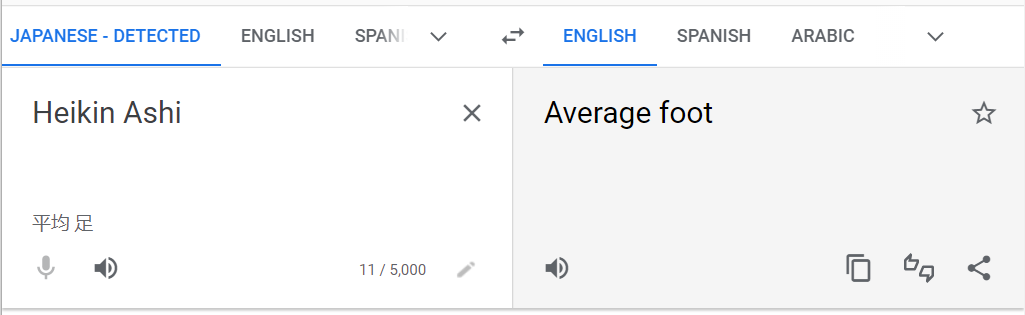
If you consider a “foot” is used to set the “pace,” then you can think of “Heikin Ashi” as “average pace.”
Wicks
Another aspect of the Heikin Ashi candlestick is that they don’t have a lot of wicks. The red candles in a downtrend look like a clean-shaven head.
In contrast, the standard candlestick in a volatile market looks like it has a bad hair day.
Similarly, on an uptrend, there is almost no bottom wicks.
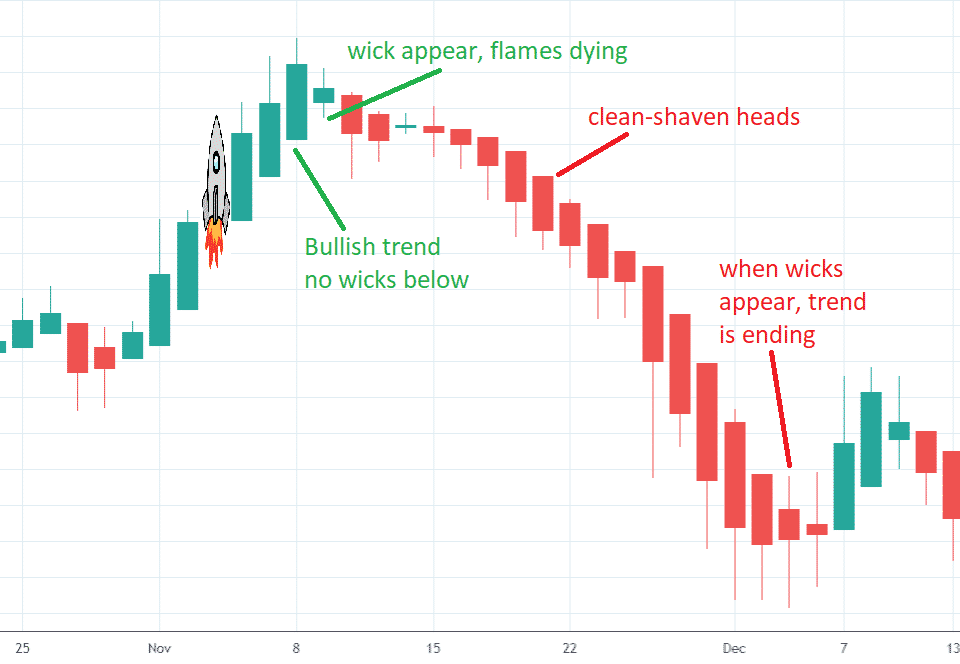
One way to remember is to think of the green candle as a rocket ship going up, and the flames burned off all the bottom wicks.
Be careful when bottom wicks start showing up. It means the flames are dying out. The uptrend may start to end.
You can also see trend strength from the size of the candles as usual.
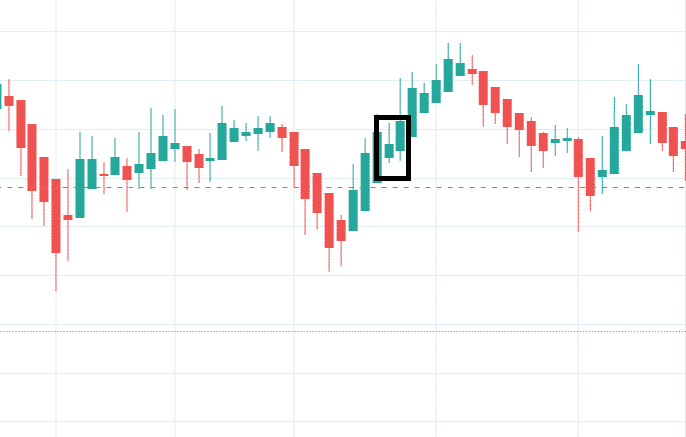
Would You Exit?
Suppose we were on the far right edge of the chart on August 26, 2021, after buying the rebound of the recent low. Would you exit after seeing this latest red candle?
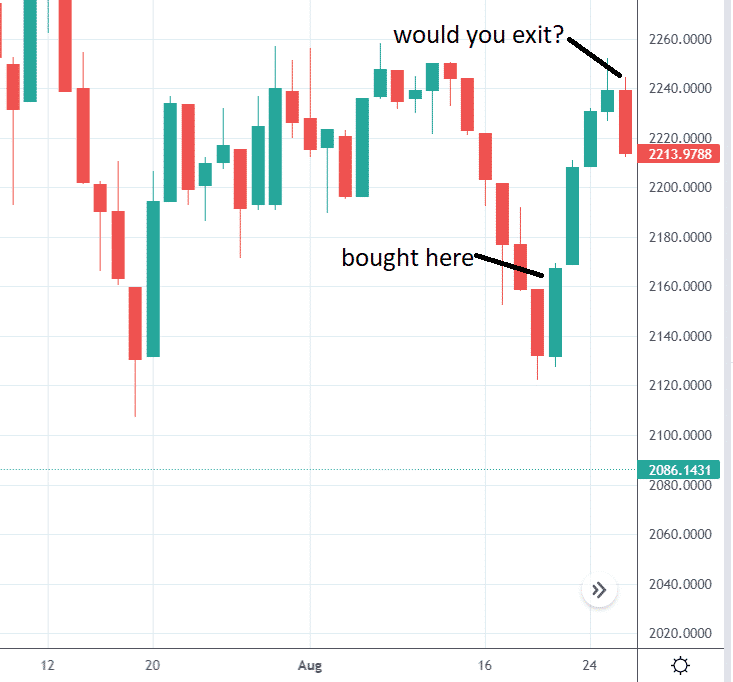
Decisions, decisions, and more decisions. The answer is that some traders would have exited.
On the Heikin Ashi chart, the candle is still green, although a bottom wick is starting to appear,
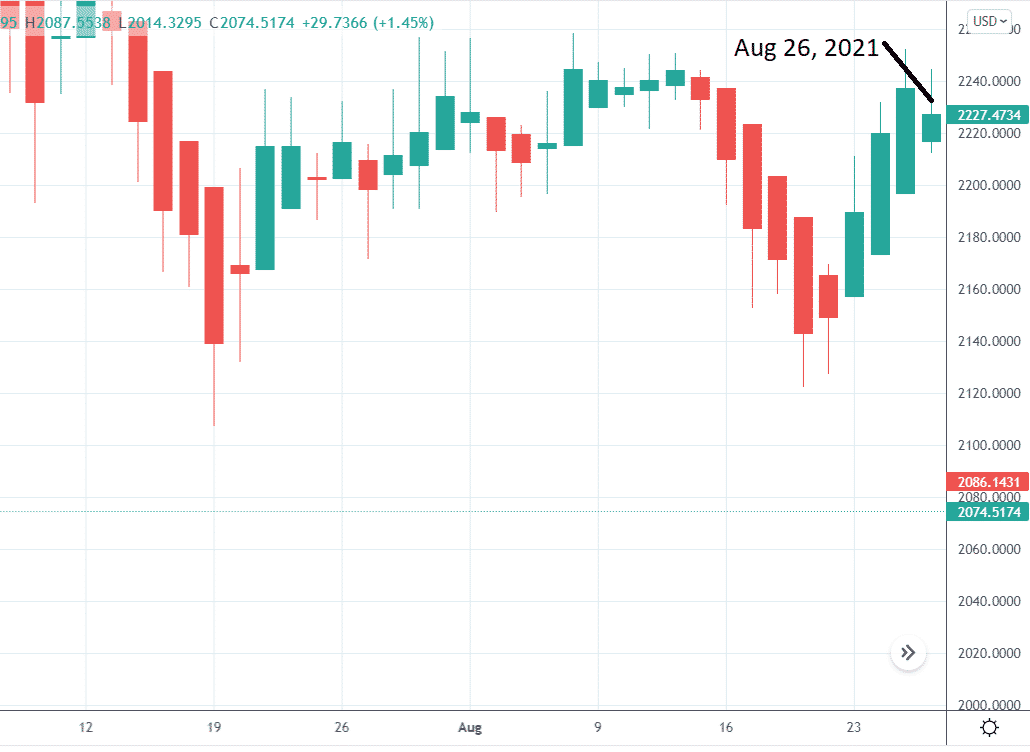
Fewer traders would exit when viewing this chart simply because it had not changed color. Some might not even take a second glance.
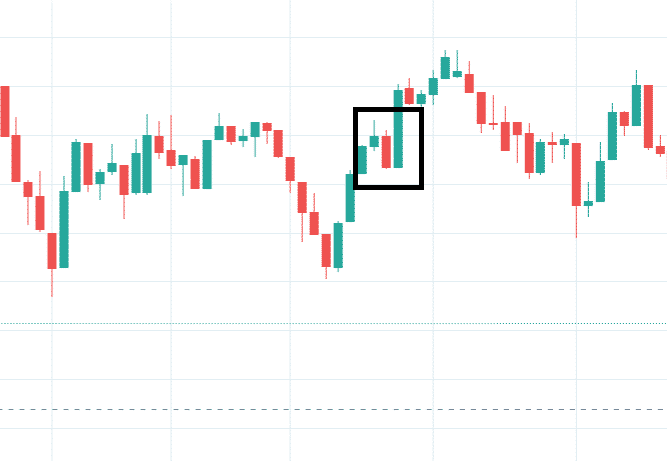
Here is what happened afterwards.
Conclusion
Some traders like the Heikin Ashi candles because they smooth out the market’s noise to help them spot the trend and prevent them from being shaken out by the whipsaw movements.
Many use them in conjunction with other indicators.
Other traders prefer not to use them because they can not see the fine-grain day-to-day price action.
The current candle that is in progress of render does not show the true price of the stock but shows a calculation based on the current price and the previous day’s price.
Give it a try and see which is the case for you.
Trade safe!
Disclaimer: The information above is for educational purposes only and should not be treated as investment advice. The strategy presented would not be suitable for investors who are not familiar with exchange traded options. Any readers interested in this strategy should do their own research and seek advice from a licensed financial adviser.


Excellent explanation! Thanks, Gavin