


Contents
- Long Put
- ITM Options Have A Larger Magnitude Of Delta
- ATM Options Have Larger Vega
- OTM Options Are Less Expensive
- Delta And Vega Effects Are Greater For Options Closer To Expiry
- OTM Options Have Higher Percentage Gain
- Long Calls
- Selling Cash Secured Puts
- Bull Put Credit Spreads
- Further Out Credit Spreads
- Bear Call Spread
- Iron Condors
- The Butterfly
- Going Long Volatility
- Straddle
- Strangles — Getting More Vega For Your Money
- Calendars
- Call Diagonals
- Put Diagonals
- Conclusion
Many beginner option traders underestimate the effects of volatility on option trading strategies. They may think that if the price stays around where it should stay, then it’s all good.
However, a sudden one-day spike in volatility can cause larger than expected swings in profit and loss.
Option sellers in particular are hurt by a sudden rise in implied volatility (IV) because it pumps up the extrinsic value of all options and makes the price of options go up — exactly the opposite of the direction that option sellers would like them to go.
When investors sell options (as in iron condors, credit spreads, short straddles/strangles), they are short volatility and short vega. They want both of those to go down.
Hence, a spike in VIX (an index of the volatility of the S&P 500) can cause these strategies to become unprofitable.
Investors who invested their entire portfolio into short options can incur a substantial drawdown, if not lose the entire account altogether (as in the case of optionsellers.com).
Do not allocate the whole portfolio into short vega strategies. A much better plan is to have a mix of short vega and long vega.
Or if you only specialize in short vega strategies, then only allocate a portion of the portfolio to it, and leave the remainder in cash or safer assets.
Using backtest data and P&L calculations from OptionNet Explorer, we will look at how much each option strategy would have lost or gained during the volatility spike of January 27, 2020, which at the time was the third largest single day increase in the VIX since 1990 (according to the data presented by Brent Osachoff).
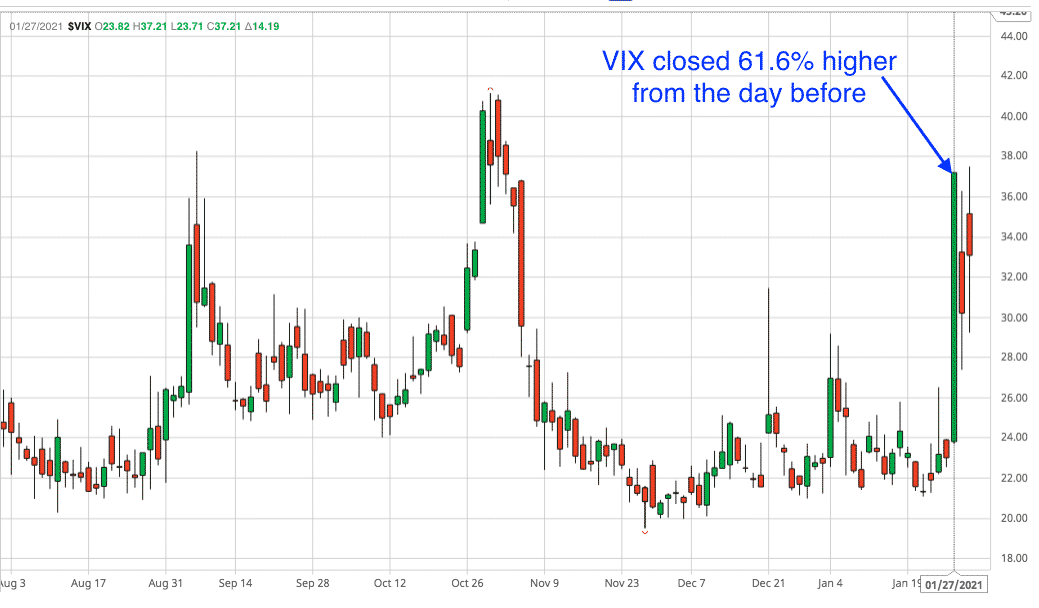
These volatility spikes can come without warning.
Even professional managers who track dozens of volatility metrics daily did not see this one coming.
The spike in VIX was accompanied by a large drop in SPX.
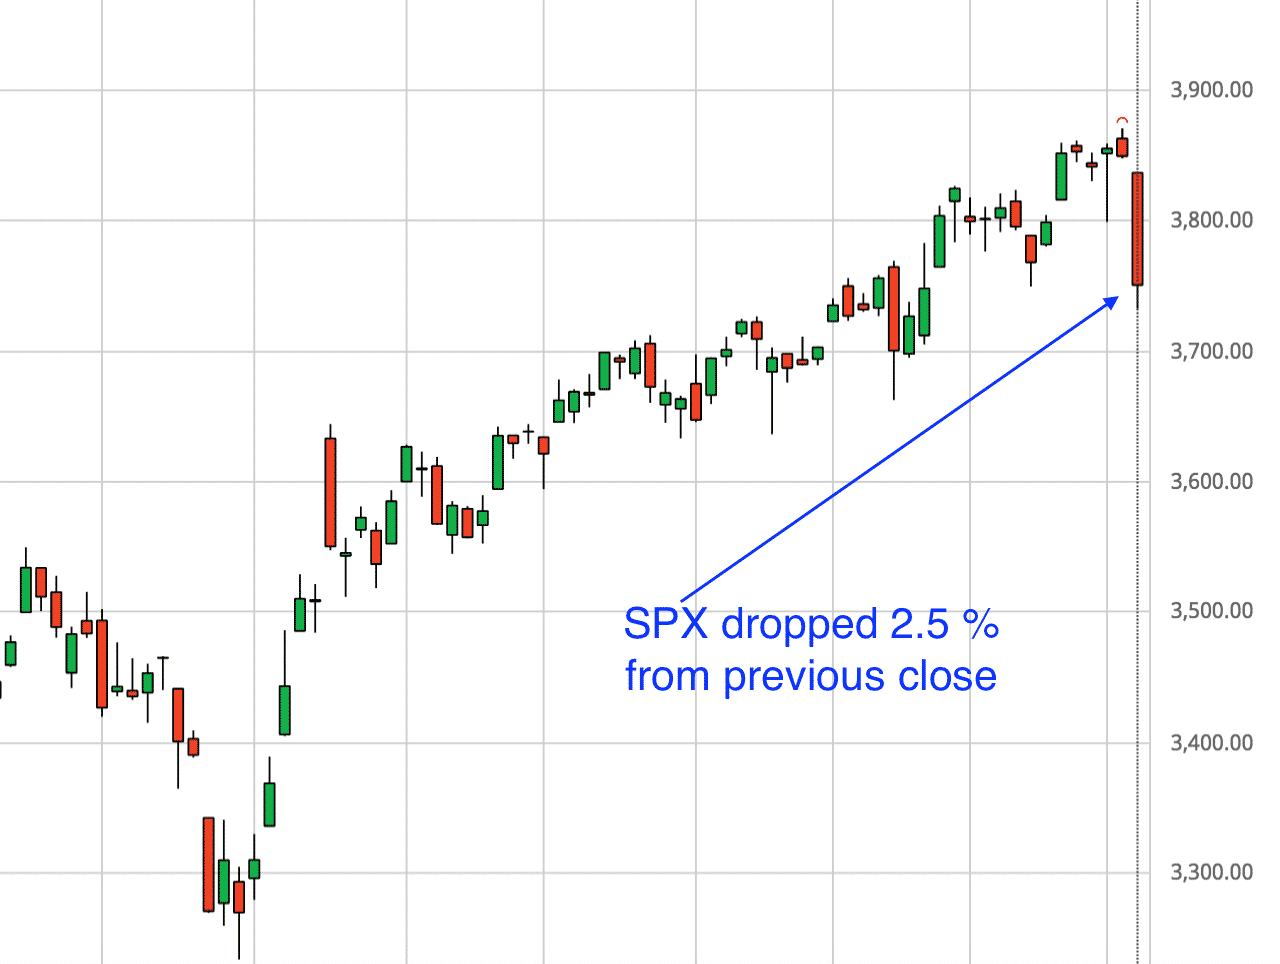
For each of the below option strategies, the trade starts at the end of market day on January 26, 2020 and the ending profit/loss (P&L) is the end of the market day on January 27.
Long Put
The value of long puts increases on that day because the price went down, and volatility went up — both of which benefit the long put.
The following shows the put option prices from Jan 26 close and Jan 27 close.
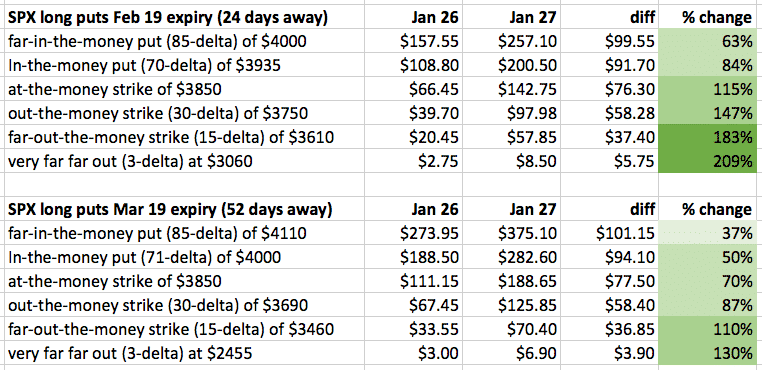
For example, an investor who purchased one SPX put with the $3850 strike expiring on March 19th would have made a profit of $7750 on the following day.
There are several things to note about the numbers.
ITM Options Have A Larger Magnitude Of Delta
As we look at options out-of-the-money (OTM) to options in-the-money (ITM), the OTM options have a larger magnitude of delta.
That means that for a unit of price change, there is a larger percentage change in the value of the option.
We see this with the February 19 expirations where the 15-delta put gained $37.40 while the 85-delta put gained $99.55 in value.
We see the same effect with longer-dated options as shown in the March 19 expiration.
ATM Options Have Larger Vega
Options closer to at-the-money (ATM) have higher vega values.
As options are move in-the-money, their vega decreases.
As options are move out-of-the-money, their vega also decreases.
OTM Options Are Less Expensive
OTM puts cost less than ITM puts.
For example, the 15-delta, Feb 19 put costs $20.45 on January 26.
At the same time, the 85-delta put of the same expiry cost $157.55.
Delta And Vega Effects Are Greater For Options Closer To Expiry
The short-dated options (see the Feb 19 puts) have a higher percentage gain across the strikes than the long-dated options (see the Mar 19 puts).
This also has to do with the fact that short-dated options are less expensive.
OTM Options Have Higher Percentage Gain
When the effects of delta and vega and the cost of the options are all considered, an interesting pattern emerges as highlighted in green in the table.
The OTM options have a higher percentage gain in value than the ITM options. This is true of short-dated options as well as long dated options.
You can say that the OTM options (because of their low price) have a greater “bang for the buck”.
For this reason, some investors buy inexpensive far out of the money put options as hedges against market crashes. Here we see that the value of a 3-delta put with 24 DTE (days to expiration) has doubled in price in one day.
Long Calls
For long calls, the increase in IV is favorable, but the price direction is not.
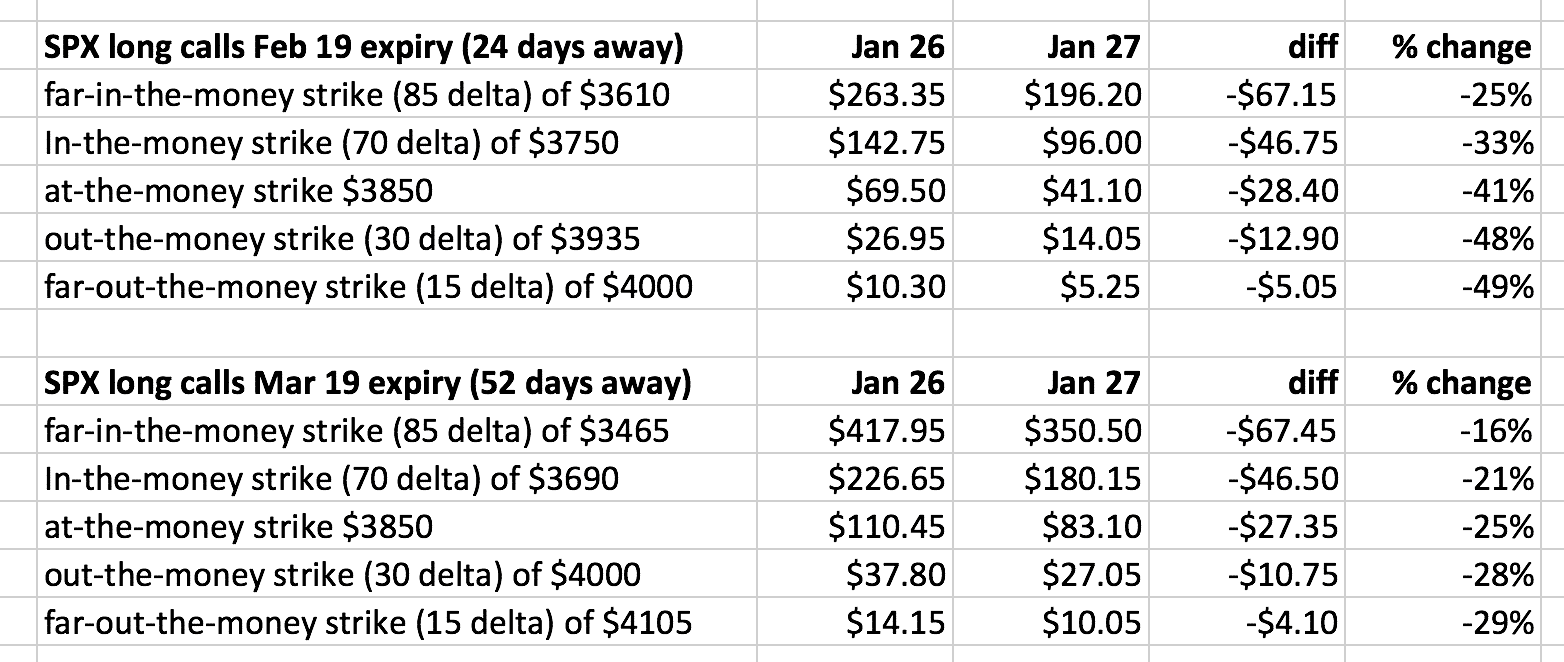
All the calls lost money.
The favorable spike in volatility was not able to overcome the unfavorable movement in price.
In this case, delta trumps vega.
The effect of delta is stronger for options closer to expiry.
The options closer to expiry lost more money on a percentage basis than those options further away.
While the ITM options lost more in absolute dollar terms, they the lost least in percentage terms.
The calls that lost the least in percentage terms were the long-dated in-the-money calls.
Selling Cash Secured Puts
Since long puts profit when volatility goes up, short puts (such as selling cash secured puts) will suffer when volatility goes up.
The short puts that are closer to expiration will suffer more. The ones further out-of-the-money will lose more money on a percentage basis than ones closer to the money.
In addition to considering directional price movement, this is something to consider when selling cash secured puts to acquire stock or for the wheel strategy. Doing so in high IV is ideal. But if you were to do it in a very low IV environment and you think IV might spike, sell them with longer-dated expirations.
The previous table shows that the price of a 30-delta Mar 19 SPX put went from $67.45 to $125.85 in one day.
While those numbers look small, an investor who had shorted that put would have lost $5840 in one day.
The loss was due to direction and volatility both moving against the investor.
Bull Put Credit Spreads
Because of this risk, many investors would prefer risk-defined spreads instead.
Here an investor sells the same put but buys another put for protection:
Date: Jan 26
Buy one SPX March 19 put with strike $3635 @ $57.20
Sell one SPX March 19 put with strike $3690 @ $67.45
Credit: $1025
Profit/Loss on Jan 27: –$600 (-13.41% of max loss)
One might argue that while this loss is much less, the credit received is also much less.
Then, sell more spreads.
Suppose an investor sold 7 spreads. The credit received would be $7175 (more than the single short put).
Yet the loss (at $4200) would still be less than that of one short put.
Further Out Credit Spreads
What if we sold the credit spread further out-of-the-money?
Say, at the 15-delta and keeping the width of the strikes the same.
Date: Jan 26
Buy one SPX March 19 put with strike $3410 @ $28.70
Sell one SPX March 19 put with strike $3465 @ $34.05
Credit: $535
Profit/Loss on Jan 27: –$415 (-8.36%)
The spread further out-of-the-money had a smaller loss — in terms of dollars and percentage. That means that the further out-of-the-money we go, the more conservative our position.
Going further OTM partially shields the option from negative price movement effects.
Bear Call Spread
However, the further OTM we put our spread, the less we will make if our direction is correct — as in the case of a bear call spread.
For a 30-delta bear call spread that is 55 points wide:
Date: Jan 26
Sell one SPX March 19 call with strike $4000 @ $37.80
Buy one SPX March 19 call with strike $4055 @ $23.00
Credit: $1480
Profit/Loss on Jan 27: $395 (9.8% of max loss)
For a 15-delta bear call spread of the same width:
Sell one SPX March 19 call with strike $4105 @ $14.15
Buy one SPX March 19 call with strike $4160 @ $8.10
Credit: $605
Profit/Loss on Jan 27: $195 (3.98%)
Iron Condors
Single long calls and puts are very directional. Spreads are directional too, but less so. Investors who do not want to take risks on the whims of market direction may choose to be non-directional and sell iron condors.
Here is a 15-delta iron condor that is 25 points wide with a risk to reward of 3.4:
Date: Jan 26
Buy one SPX March 19 put with strike $3440 @ $31.55
Sell one SPX March 19 put with strike $3465 @ $34.05
Sell one SPX March 19 call with strike $4105 @ $14.1
Buy one SPX March 19 call with strike $4130 @ $10.95
Credit: $570
Max Loss: $1930
Profit/Loss on Jan 27: –$90 (-4.66%)
Here is a 15-delta iron condor that is 55 points wide with a similar risk to reward of 3.8:
Date: Jan 26
Buy one SPX March 19 put with strike $3410 @ $28.70
Sell one SPX March 19 put with strike $3465 @ $34.05
Sell one SPX March 19 call with strike $4105 @ $14.15
Buy one SPX March 19 call with strike $4160 @ $8.10
Credit: $1140
Max Loss: $4360
Profit/Loss on Jan 27: –$220 (-5.05%)
The wider the width of the strikes, the greater the loss due to a spike in IV.
Even though the price is within the “safe” range of the iron condor, the increase in volatility has caused the entire T+0 line to shift down.
Jan 26:
Jan 27:
The Butterfly
The butterfly is a variation of the condor where the short strikes are the same. Here is a butterfly trade with a reward to risk ratio of about 3 to 1.
Date: Jan 26
Buy one SPX March 19 put with strike $3700 @ $69.55
Sell two SPX March 19 puts with strike $3850 @ $111.15
Buy one SPX March 19 put with strike $4000 @ $188.50
Debit: $3575
Profit/Loss on Jan 27: –$145 (-4.06%)
The butterfly is a short vega trade.
In this example, it had a vega of -151.
Like the iron condor, an increase in implied volatility will hurt even though the delta is relatively flat and the price is within the butterfly “tent”.
Going Long Volatility
Sellers of iron condors are sellers of volatility.
They want volatility to decrease.
They sell when IV is high and then buy it back when IV is low.
Now, let’s look at traders who are long volatility.
They are buyers of volatility and want volatility to increase.
These investors buy straddles, strangles, calendars, diagonals, and even straight calls and puts.
An investor may buy a diagonal anticipating an IV rise that often occurs before earnings.
An investor may buy a bearish calendar anticipating an equity that might drop and IV increases because of it.
An investor who is longer-term bearish on an underlying may buy a Poor Man’s Covered Put.
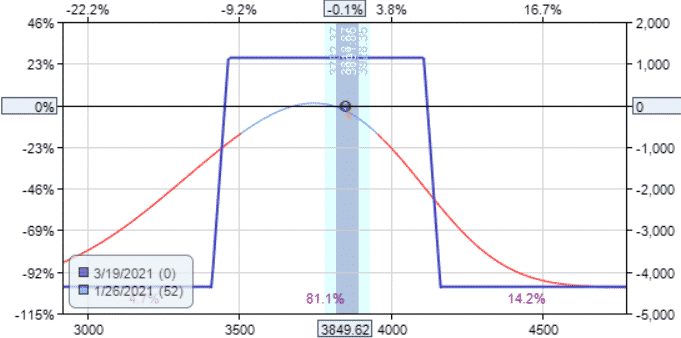
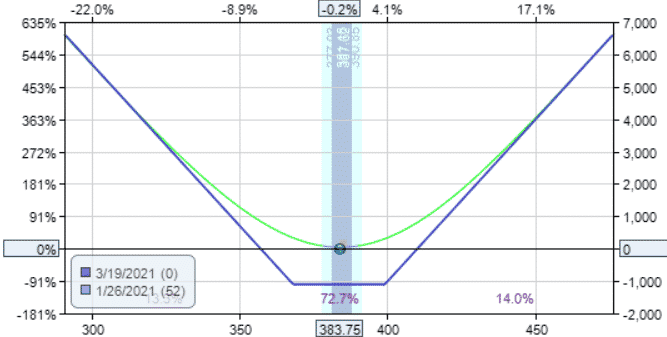
Straddle
A straddle consisting of one call and one put at-the-money is affected by volatility changes twice as much as just buying the put or the call by itself.
We use SPY for this one, because a straddle on SPX may be too expensive for some accounts.
Date: Jan 26
Buy one SPY March 19 put with strike of $384 @ $11.815
Buy one SPY March 19 call with strike of $384 @ $11.115
Total Debit: $2293
Max Margin: $2293
Delta: 2.83
Theta: -22.90
Vega: 115.46
On Jan 26:
On Jan 27:
Profit/Loss: $486.50 (21.2%)
Note how the entire T+0 line shifts up due to the increase in IV.
Owners of this straddle made a 21% gain on that day.
Sellers of this straddle would have lost 21% in one day due to the volatility spike.
Sell straddles only when you think there is going to be a volatility drop.
Don’t sell straddles in low IV environments, due to the potential of a volatility spike.
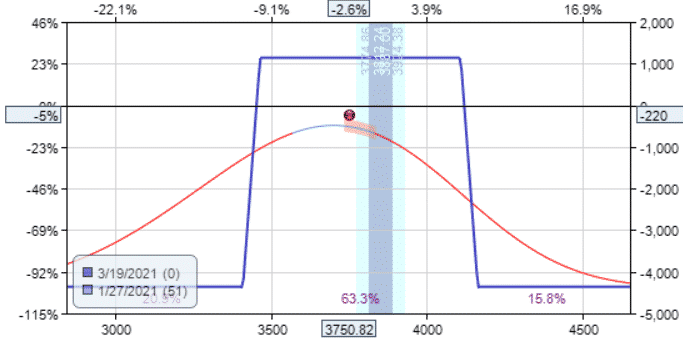
Strangles — Getting More Vega For Your Money
Strangles are variations on straddles with the call and put at different strikes.
Date: Jan 26
Buy one SPY March 19 put with strike of $368 @ $7.20
Buy one SPY March 19 call with strike of $399 @ $3.83
Total Debit: $1103
Max Margin: $1103
Delta: -0.37
Theta: -20.19
Vega: 100.66
On Jan 26:
On Jan 27:
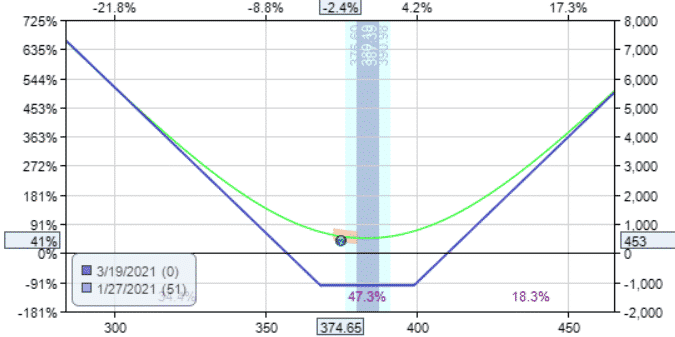
Profit/Loss: $453.00 (41%)
While both the straddle and strangle saw a rise in the T+0 line, the strangle costs less and saw a greater percentage return of 41%.
Yes, it is true that one straddle has a higher position vega than one strangle — 115 versus 100.
This is because ATM strikes have higher vega.
However, for the price of one straddle, we can buy about two strangles.
And if you do so, the strangle position vega becomes 200.
For the same price, we get more vega and hence more profits if a volatility spike occurs.
If you are buying these during low volatility, expecting volatility to increase, consider buying the strangle instead.
Calendars
Like buyers of straddles, buyers of calendars benefit when volatility increases.
Let’s buy 5 calendars (to make total debit similar to that of the strangle).
Date: Jan 26
Buy five SPY March 05 put with strike of $384 @ $9.395 (IV=18.87)
Sell five SPY Feb 19 put with strike of $384 @ $7.07 (IV=17.77)
Total Debit: $1162.50
Delta: 2.27
Theta: 12.58
Vega: 50.63
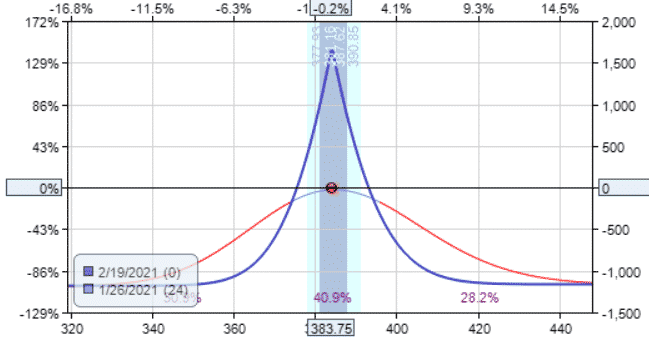
Date: Jan 27
Sell to close five SPY March 05 put with strike of $384 @ $16.455 (IV=23.32)
Buy to close five SPY Feb 19 put with strike of $384 @ $14.11 (IV=22.88)
Profit/Loss: $10.00 (0.86%)
There was an increase in IV, with the front month increasing more than the back month — a 5.11 increase versus a 4.45 increase.
However, the price moved away from the centre of the calendar.
The net effect was that the calendar made only a little money.
For the same amount of money, we get only half as much vega as we get with the strangle.
And we don’t see as dramatic a shift in the T+0 line.
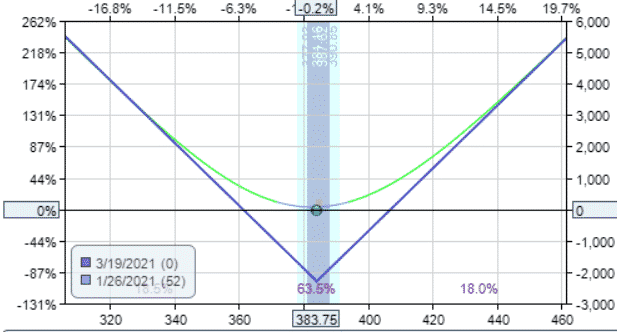
Call Diagonals
Consider an investor who has a Poor Man’s Covered Call on SPY:
Date: Jan 26
Price: $383.75
Buy one July 16 SPY call with strike $350 @ $46.09 (IV=25.47)
Sell one Mar 19 SPY call with strike $399 @ $3.83 (IV=16.2)
Date: Jan 27
Price: $374.65 Sell to close one July 16 SPY call with strike $350 @ $41.295 (IV=27.38)
Buy to close one Mar 19 SPY call with strike $399 @ $2.86 (IV=19.03) Profit/Loss: –$382.50 (-9.05%)
Direction went against the investor who lost 9% in one day.
The Poor Man’s Covered Call is a stock replacement strategy. It behaves almost like stock.
Hence, they are quite directional with a significant delta — in this case, a delta of 43.
Also, note that the IV of the front month went up more than the IV of the back month.
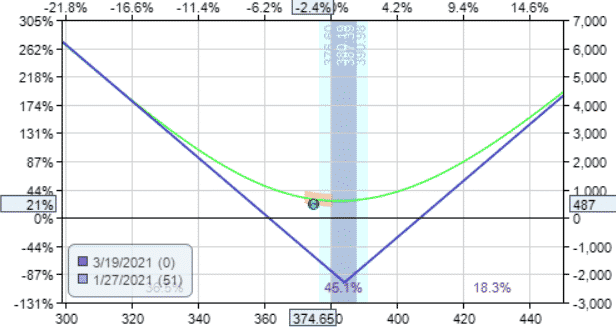
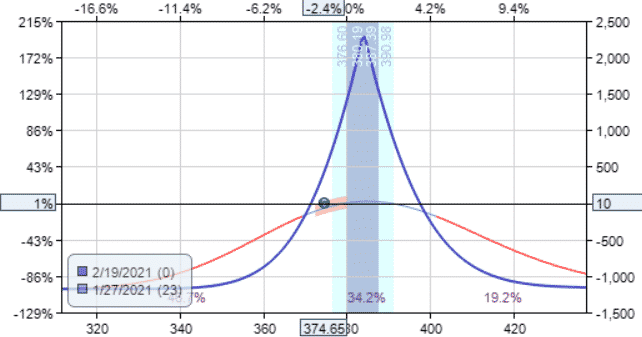
Put Diagonals
The Poor Man’s Covered Put should do better since direction and volatility are in our favor.
Date: Jan 26
Price: $383.75 Sell one Mar 19 SPY put with strike $368 @ $7.20 (IV=24.23)
Buy one July 16 SPY put with strike $420 @ $43.13 (IV=18.7)
Date: Jan 27
Price: $374.65 Buy to close one Mar 19 SPY put with strike $368 @ $12.70 (IV=28.67)
Sell to close one July 16 SPY put with strike $420 @ $52.70 (IV=22.12)
Profit/Loss: $407.00 (11.33%)
This strategy does well in a market sell-off because the price goes down while IV goes up — both delta and vega go in our favor.
The value of the long-dated long put when from $43.13 to $52.70 in one day, due to the IV spike.
Again, the IV of the front month options went up more than the IV of the back month.
This is typically true of volatility spikes in diagonals and calendars.
Conclusion
While delta is still the prevailing Greek to watch out for, investors should also keep their eyes on vega.
Remember that selling premium (such as iron condors and credit spreads) are short vega — which means that we don’t like it when volatility spikes.
Option sellers who want to decrease their vega risks can make their trades more conservative by using options with longer expirations. Options further out in time are less sensitive to volatility spikes.
Trade safe!
Disclaimer: The information above is for educational purposes only and should not be treated as investment advice. The strategy presented would not be suitable for investors who are not familiar with exchange traded options. Any readers interested in this strategy should do their own research and seek advice from a licensed financial adviser.


