
The Know Sure Thing indicator is often abbreviated KST for short. I see it as a pun on words.
Does this indicator mean “to know” a “sure thing”?
Or does it mean there is “no sure thing” in the market?
Contents
- Sell Signal Cross Overs
- Centerline Crossover
- Centerline Crossover
- Buy Signal Crossovers
- Lag and false signals
- Conclusion
In any case, it is a momentum oscillator invented by Martin Pring.
It is a weighted average of four different Rate of Change indicators.
In its typical settings, the four Rate of Change (ROC) indicators used are…
ROC#1 = 10-period simple moving average of the 10-period
ROC ROC#2 = 10-period simple moving average of the 15-period
ROC ROC#3 = 10-period simple moving average of the 20-period
ROC ROC#4 = 15-period simple moving average of the 30-period ROC
The KST gives the longer period ROC more weight by this formula:
KST = (ROC#1) + (ROC#2 x 2) + (ROC#3 x 3) + (ROC#4 x 4)
See how ROC#4 is multiplied by a factor of 4, whereas ROC#3 is multiplied by a factor of 3, etc.
This KST value is plotted as the black line in StockCharts

The red signal line is the 9-period simple moving average (SMA) of the KST line.
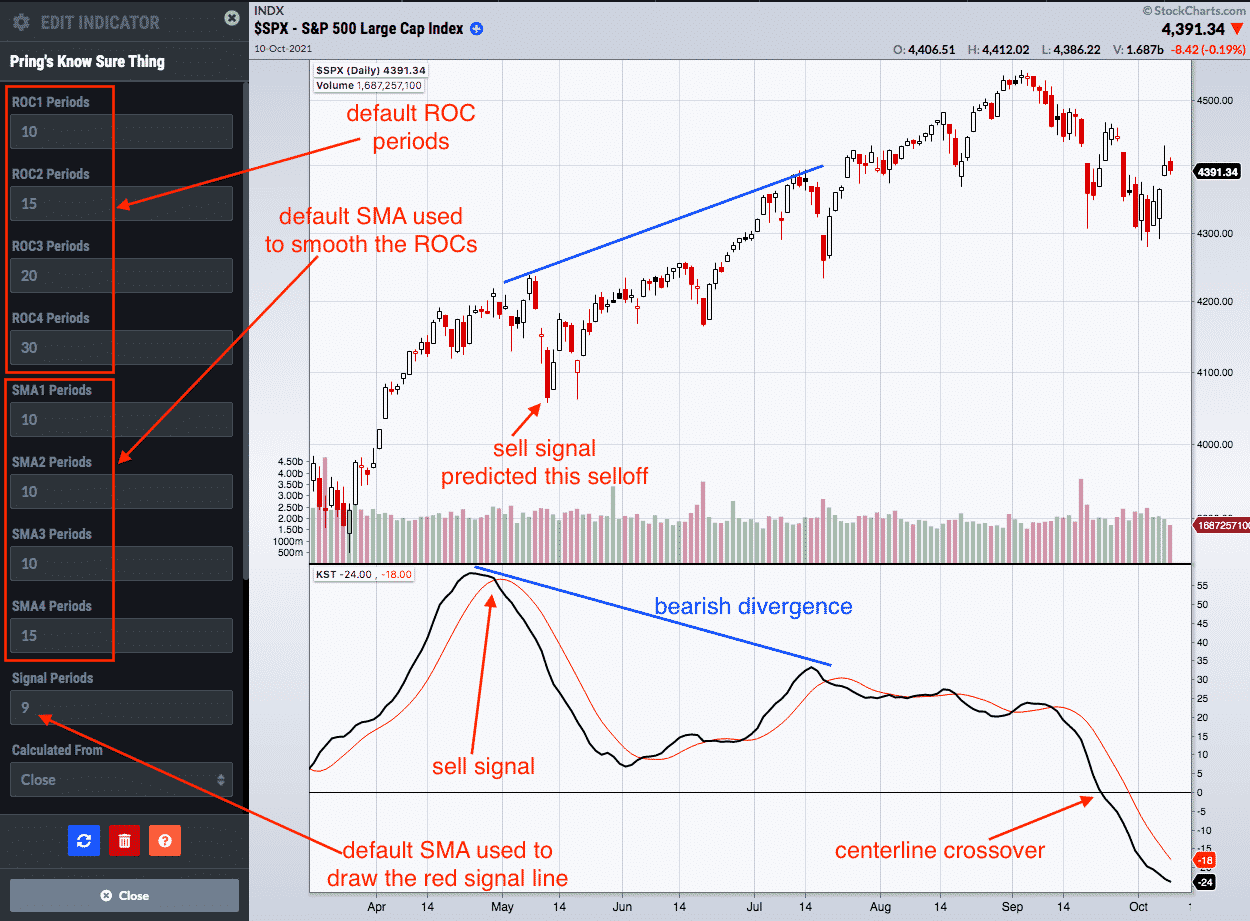
All of the indicator’s default parameters, from the periods of the ROCs to the periods of the simple moving averages used to smooth the ROCs, can be changed in StockCharts.
I don’t recommend changing the settings.
The defaults are quite standard.
The exact same settings are found in TradingView.
Sell Signal Cross Overs
In the above chart of the S&P 500 index (SPX), we see that in April 2021, the price chart and the KST line are going up in agreement with each other of the bullish trend.
On April 30, the KST gave a sell signal when the KST black line crossed below the red signal line.
And a week or so later, on May 11, there was a selloff.
Sell signals are only valid when it occurs when KST is above zero, and are more meaningful when the cross is way up in the overbought areas.
When the black line crosses the red line, that indicates some reversal.
Divergences
Like other oscillators, KST can also be used to spot divergences.
In the above chart, the price is going up with higher highs from May to July.
However, the KST line is not making higher highs.
It is making a lower high.
This is a divergence.
The KST is not confirming the price.
In fact, it suggests that the upward movement of price is waning.
Centerline Crossover
On September 22, the KST line went from positive to negative, indicating that the SPX chart had gone from bullish to bearish.
See above chart.
Buy Signal Crossovers
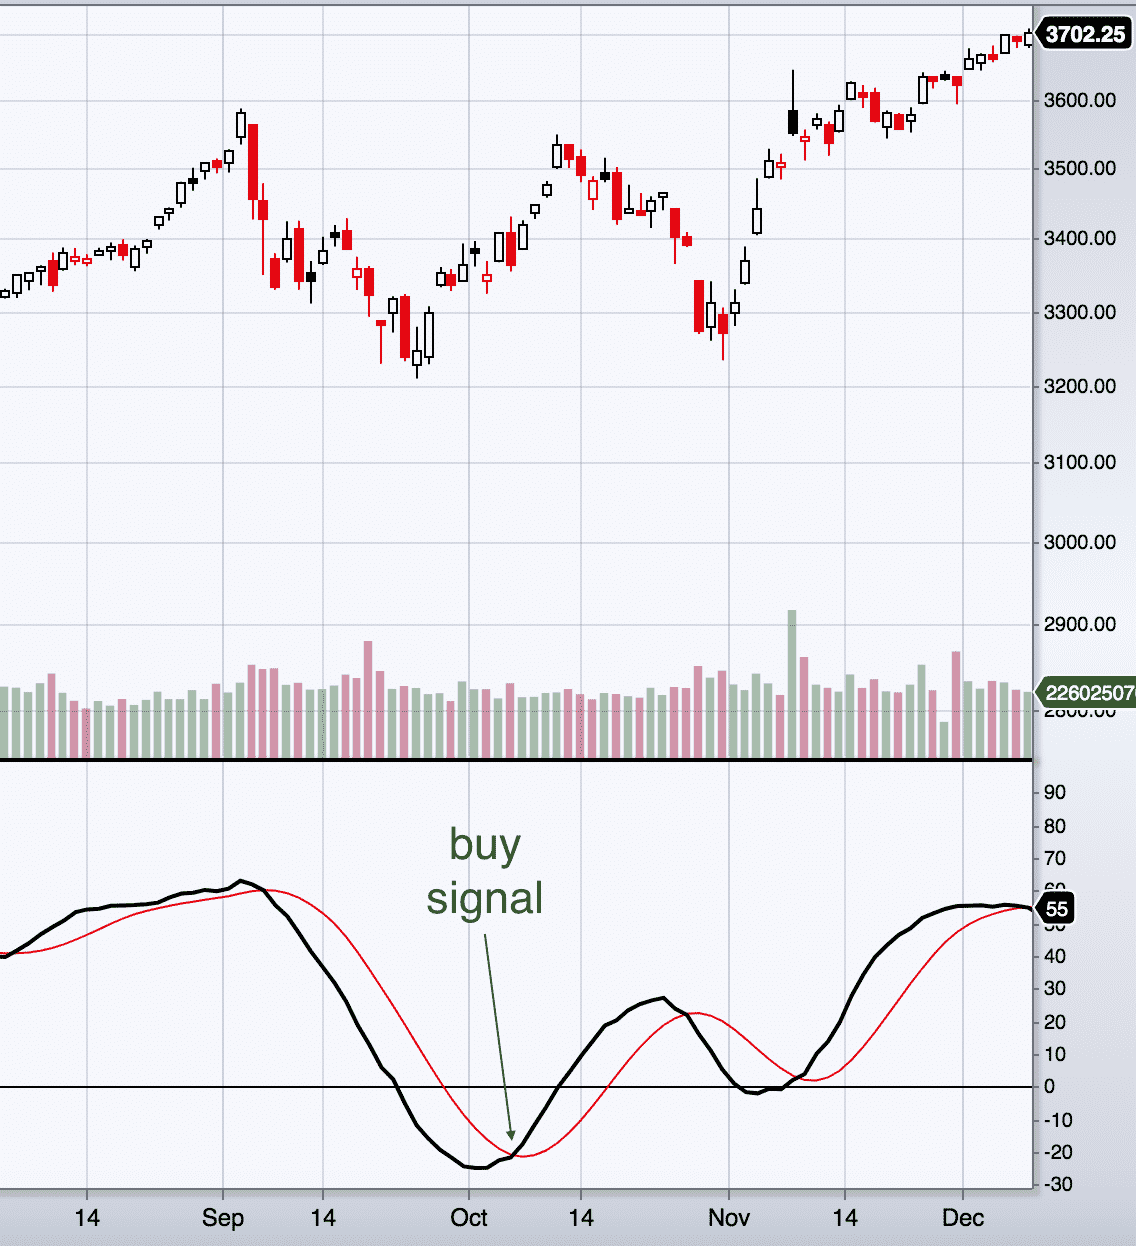
A buy signal will be when the KST crosses above the signal line from below.
It is only valid when the KST is below zero — and more meaningful the further below zero it is.
Here is an example:

It is showing a buy coming out of oversold condition.
Lag And False Signals
You may notice that sometimes the signals are lagging.
This lagging is common with many indicators because their calculations are based on the stock price.
Depending on the formula, there has to be enough price data already printed before it can make its calculation.
The KST indicator is two levels removed from price because it is based on the Rate of Change calculation based on the stock price.
Just like many other indicators, it is normal for the KST to give false signals.
Conclusion
The KST indicator does not appear to be a very popular indicator and is not one that I use myself.
I would rather use the RSI personally for watching oversold/overbought as well as for divergences.
But you got to love its name.
Unfortunately, I was not able to find details on how this name came about.
There was only a vague reference to Pring’s paper titled Summed Rate of Change (KST), where he had “KST” in parenthesis in the title.
Trade safe!
Disclaimer: The information above is for educational purposes only and should not be treated as investment advice. The strategy presented would not be suitable for investors who are not familiar with exchange traded options. Any readers interested in this strategy should do their own research and seek advice from a licensed financial adviser.


