


Today, we will look at the Hull Moving Average, one of the most famous moving averages.
We will discuss it, talk about the potential benefits, and help traders improve their technical analysis.
Contents
- Introduction
- Can You Reduce Lag In SMAs And EMAs?
- How Does Hull Moving Average Or HMA Work?
- How To Use HMA To Trade The Trend?
- Conclusion
Introduction
One of the challenges traders face is to mix and match technical indicators in their charts.
There are many technical indicators out there.
You probably already tried some oscillators and combinations of different moving averages.
Just in the moving average family, you have a lot of options like the Simple Moving Average (SMA), Exponential Moving Average (EMA), Smoothed Moving Average (SMMA), and Weighted Moving Average (WMA).
These technical indicators tend to do a reasonable job, but there is another moving average indicator that has gained popularity.
This is the Hull Moving Average or (HMA).
If you have experienced missed opportunities from the lags between a trade signal and the moving average crossovers, then this article is for you.
Can You Reduce Lag In SMAs And EMAs?
Almost all moving averages lag in price because their calculations are based on the previous price data.
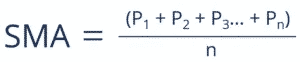
For say example, the Simple Moving Average equally weights each price data on its number of periods,
The problem with most moving averages is that they do not factor in the recent price changes from significant company developments, earnings surprises, or product releases.
The longer the number of periods used in calculating a moving average, the more it will lag.
As you can see on the chart below, the price moves up, but the SMA lags due to prior data.
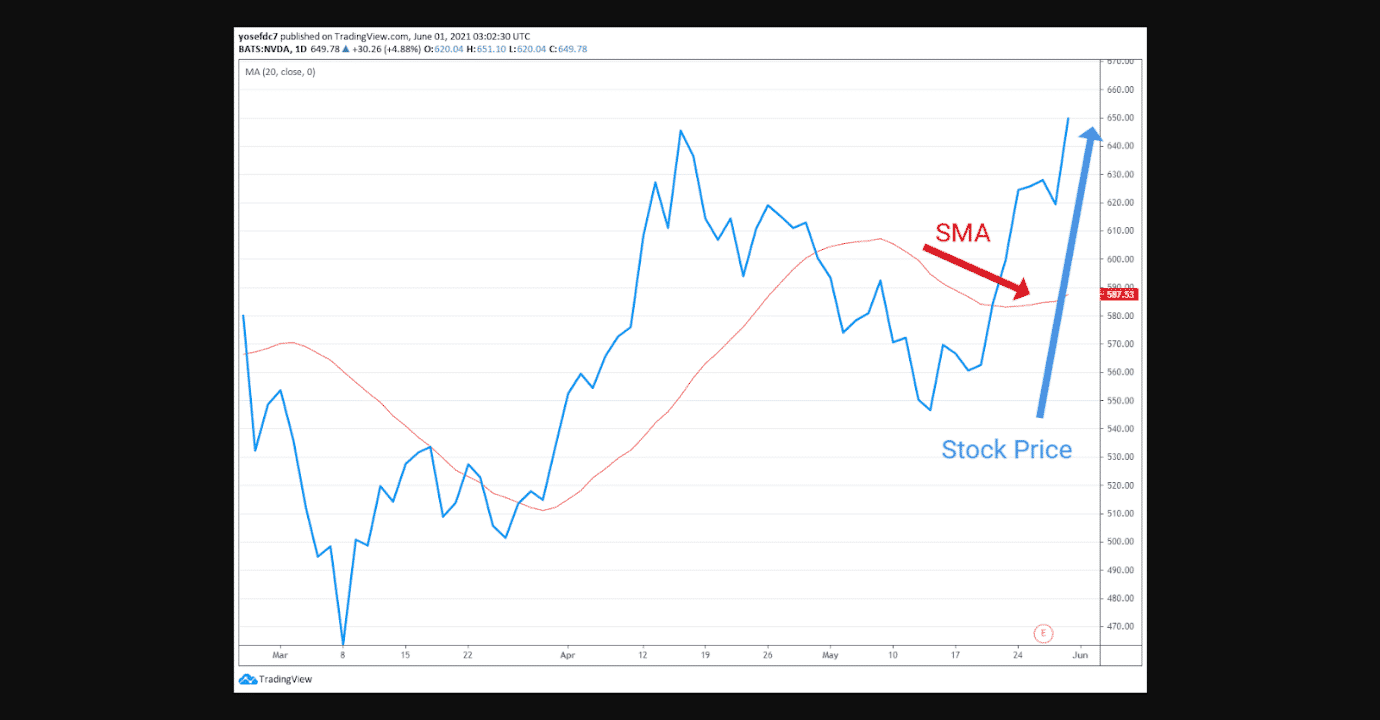
Traders compensate for the lagging moving average by combining a fast-moving average and a slow-moving average to gauge trends.
Alan Hull, one of Australia’s leading stock market experts, solved the problem of making a moving average more responsive to current price activity while keeping the curve smooth.
You can visit Alan’s website here at https://alanhull.com/about-alan.
He is a knowledgeable guy and has been in the industry for years.
The Hull Moving Average is not the same as the traditional technical indicators such as the Exponential Moving Average (EMA) and the Simple Moving Average (SMA) because it involves the weighted moving average (WMA) in its calculation.
This means that it gives a higher weight to recent price data and a lower weight to previous price data.
Thus, it makes recent company developments weigh more.
How Does Hull Moving Average Or HMA Work?
The Hull Moving Average makes a moving average that is more reactive while maintaining the smoothness of its curve.
Alan claims that his moving average:

“Almost eliminates lag and manages to improve smoothing at the same time.”
Alan’s logic behind HMA is that weighted moving averages reduce lag by giving more weight to more recent prices.
Then, by offsetting another WMA covering only the most recent half of the specified timeframe, lag is reduced even further.
This puts even more emphasis on recent prices.
Lastly, it uses another WMA for final smoothing weighting towards the most recent data, with the square root of the number of periods in the specified timeframe.
As a result, the moving average line remains remarkably close to the price bars themselves.
Alan Hull suggests using his moving average for directional signals rather than crossovers. If the HMA rises in tandem with the price, it indicates an uptrend.
On the other hand, if the HMA falls along with the price, that shows a downtrend.
In addition, if prices are rising and the HMA is trending upwards, traders can enter a long position.
However, if the current trend is downward, traders can enter a short position.
Calculation
Alan uses three Weighted Moving Averages (WMA) in his formula: Integer (Square Root (Period)) WMA [2 x Integer (Period/2) WMA(Price) – Period WMA(Price)]
- Calculate the WMA for the Period and then divide the Period by 2.
- Use the Integer value to calculate a second WMA. Multiply the second WMA by 2, then subtract the first WMA.
- Calculate the Square Root of the Period and take the Integer value.
- Then lastly, use the resulting Integer value to calculate a third WMA of the result from the first two WMAs.
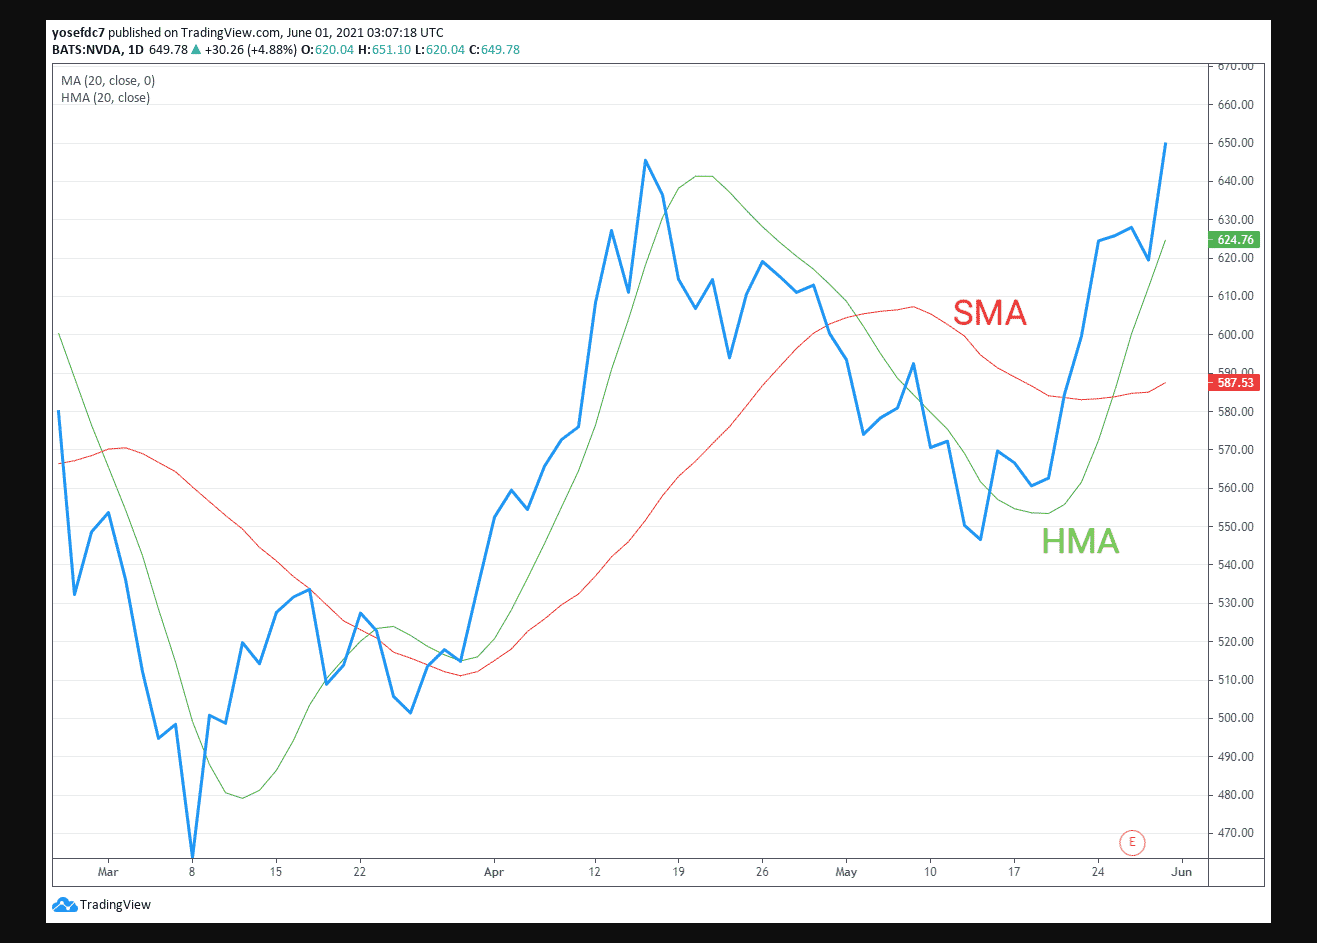
As you can see on the chart below, the HMA is more reactive versus SMA, with both moving average periods set to 20.
How To Use HMA To Trade The Trend?
Using this technical indicator in trend following is an excellent way to start trading the HMA.
This strategy involves determining the appropriate time frame of the indicator and looking for a stock whose price is rising or falling.
When a rising stock price is expected, your goal is to ensure that the HMA is below the price.
Once the price crosses down to the HMA, then that is the time you close the position.
An excellent example of this is in the chart below.
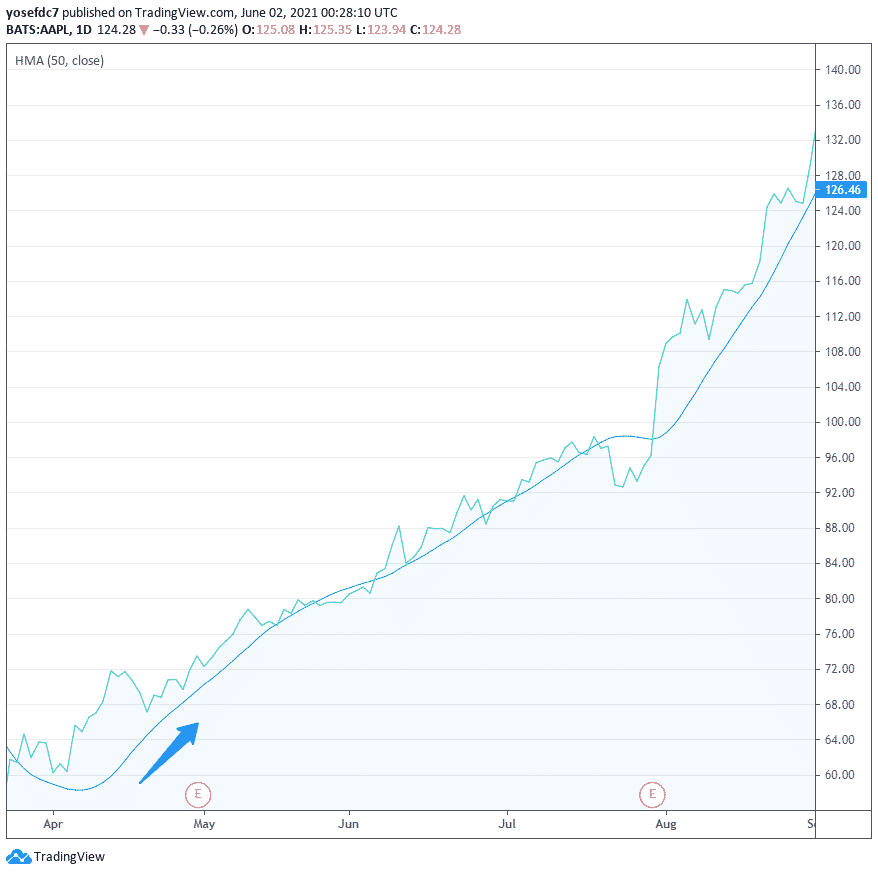
It is evident that when the HMA is below the price, the price continues to rise.
As with most technical indicators, the appropriate settings should be in place for it to be effective.
In the case of HMAs and other MAs, the correct period should be chosen.
The HMA comes with a 9-day period by default in Tradingview.
You can, however, easily modify this to suit your trading needs and strategy.
To get the correct period, traders should try a paper trading account to see what works best.
When trading, some recommended periods are the 9, 20, and 50.
Conclusion
The Hull Moving Average is excellent at reducing lag and smoothing out price data.
Although it is not intended for crossovers, there are other trading strategies available, such as trends, pullbacks, and average breakups that can be used.
The list of technical indicators you can incorporate into your trading strategy is long.
The more you include, the greater the risk of analysis paralysis and messy ideas.
Make sure to select only the best indicators for your trading strategy.
Most traders recommend not going over five indicators in a chart.
Have you already used the Hull Moving average in your trading?
If so, has It been helpful or not? I Would love to hear your comments below.
Trade safe!
Disclaimer: The information above is for educational purposes only and should not be treated as investment advice. The strategy presented would not be suitable for investors who are not familiar with exchange traded options. Any readers interested in this strategy should do their own research and seek advice from a licensed financial adviser.


