


Traders often believe that it is better to be alongside the trend and use the Trend Following System to spot the trading opportunities.
So, let’s proceed to see what is a Trend Following System.
Contents
- What is a Trend Following System
- Principles to be followed for Trend Following System
- Trend Following System Strategies
- Trading Using the Trend Following System
- Conclusion
What is a Trend Following System
Trend Following System is a trading methodology that traders use to capture the price trends.
Trend following traders believes in riding along with the trend and avoid predicting or forecasting the price movements.
Thus, they use different risk management strategies to follow the trend and profit from it.
In an uptrend, the price keeps making higher highs and higher lows.
Similarly, in a downtrend, the price keeps making lower highs and lower lows.
Principles to be followed for Trend Following System
The Trend Following System demands certain principles to be followed:-
- Buy the securities at a high price and sell them at an even higher price. It is often believed that no price is too high in the market to buy or too low to sell.
- Ride along with the trend and follow the price. Avoid making forecasts regarding price movements.
- Implement proper risk management strategy and risk only a fraction of the capital to avoid massive losses when the price reverses.
- Don’t set a profit target and ride along with the trend. But, it doesn’t mean that you do not set stop-loss exit using the trailing stop loss rule.
- Trade across different sets of markets to increase the odds of winning. Markets remain range-bound most of the time as compared to trending. Hence, trading across different markets provides ample trading opportunities.
Trend Following System Strategies
Traders use different trend-following strategies, from moving averages to trendlines and chart patterns.
Often, such strategies are used in combination to look for a trend trading opportunity. Let’s see some of such strategies.
Moving Averages
Traders often use moving averages for going long or short on stock.
For example, the crossover of a short-term moving average above a longer-term moving average is often used to create a long position.
Similarly, a short position is created when the short-term moving average crosses below the longer-term moving average.
Moving Averages work well in the trendy market, but the whipsaws price movements tend to fail the objective of the moving average.
Thus, the moving averages are combined with other technical tools to filter out the best trading opportunity.
Momentum Indicators
The traders use momentum indicators to gauge the strength of the trend.
Momentum indicators like RSI, MACD, ADX, etc., help the traders to look for the trend trading opportunity.
For example, the traders create a long position when the MACD line crosses the signal line from below.
Similarly, RSI above 70 or 80 is used by the traders to exit from the long position.
Such indicators are combined with other factors as their use in isolation does not serve the purpose and leads to conflicting signals.
Trendlines and Chart Patterns
Trendlines represent the overall trend.
The swing lows are joined to represent an uptrend. Similarly, swing highs are joined to represent the downtrend.
Often, the price pulls back to its trendline, and the traders use such an opportunity for going long or short on stock.
Traders use different chart patterns such as ascending triangles, descending triangles, flags, rising wedge, falling wedge, etc., to capture the trend momentum.
The price breakout from a particular pattern indicates the emergence or continuation of a trend.
Trading using the Trend Following System
The chart below is of Facebook, INC. (FB) on a daily timeframe.
The stock was in a downtrend from February’2020 till March 18th’2020, as evident by the descending trendline.
The price has continuously fallen after it breaches the 50-day moving average support.
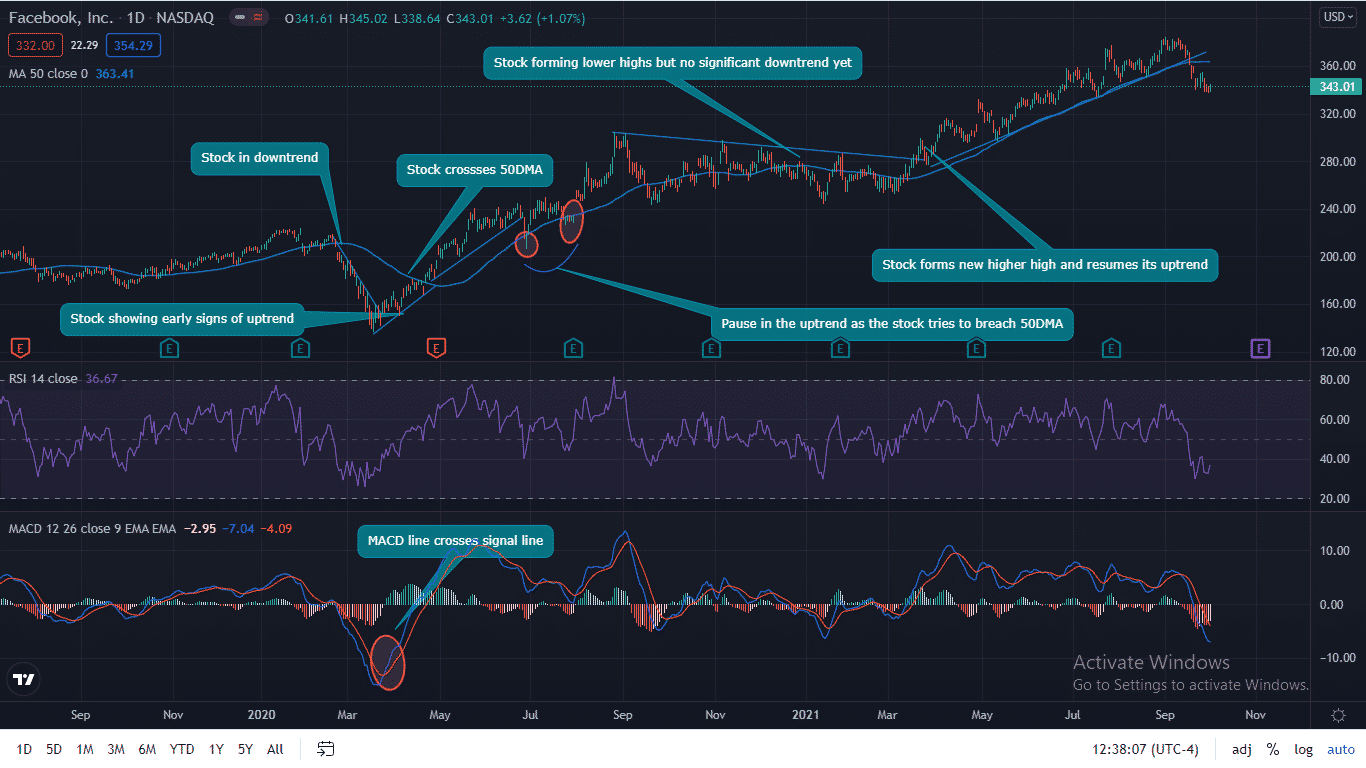
The stock then attempts to recover as it has been trying to find support near the ascending trendline.
The stock finally managed to close above the 50-day moving average on April 22nd’2020 and continues to rise.
However, a pause in the uptrend can be seen during June and July’2020 as the stock tries to breach the 50 DMA support.
The stock continues trading sideways by forming lower highs, but no significant lower lows can be seen from August’2020 to March’2021.
The stock finally crosses its descending trendline by forming a higher high on March 22nd’2021 and resumes its uptrend.
As a result, you can see how trendlines, moving averages, and other indicators can be used in the trend following system to capture the trend momentum in the stock.
Conclusion
The Trend Following System provides a great trading opportunity for traders who wish to trade along with the trend and often results in handsome profits.
However, the traders should follow proper risk management and exit strategy to minimize their losses in adverse situations.
Trade safe!
Disclaimer: The information above is for educational purposes only and should not be treated as investment advice. The strategy presented would not be suitable for investors who are not familiar with exchange traded options. Any readers interested in this strategy should do their own research and seek advice from a licensed financial adviser.


