


Today, we are taking a deep dive into the broken wing butterfly strategy.
Don’t worry. No real butterflies were harmed in these experiments.
Contents
- Introduction
- Broken-Wing Butterfly Experiment 1 Results
- Broken-Wing Butterfly Experiment 2
- Bearish BWB Configuration
- Summary
Introduction
In the first experiment, we tested the performance of directional broken-wing butterflies.
In the second experiment, we tested to see if we could use broken-wing butterflies profitably in a non-directional fashion.
We had the computer pick some random dates from the year 2021.
We threw out the dates where the option contract spans an underlying earnings announcement.
Just like we don’t like to trade iron condors through earnings, the same is true for BBWs.
Then we told the computer to randomly pick either a bullish or bearish bias for the direction of the butterfly, assuming that we have as good of a direction picking skill of a coin toss.
The broken-wing butterfly (BWB) structure is an excellent strategy to consider whenever an investor has thoughts like:
“I think the market is going up, but I could be wrong.”
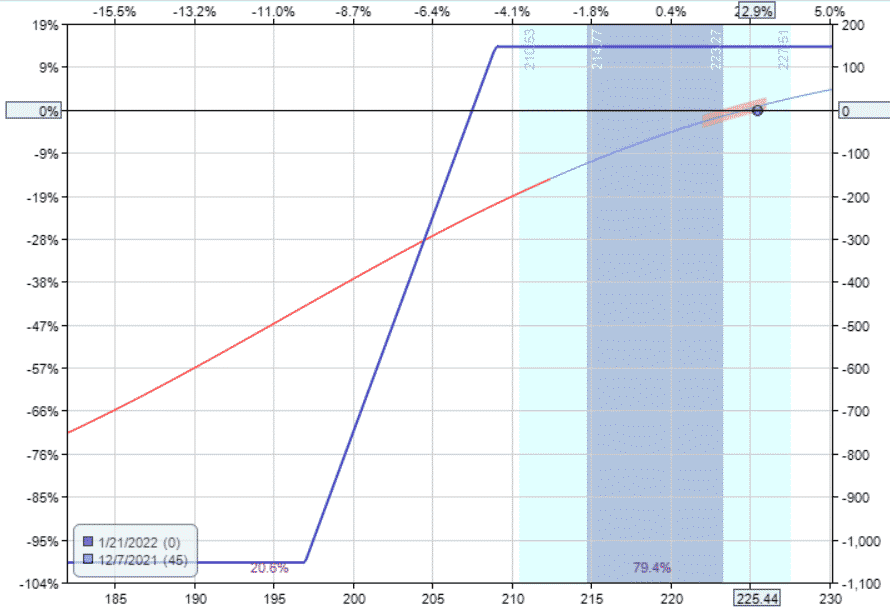
If the investor thinks the Russell 2000 ETF (IWM) is going up, they might start with a bull put credit spread with the short strike near the 20-delta like this:
Date: Dec 7, 2021
Price: IWM @ 221.98
Buy one Jan 21 IWM $197 put
Sell one Jan 21 IWM $209 put
Credit: $146.50
Max risk: $1053
Delta: 9.56
Theta: 1.45
Vega: -7.12
Gamma: -0.51
Delta/Theta: 6.6
source: OptionNet Explorer
But if they think they might be wrong, they can buy a bear put debit spread hedge for a debit of $53.50.
Bear Put Debit Spread:
Sell another January 21 IWM $209 put
Buy on January 21 IWM $212 pu
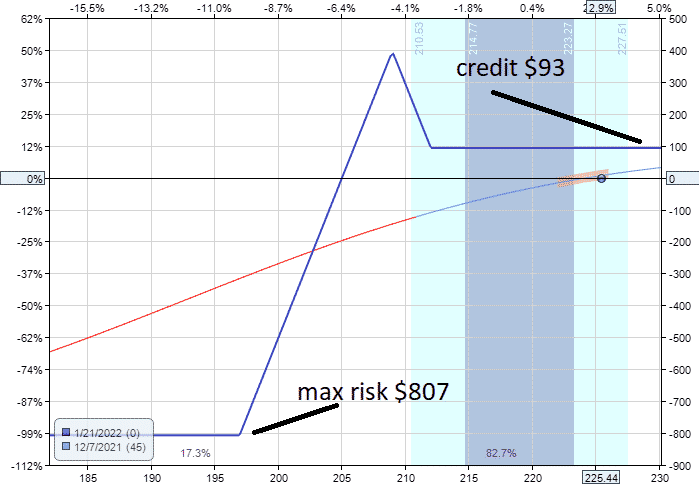
The final result is the type of broken-wing butterflies that we will test in the first experiment, which looks like this:
Date: Dec 7, 2021
Price: IWM @ 221.98
Buy one January 21 IWM $197 put
Sell two January 21 IWM $209 put
Buy on January 21 IWM $212 put
Credit: $93
Max Risk: $807
Delta: 6.09
Theta: 1.13
Vega: -5.18
Gamma: -0.4
Delta/Theta: 5.4
source: OptionNet Explorer
The addition of the debit spread has reduced the max risk in the position.
As noted by its lower delta, the resulting broken-wing-butterfly is less directional than the credit spread.
While it has less theta than the credit spread, its lower delta-to-theta ratio indicates that the decrease in delta is greater than its decrease in theta.
The $93 credit received will create the butterfly wing on the right.
The profit and loss (P&L) will be $93 if the price of IWM is above $212 at expiration.
The max loss of $807 is seen from the graph of the left-wing.
This max loss will occur if the price of IWM is below $197 at expiration.
This setup is the bullish configuration of the BWB because there is no risk when the price moves up.
For the bullish configuration, we use puts because these are the options that will be out-of-the-money.
For the bearish configuration, we use calls.
We like to work with out-of-the-money options because they are easier to fill with narrower bid/ask spreads, and there is less probability of options assignment near or at expiration.
We want the credit to be at least 10% or greater than the max capital at risk for this experiment. In this case, it is $93/$807 = 11.5%.
Broken-Wing Butterfly Experiment 1 Results
Scrolling through the results of experiment 1 below, we see that there were five rows where we did not perform a trade because we could not find the right strikes that gave us this 10% credit to risk ratio.
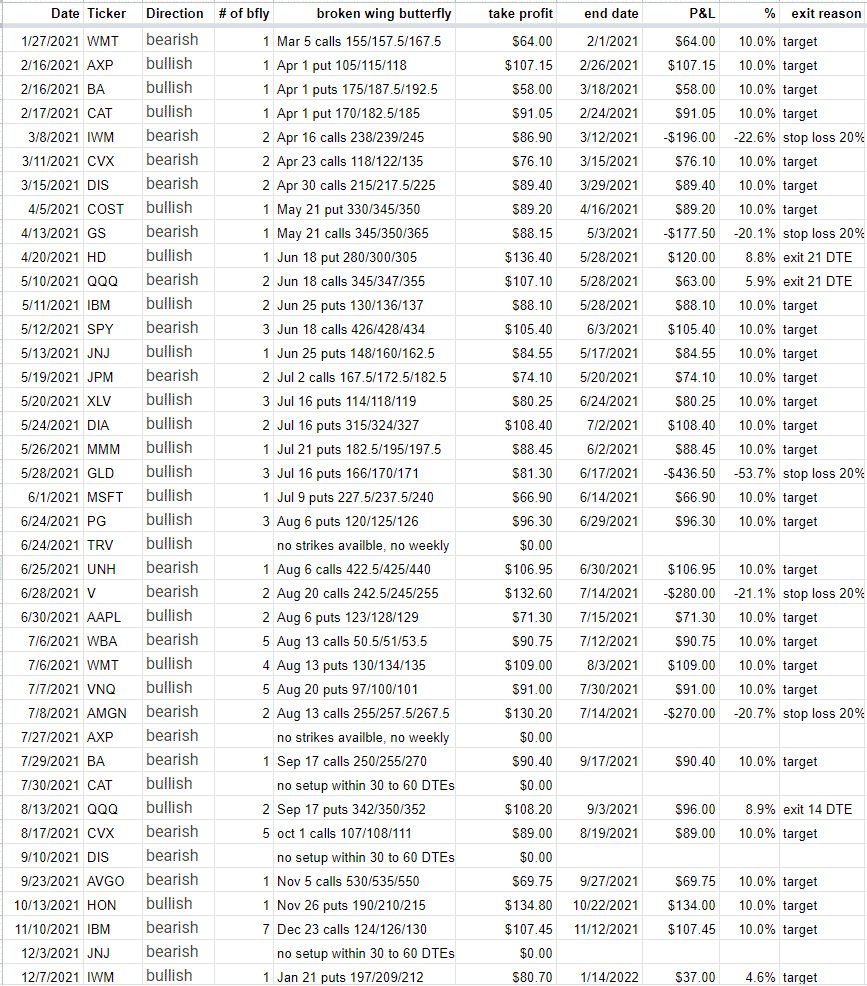
TRV and AXP did not have weekly expirations, so limited strikes were available.
BA, DIS, and JNJ do have weekly expirations.
But still no setup for the expiration cycles that are 30 to 60 days till expiration.
Our example IWM trade is the last row listed in the table.
We are trading one butterfly with the January 21, 2022 expiration.
The two middle short strikes are at $209.
And we have on long put option at the $197 strike.
And another put option at the $212 strike.
Using OptionNet Explorer, we look at the historical option prices 2 hours after the market opens for each trading day.
If, at this time check, we see that our profit and loss (P&L) is at a greater than 20% loss, we will manually exit the trade.
This is our soft mental stop-loss.
And hence, the actual loss recorded can be greater than 20%.
Five out of the 35 trades (14%) exited due to this stopping rule.
For the take profit, we want a 10% return on our max risk.
This experiment model assumes that a trader will place a conditional order to take profit at this profit level.
This is a wise idea because the P&L of butterflies can fluctuate quite a bit due to price changes, volatility changes, and even skew changes among the different strikes.
A conditional order can lock in profits if these random changes happen to come into our favor while we are not watching.
As this is an automatic limit order, its P&L should be close to the target level of 10% or even slightly better.
26 out of the 35 trades (74%) reached the profit target without adjustments.
The remaining four trades were exited at the trader’s discretion when the trade was getting close to expiration without reaching either the stop loss or profit target.
For our example IWM trade, the position was exited with seven days till expiration with a profit of $37, or a 4.6% return.
That may not sound like a lot.
But that is only for one butterfly with a trade duration of 38 days.
Scale that up to your appropriate number of butterflies and annualize that return, and you will see that this is a respectable number for not needing to pick the direction of the stock correctly.
This IWM trade ran longer than average.
The average number of days in a trade is 16 days.
The average percent return on each trade is 4.3% of the capital at risk.
Altogether, the win rate is 30 out of 35, or 86% for experiment #1.
Broken-Wing Butterfly Experiment 2
Since we are essentially picking direction with a flip of a coin, can we make the broken-wing butterfly less directional? Yes, we can.
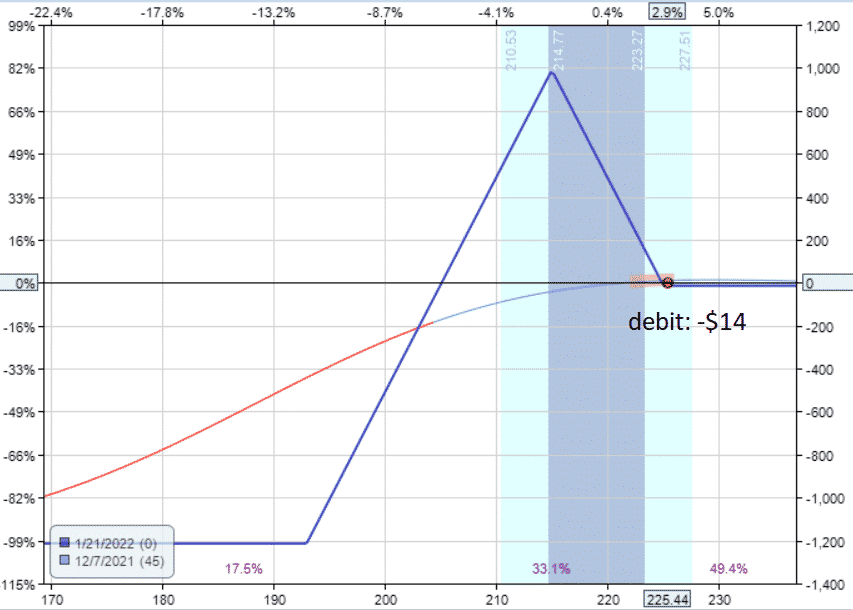
Taking the same IWM underlying on the same date, we will configure it like this:
Date: Dec 7, 2021
Price: IWM @ 221.98
Buy one January 21 IWM $193 put
Sell two January 21 IWM $215 put
Buy on January 21 IWM $225put
Debit: –$14
Max Risk: $1214
Delta: 1.59
Theta: 2.47
Vega: -8.77
Gamma: -0.79
Delta/Theta: 0.64
This particular selection of strikes has decreased the delta down to 1.59 without sacrificing any loss in theta.
In fact, this configuration has a much better theta at 2.47, resulting in a good low delta/theta ratio of 0.64.
From a non-directional trader point of view, that is a decent delta/theta ratio when you have more theta than delta.
We can only achieve this by bringing the right-wing near the zero P&L line of the payoff diagram.
source: OptionNet Explorer
In this case, the right-wing is slightly below the P&L zero horizontal because we paid a debit of $14.
We will try to go for a small credit whenever possible.
But if we must take a debit, we must not let the debit be greater than 5% of the max capital at risk.
In this case, our debit is only $14/$1214 = 1.1%.
Looking at the graph, the peak of the butterfly tent is at $1000, representing the theoretical max potential reward.
We only want setups where the risk to reward ratio is two or less.
The risk to reward ratio of this particular butterfly is 1.2 = $1214/$1000.
Similar to experiment 1, we are looking at expiration cycles 30 to 60 days away, and we are setting a conditional order to take profit at 10%.
Trying out a different risk mitigation strategy, we will not have a particular percentage or dollar stop limited in this second experiment.
Instead, we will use the butterfly’s left-wing to limit our risk.
In a bullish configuration such as shown in this example, the main role of the left-wing is to limit risk and reduce margin requirements.
We will adjust if we see that the price has gone below our short middle strikes at our daily checkpoint.
In our example, the short strikes were hit on December 14 when the price of IWM dropped below the middle strike of $215.
If the P&L is positive when that happens, we would just exit the trade.
However, here in our IWM trade, the P&L is –$19. While this is small enough of a loss to just exit, we will follow the rules of experiment #2, which is to roll the lower put option up to reduce the risk in the trade and hope the price bounce back in our favor.
So on December 14, we rolled the $193 put up to the $200 strike.
Date: December 14
Price: IWM at $214.75
Sell to close one January 21 IWM $193 put
Buy to open one January 21 IWM $200 put
Debit: $109.5
This is the resulting payoff diagram:

See that our max risk on the downside has been reduced to $624. As a side-effect, this increases the risk on the upside to $123.
A butterfly can shift its risk from one wing to another, reacting to the market’s movements.
We had rolled only “halfway up.”
As a trader’s choice, one can roll the put option even higher until the risk on the left and right sides are balanced, forming a symmetrical butterfly.
But in this case, we don’t think it is necessary.
Since once we adjust, we reset our conditional order to exit the trade as soon as we get back to breakeven.
In this case, two days later, on December 16, we exited the trade at breakeven.
This trade is listed as the last row in the experiment #2 results below.
Bearish BWB Configuration
Now let’s look at how to configure a bearish trade.
For example, let’s take a different IWM trade that was initiated on March 8 (see above table).
This butterfly is a bearish version using calls, and its starting position looks like this:
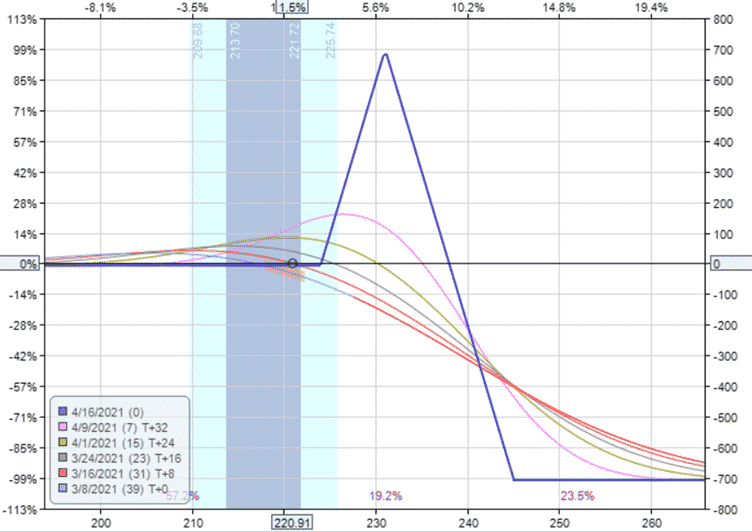
Note the T+0 line shows positive P&L as the price goes down.
Even though the expiration line is at the P&L zero horizontal, there are still profits to be had in that area if we exit prior to expiration.
The T-lines are above zero.
On March 11, the price went above the short strikes of $231, and we had to roll the $245 call down to $240 to reduce the risk on the upside.
After adjusting, we expect the price to swing back in our favor.
But sometimes, that doesn’t happen, and it is up to the trader to decide when to exit with a loss.
In this trade, we decided (right or wrong, who knows?) to exit the trade on March 26 with a loss of –$48.50.
Apparently, we felt that the loss has shrunk small enough to exit at that time.
In examples showed the case of using one butterfly contract.
There are some underlying with lower price where we used more contracts to keep all the trade sizes somewhat similar.
If a trade consists of multiple contracts and the short strike was hit, we would close all the butterflies except for one.
And then perform the roll adjustment on that one butterfly.
In the December 3 Johnson and Johnson (JNJ) trade, we closed one butterfly; on December 10 and then rolled the $175 call to the $170 strike.
In the June 28 Visa (V) trade, we closed one butterfly on July 13.
But we didn’t perform the roll of the $250 call to the $245 call until the next day, when the price continued to move against us.
Our biggest loss in this experiment was the May 28 GLD trade when we lost –$536 (or -55%) despite adjusting on June 17, where we closed one butterfly and rolled the $165 put to the $169 strike on the remaining one butterfly.
Looking back at the chart that day, the gold ETF made a large gap down for whatever reason
The gap is in the direction opposite of our butterfly’s preferred direction.
Stocks can make such gaps on earnings announcements, and that is why we don’t trade these across earnings.
We only saw 7 out of 40 trades (17.5%) where the price breached the short strikes during our daily checkpoint time.
Two of those trades — the April 13 Goldman Sachs (GS) trade and the May 26 MMM trade — were in the green when that happened. So we just exited those trades and took whatever profits we had.
The short strikes on these butterflies are near the 30-delta.
So, in theory, there is a 30% chance that the price beach the short strikes at expiration.
And there is a 60% chance that price touches the short strikes sometime during the life of the entire trade till expiration.
How is it that we are seeing only 17.5% where price touched the short strikes?
A small part of the reason is that we are not watching the price constantly. We are only checking once a day.
The price might have touched it at some other point in time while we were not watching.
The primary reason is that we are exiting many of the trades much earlier than expiration.
By doing so, we reduce the opportunity for the price to get to the short stikes.
The 60% chance of touch only happens if you give the trade the full time from start to expiration.
Our somewhat lower profit target of 10% gets us out of the trades early and boosts our win rate.
Seventeen out of 40 trades achieved profit targets without price touching the short strikes.
Eighteen days is the average number of days in the trade for the trades that reached the profit target.
The average number of days in the trade for all trades is 25 days.
For those trades that did not reach the profit target, we try to exit between 21 to 14 days to expiration.
But that is up to the trader.
There are no hard rules.
If the position is in a safe place, one can take the trade all the way to expiration — as we did for two of the trades.
In both these trades, the price was on the “favorable” side of the butterfly — as expected.
Most of the loss and the largest loss happens on the “unfavorable” side of the butterfly.
If we do take a loss when the price is on the favorable side of the butterfly, it would be very small and would not be greater than 5% (since one of the setup rules is that the initial debit not be greater than 5% of the max risk).
The June 1 Microsoft (MSFT) trade was one that took a -2.8% loss on the favorable side of the butterfly.
The average percent return per trade is 3.7% for experiment #2. There were 34 winning trades, five losing trades, and one breakeven trade resulting in a win rate of 85%.
Summary
Both experiments showed about a 4% return per trade with a win rate of about 85%.
A trader good at picking direction may want to configure the broken-wing butterfly as in experiment #1 and may even do better than these results if the direction was chosen more accurately.
A non-directional trader may want to configure the butterfly as in experiment #2 to capture greater theta decay.
BWBs can be traded on the indices like the SPX and the RUT.
And it may be preferred to do so when trading BWBs in a non-directional fashion.
However, we did not use them in the backtest because we wanted the size of the underlying to be relatively the same.
While it makes sense that new investors learn the credit spread first, the broken-wing butterfly can be an alternative to the credit spreads (especially when the market direction is unclear).
Some may believe that butterflies are low probability trades because it is difficult for the price to fall right at the peak of the payoff graph.
While this may be the case if you hold a symmetrical butterfly to expiration, we have to remember that butterflies are profitable as long as the price moves in the direction of the peak.
In the case of the broken-wing, they can be profitable even when the price moves away from the peak during certain times in the trade (see the payoff graph with all the T-lines).
Broken wings are very dynamic trades.
Butterflies also can be profitable when prices don’t move.
This is because their positive theta makes money as time passes.
Both experiments resulted in positive returns even when the direction was randomly chosen.
This is because the price of an underlying is non-trending most of the time.
They mostly wiggle back and forth within a price range.
It is then that a positive theta strategy makes money.
Hopefully, these results will let you see them in a whole new positive light if you have not worked with broken-wing butterflies much before.
Trade safe!
Disclaimer: The information above is for educational purposes only and should not be treated as investment advice. The strategy presented would not be suitable for investors who are not familiar with exchange traded options. Any readers interested in this strategy should do their own research and seek advice from a licensed financial adviser.


Hi Gav,
In my option trading career (35+ years) obviously (and fortunately) I met many teachers, coaches and experts.
Some are really good, mastering the art. Some are great tranferring knowledge. Some are very succesful in selling their services and books. Some are simply a “bluff” (no matter how famous they are and how many books or videos they made).
But – surfing the web, trying to mitigate a risk problem in a complex position (I don´t use a single strategy but build inventory and try to exploit IV differentials) – I randomly found your blog some days ago, and I must tell you that you are a rare combination of deep knowledge (not so common in the Option arena), great communicational skills and clarity in order to transmit this knowledge in a simple, comprehensive and detailed way, and a huge generosity in fully sharing your knowledge (and exprience!) with the Options Trading Community.
(IMHO it only compares with legendary “Phantom Of The Pit (POP)” contribution).
As an old and humble trader, nothing more and nothing less than… Thank You!
Warm Regards and Stay Safe.
Hi Gustavo,
Many thanks for your kind words, I’m truly humbled.
Gav.
Hi Gavin,
“This butterfly is a bearish version using calls, and its starting position looks like this:”
The figure is missing (at least in my browser).
Regards
Fixed now. Thanks for letting me know.
Hello Gavin. Thank you very much for this posting. I would like to hear your opinion on BWB legging. What do you think is more efficient: open a credit spread and then add a debit spread? Or do the opposite?
I prefer to open butterflies as one trade.