

Today, we are looking at tail risk hedging and will discuss some ways of hedging or mitigating this risk.
Contents
Introduction
Tail risk is the risk of a sudden rare negative event happening.
The event is on the tail end of the probability bell curve.
Hence it is not a common occurrence, but it can certainly happen.
And when it happens, it is referred to as a “black swan” event.
In the context of investing, this usually means a large market selloff or crash.
Stop Loss
One quick and easy way to protect equity positions is to place a stop-loss order below the current price.
For example, suppose an investor owns 100 shares of Apple (AAPL) on July 14th, 2021, which is trading at $149.15.
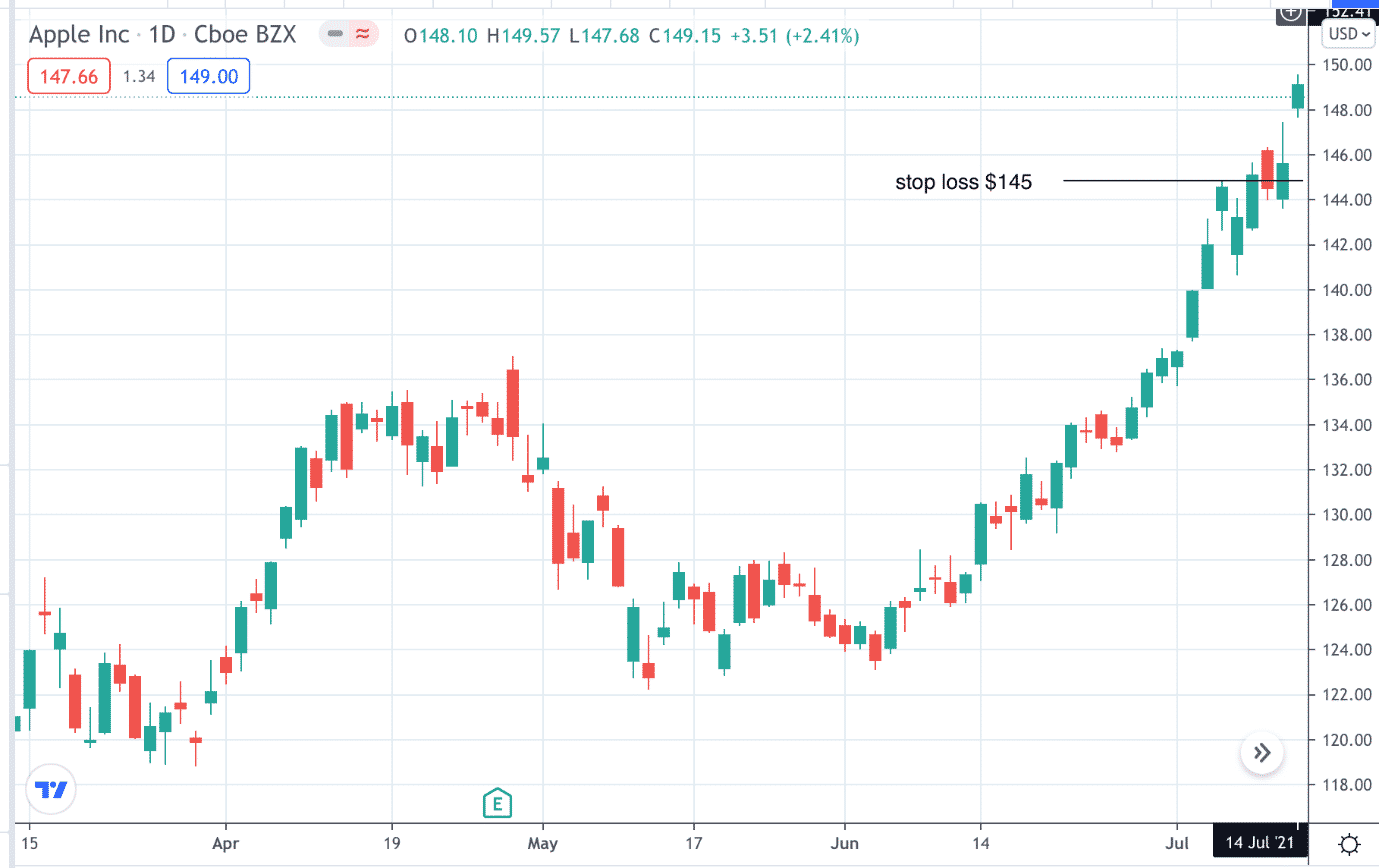
A stop-loss order can be placed at $145, which means that if the price drops below $145, the order will trigger to sell the shares at market prices.
Be mindful that the fill price can end up being somewhat lower than $145.
On July 19th, AAPL gapped down and opened at $143.75, which is where the stop order got filled.
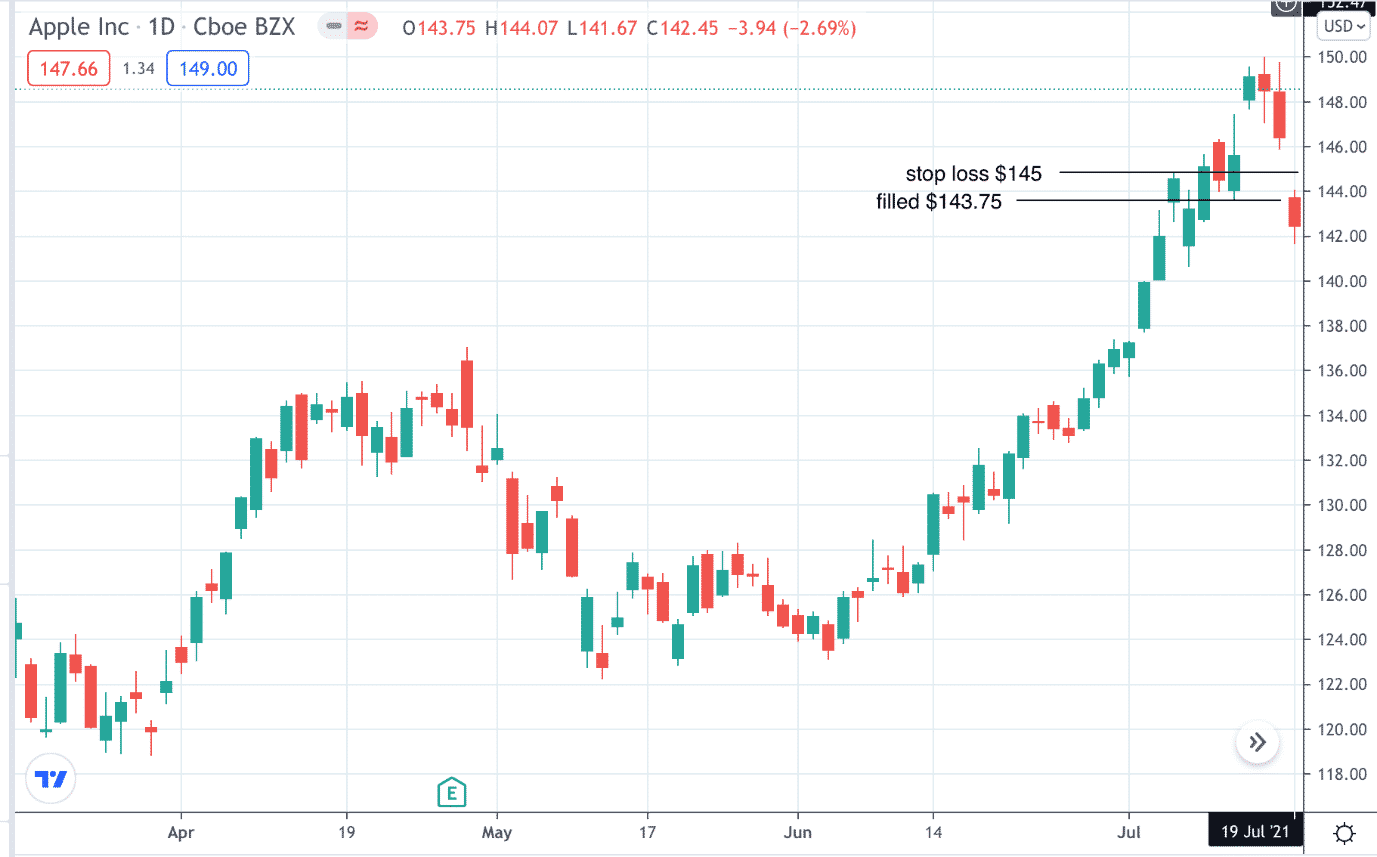
While the investor did loss $540, the investor is out of the stock which prevents further losses should prices continue to fall.
In the subsequent days, AAPL stock recovered nearly all of the loss.
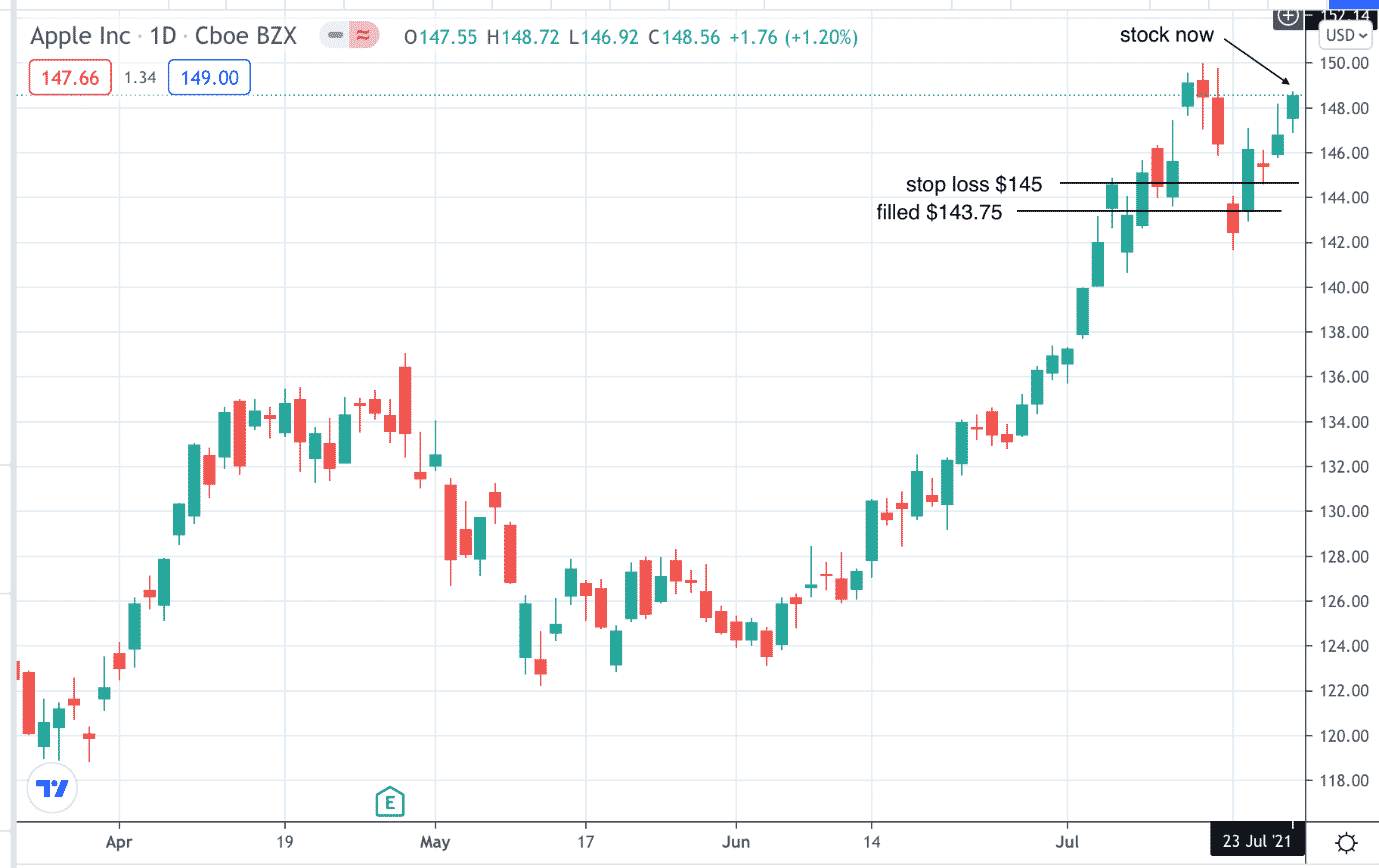
But without the stock, the investor did not participate in the recovery.
Protective Put
Instead of using a stop loss order, suppose another investor purchased on July 14th a put option expiring in January 2022, about six months away.
Date: July 14, 2021
Price: AAPL @ $149.15
Buy one $170 AAPL Jan 2022 put @ $34.70
Debit: $3470
The combination of the stock plus protective put option is known as the “married put” option strategy.
The total investment of this position is $14,915 + $3470= $18,385.
Although many investors will purchase out-of-the-money puts, this example is showing a slightly in-the-money put which is perfectly reasonable as well.
This gives greater downside protection.
The $170 strike price of the put option gives the investor the right to sell AAPL at a price of $170 any time before the January 2022 expiration.
Even in a black swan event where AAPL drops to say $80, the most the investor can lose is $1385, as can be seen on the payoff diagram:
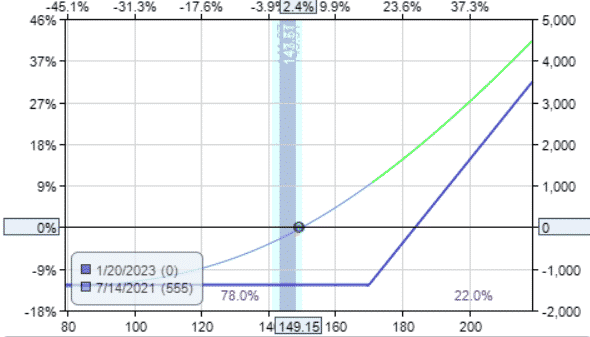
The max risk is calculated as:
$18385 – $17000 = $1385
This limits the loss to 7.5% of the total investment (calculated by $1385/$18385).
Incidentally, if an investor did decide to exit the position without waiting till expiration, it would be better financially to sell both the stock and the put option rather than to call the broker to exercise the put option.
Because doing the latter would mean that you give up the extrinsic value that is still left in the put option.
The size of the max risk can be altered by selecting which strike price to purchase the put at.
Further in-the-money strikes (strike prices that are higher) will result in lower max loss.
Further out-of-the-money strikes (lower strike prices) will result in greater max risk.
The tradeoff with using the put option is that the protective put is not free; whereas the stop-loss order is.
Because of this added cost, the married put position as a whole does not profit one-for-one with the stock move.
If AAPL price moves up $1, the stock investor with 100 shares makes $100, while the married put position makes maybe $43.
This is dependant on the cumulative delta of the position and on how far in the money the put strike is.
The further in the money, the less the investor will make, but with less risk.
The Unit Put
Some investors who feel that the married put strategy incurs a drag on P&L performance may forgo using the protective puts and instead purchase “unit puts” to hedge a long-bias portfolio against tail risk.
A “unit put” is a term used by market makers to refer to a far out-of-the-money option at the 3 to 5 delta.
They are purchased at a low cost with an expiry that is months out in time.
They expect that these puts expire worthless most of the time.
But in the event of a market crash, they will expand in value as the market drops closer to the put strike price, the implied volatility increases, and greater demands for puts by other investors.
Unit puts would not do much on our example where AAPL dropped only 4.5%.
But suppose an investor had purchased a 5-delta put of the SPX (S&P 500 Index) at the start of the year 2020.
Date: Jan 2, 2020
Price: SPX @ $3257.85
Buy one $2410 SPX May 15 put @ $5.25
Debit: $525
On March 11th, when the market dropped about 20% from its high, that put would be worth $9935, which the investor could take the profit of $9410 to offset any losses in the portfolio.
On March 23rd, at the bottom of the selloff, when the market was down 34%, that unit put is worth $27,505.
Of course, at the time, no investor would know where the bottom is.
Some investors will buy new puts staggered on top of existing puts every month, just like monthly car insurance payments.
Having multiple layered puts in place, the investor can cash out one put at a time as the market drops.
The VIX Call Ladder
A drop in the SPX is accompanied by a rise in the VIX, the S&P 500 volatility index.
Therefore, other investors may take advantage of the spike in VIX as a hedge.
One method uses the call ladder with an expiry about three months out, as illustrated in this example.
Date: July 15, 2021
Price: VIX @ $16.96
Sell one $18 VIX Oct 20 call @ $5.60
Buy one $25 VIX Oct 20 call @ $3.35
Buy one $32.5 VIX Oct 20 call @ $2.20
Credit: $5
This trade is usually initiated for close to even money.
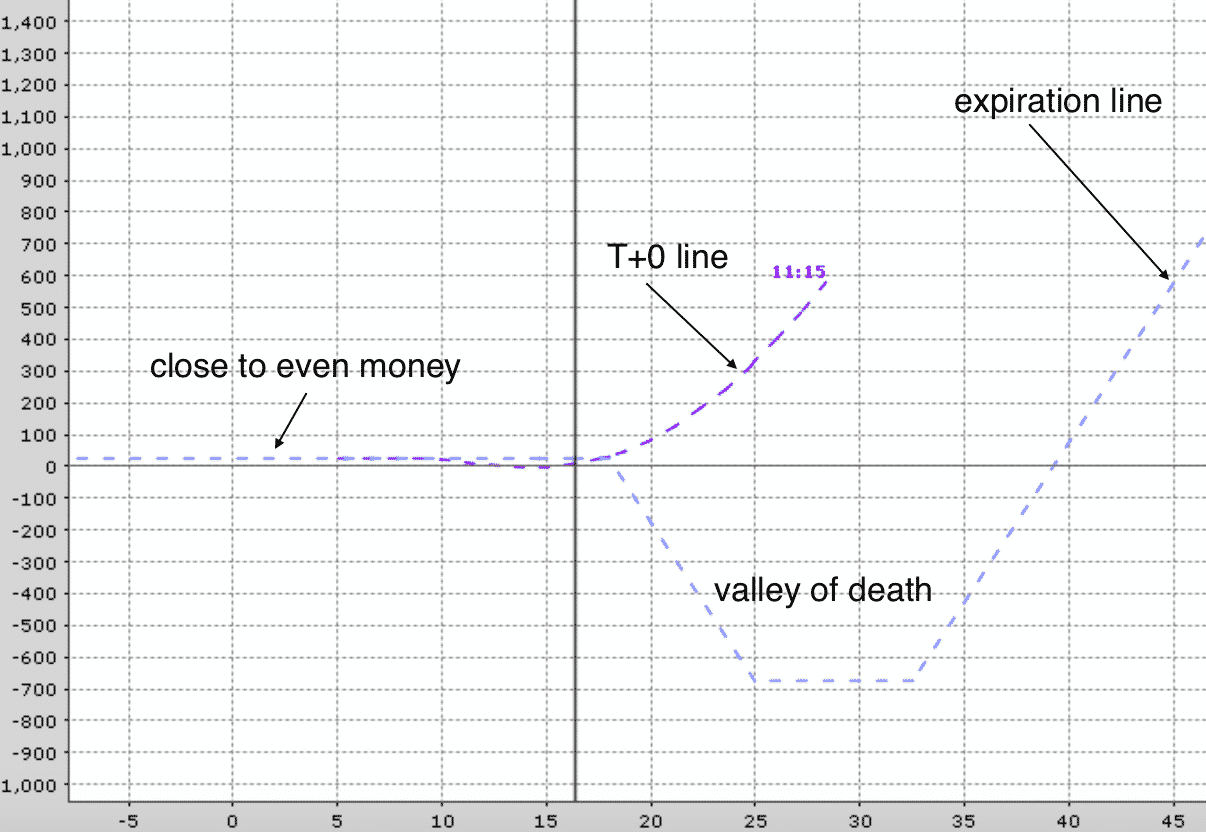
That way, if the VIX continues to drop slowly, the position does not lose much money. It is when the VIX increases that you see the T+0 line go up.
Considering that we did not pay any debit for this hedge, any significant increase in the VIX should give some positive payout as long as the T+0 line does not dip into the “valley of death.”
This starts to occur about one-third of the duration till expiration as the T+0 line goes closer and closer to the blue expiration line.
The investor should exit the position. A new fresh call ladder can be established.
The structure of the call ladder is similar to the back ratio call spread, where two calls are purchased, and one call is sold.
The only difference is that the back ratio has both purchased calls at the same strike instead.
It can be viewed as purchasing a call (the 32.5 call in our case) to capture any upward moves.
This call is being completely financed by the sale of the bear call spread (short the $18 and long the $25 call spread).
Conclusion
For protecting equity positions, we looked at stop-loss orders to limit loss to the dollar amount that the investor is willing to incur.
Then we looked at using protective puts to limit loss to a certain percentage of the investment.
Then we looked at unit puts and VIX call ladders to hedge tail risk in the overall portfolio.
In these examples, we are using only one contract for illustrative purposes.
The hedge will need to be sized up depending on account size and the amount of hedge required.
Most investors will not hedge anywhere close to 100%, just enough to sleep better at night.
Tail risk hedging is not an exact science.
No doubt there are many other creative ways out there.
Trade safe!
Gav.
Disclaimer: The information above is for educational purposes only and should not be treated as investment advice. The strategy presented would not be suitable for investors who are not familiar with exchange traded options. Any readers interested in this strategy should do their own research and seek advice from a licensed financial adviser.


great article, Gavin. Thank you.
You’re welcome, glad you liked it.
Good one Gavin! Thanks 🙂
🙂