


Today you will learn all about an ADX trading strategy that we have been back testing here are Options Trading IQ.
We think you will be impressed with the results.
Read on to learn more:
Contents
- Introduction
- The ADX Indicator
- Best ADX Setting
- Down Sloping ADX Does Not Mean Price Is Going Down
- Preliminary Study Of Bullish ADX Pattern
- Preliminary Study Bearish ADX Pattern
- Using The 50-Day Moving Average Filter
- Why Some Trades Fail
- Avoiding Earnings
- Using Options
- The Results
- Further Optimizations
Introduction
Different options strategies are good for different types of markets.
You do not want to trade iron condors when the stock is about to go on a big trend.
You do not want to trade debit spreads if stock is range-bound.
Today, we will develop and back-test a trend continuation trading strategy based on the ADX indicator.
The “Average Directional Movement Index” indicates how the strength of a trend.
It is based on the moving average of price expansions.
We will leave the indicator at its typical default setting of 14-period for the moving average.
The ADX Indicator
There might be two different indicators on your trading platform that are related to ADX.
One might say “ADX”, and the other might say “ADX and DI”.
The ADX indicator has only one line.
Despite its name, the ADX line does not tell you the direction that the price is moving.
Only the magnitude of the trend (be it up or down).
The second indicator is the ADX with DI indicator.
This is the indicator that we will be talking about in the rest of the article.
It has three lines: the ADX line plus the DI+ line and the DI- line. The green DI+ line is a Directional Indicator in the positive direction.
The red DI- line is the Directional Indicator in the negative direction.
Here is an ADX with DI indicator plotted at the bottom of the McDonalds (MCD) chart on June 2, 2020.
With the addition of these two lines, the indicator does give us the direction of the price movement.
If the green line is above the red line, that means the price trending up.
If the red line is above the green line, the price trending down.
The black line is the ADX line, and it tells you whether the price is trending or not.
If it is above 20, the price is trending. If it is below 20, the price is not in a trend.
The ADX Indicator
Some investors prefer to use ADX above 25 to consider a stock as trending.
We find that to be a bit lagging, and the price is already midway in its trend when ADX is at 25.
Therefore, we prefer to catch the trend earlier by using ADX greater than 20 to indicate a trend.
The higher the ADX value, the stronger and longer the trend is.
If the ADX line is sloping upwards, the trend is increasing and getting stronger.
If the ADX line is sloping downwards, the trend is weakening.
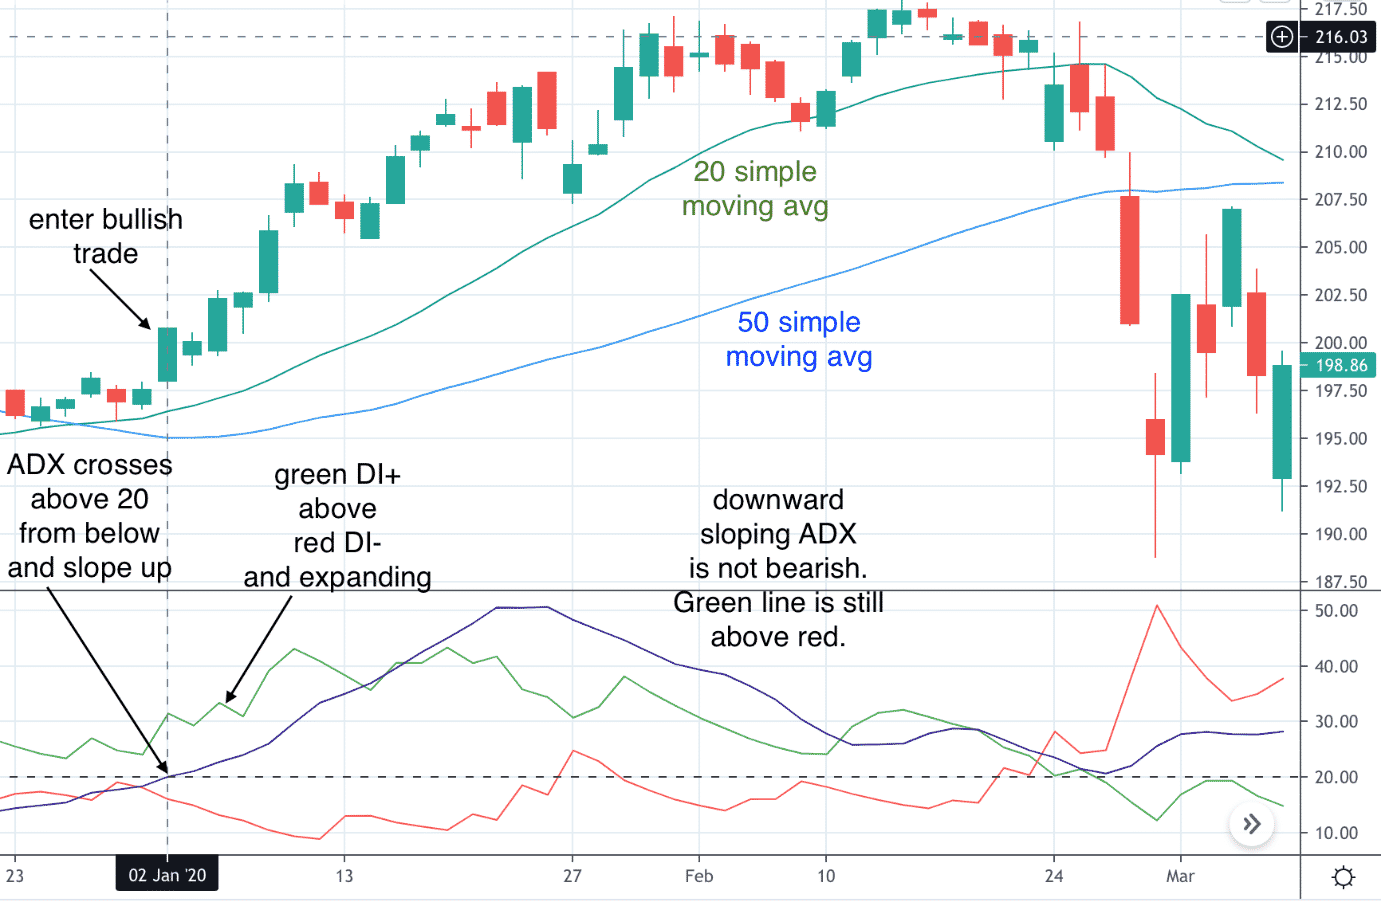
The above graph on January 2 shows the ADX indicator crossed above 20 from below as price transitioned from non-trending to trending.
The ADX line is sloping up, meaning the trend is increasing, suggesting a new trend.
The price direction is bullish because the green line is above the red line.
Buyers are stronger than the sellers.
The green line is sloping up while the red line is trending down.
The two lines are diverging. Buyers are getting stronger while sellers are getting weaker.
This pattern is what we will call the bullish ADX pattern and would trigger an entry for a bullish trade.
This bullish ADX pattern is going to be the basis of our ADX trading strategy.
Down Sloping ADX Does Not Mean Price Is Going Down
Do not make the mistake of thinking that a downward sloping ADX line means that price is about to reverse.
It only means the trend is slowing.
Price may stop moving up as strongly or may experience a short pullback (as in MCD in the above chart).
Price may pause or consolidate.
It does not have to reverse, and many times it will not.
Preliminary Study Of Bullish ADX Pattern
As a preliminary study for building our ADX trading strategy, we generated some random dates from 2018 to 2020 and looked for bullish ADX patterns around that date.
After spotting the ADX bullish pattern, we note where the price was 14 days later and one month later.
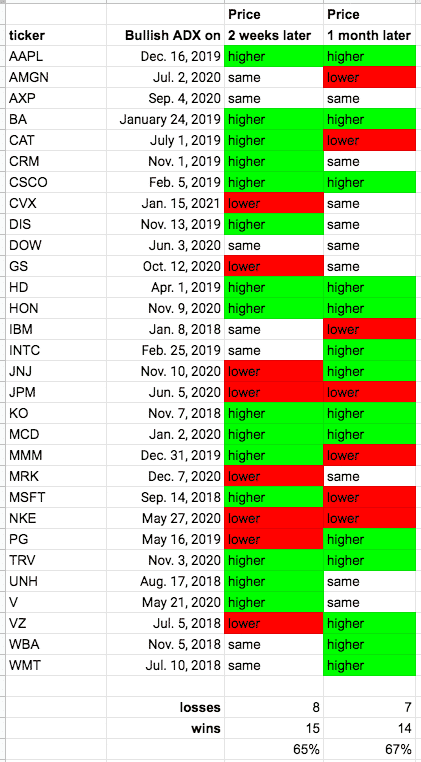
Without regard to other technical indicators and earning release dates that might affect prices, we saw that often, the price was higher 14 days later and was higher one month later.
For example, 14 of the Dow Jones Index stocks had prices higher one month after the bullish ADX pattern occurred.
Seven of the Dow stocks had prices lower one month later.
And the remainder of the Dow stock had price ended up just about where it started.
Ignoring the break-even trades, that is a 67% winning percentage — 14/21 = 0.67.
The winning percentage for the shorter term 14 days trade was about the same at 65%.
Preliminary Study Bearish ADX Pattern
One might counter that this could be due to the bullish market rather than the ADX bullish pattern.
So, we then did a similar study for the bearish ADX pattern of those same years.
Just like the bullish ADX pattern, a bearish ADX pattern is when the ADX line crosses above 20 from below.
The difference is that the red line needs to be above and diverging away from the green line like this chart of Chevron (CVX) on September 14, 2020.
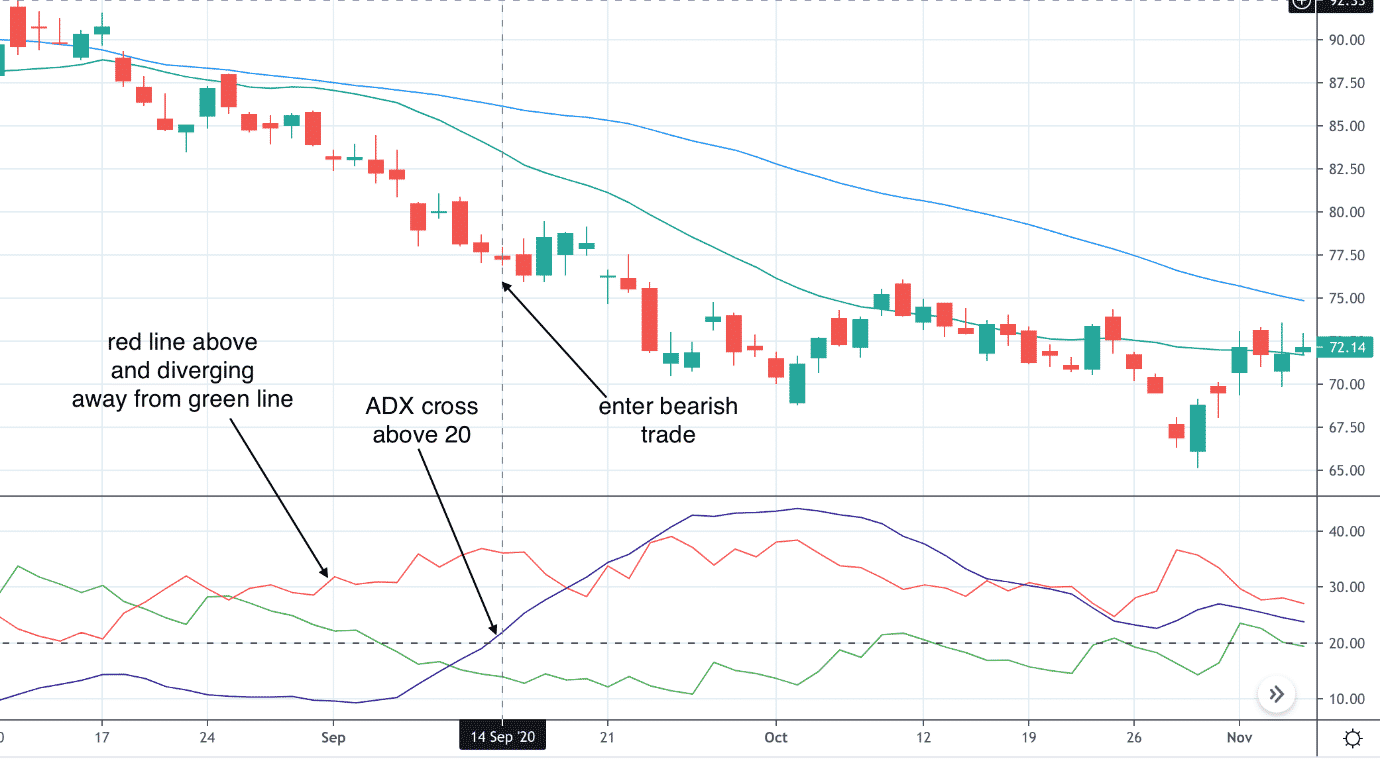
After the bearish ADX pattern, prices often were lower 14 days later as well as one month later.
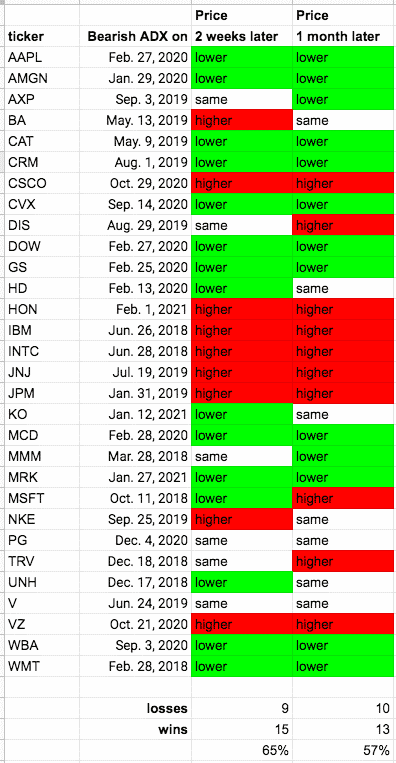
While the wins were not as great as in the bullish ADX pattern, this suggests that the ADX indicator does have some predictive abilities.
Using The 50-Day Moving Average Filter
By being more selective in our trades, we sometimes can increase our winning percentage. We will apply the 50-day moving average filter.
If the price is above this line, we consider it a bullish stock.
If the price is below this line, we consider it a bearish stock.
We shall only make bearish trades if the price is below the 50-day moving average.
And we shall only make bullish trades if the price is above the 50-day moving average.
In our dataset, four bearish trades did not meet this criterion: tickers HD, JPM, NKE, V.
We found that eliminating these four trades increased our win percentage slightly.
So, let’s add this filter as part of our ADX trading strategy.
Why Some Trades Fail
Upon examination of some failed trades such as Intel (INTC) on June 28, 2018, with the RSI indicator plotted at the bottom…
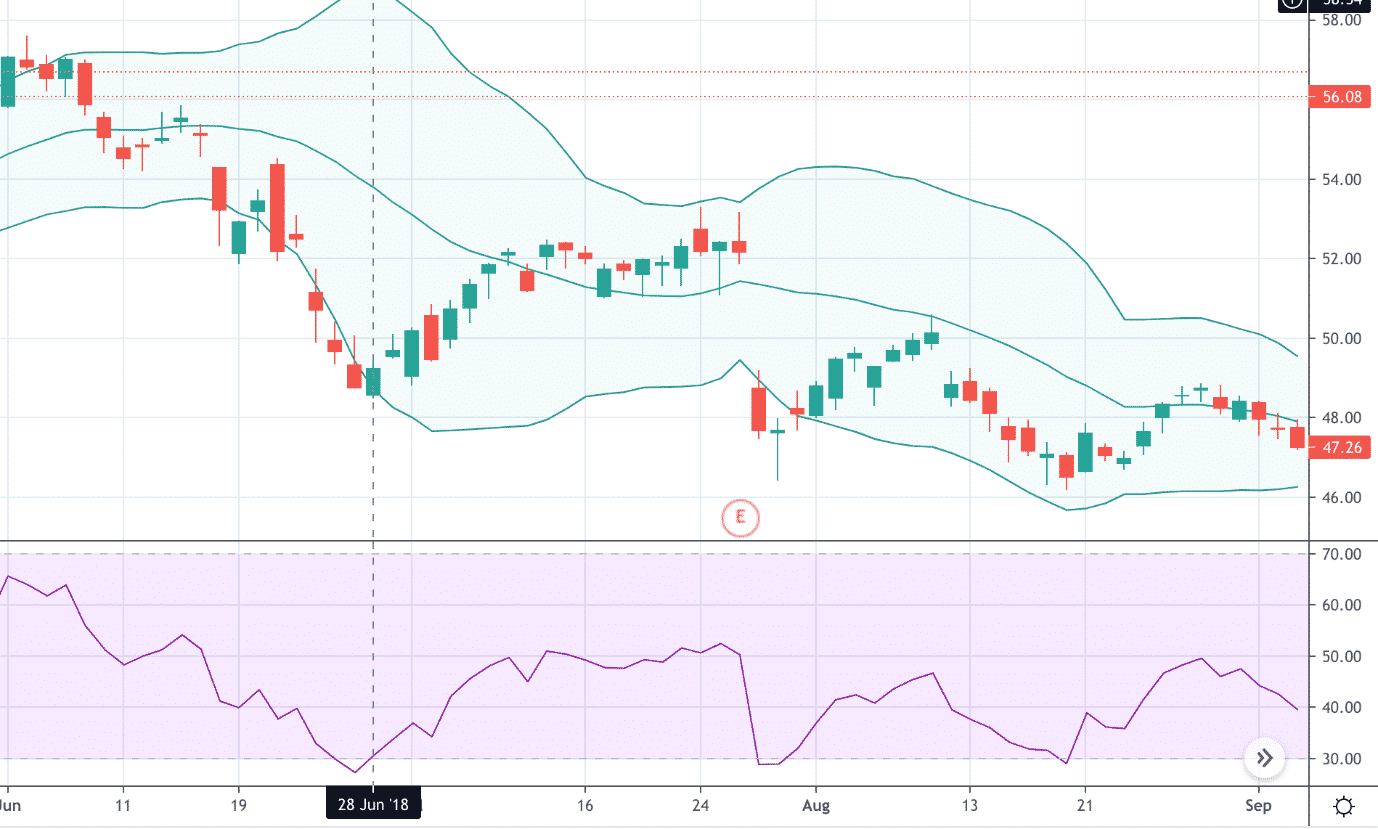
The bearish trade was initiated on June 6, 2018, when INTC was bottoming out and about to bounce back from its price extreme.
We can tell that it is at a price extreme because the RSI is oversold below 30.
Dow Jones blue-chip companies like Intel tend to reverse when the price is at extreme lows.
Let’s add a rule to avoid making trend continuation rules when RSI is below 30 or above 70.
Avoiding Earnings
Did you notice the big gap in the Intel chart above where there was an “E” indicating an earnings report?
We do not want that kind of unpredictability during our trades.
For our back test, let’s add a rule to avoid any trades where there are earnings within four weeks of the start of the trade.
Upcoming earnings tend to drive implied volatility of options to go up, which is unfavorable for credit spreads.
Credit spreads are what we are planning on using.
Using Options
So far, the ADX trading strategy appears to be profitable with trading using straight stock.
Since we are options investors, let’s see if we can further improve P&L and ROI with less capital by using credit spreads.
Using credit spreads, we can be profitable even on those trades where the price did not go in our direction but remained the same.
We are going to initiate a credit spread around 45 days to a monthly expiration.
And we will have a timed exit one month into the trade, provided that the trade had not already exited with the take profit condition.
The take profit condition is when our profits have reached 50% of the initial premium received.
Depending on the investor, some will want to sell the spread closer to the money and others further out-of-the-money.
We will do something in-between and sell at the strike at around the 25 Delta out-of-the-money and buy at the 15 Delta for this back test.
We will sell enough contracts to get at least a $200 credit in the premium.
The Results
With the filtering rules to be selective in our trades, we are only left with these ten trades from the list of bearish ADX trades seen above.
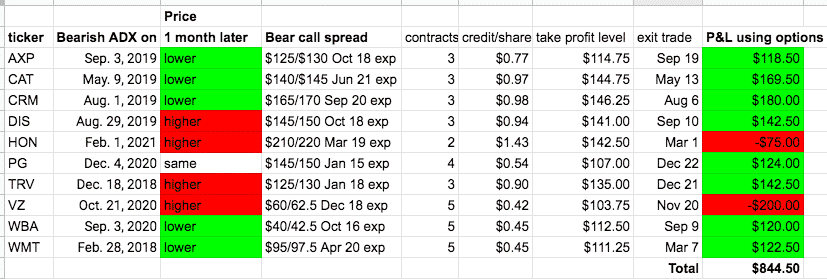
The results look good, with eight wins and two losses resulting in a net profit of $844.
Note that in some of the trades where the price just went sideways, we could still profit via the use of options.
Ten trades, however, are not a big sample size.
We are not saying that those are the only opportunities available.
We were just randomly picking one trade per Dow stock and filtering them out by our criteria.
If we look more exhaustively, we probably will find more patterns that meet our criteria.
Let’s do the same for the bullish ADX trades.
Trading on the bullish ADX pattern turns out to give even better results, with twelve wins totaling $1531 in profits.
This could because the market tends to go up more often than it goes down.
Another reason is that some of the years being tested were abnormally bullish years.
Further Optimizations
While we did not take implied volatility (IV) into account in our back test, investors may choose to take credit spread trades only when the IV rank is moderate or high.
Or they may choose to do debit spreads instead during low IV.
We also did not implement a rolling strategy in this back test.
Some investors like to roll the spread out in time, provided it can be done for credit.
They can initiate the roll if the closing price breaches the short strike, or if the P&L is negative at the time of the timed exit, or any other trigger conditions.
These are ideas for you to try out.
Trade safe!
Disclaimer: The information above is for educational purposes only and should not be treated as investment advice. The strategy presented would not be suitable for investors who are not familiar with exchange traded options. Any readers interested in this strategy should do their own research and seek advice from a licensed financial adviser.


Excellent Learning, Thanks a lot for knowledge.
Great application of this indicator. Also nice ideas to explore further. Thanks!
Thanks legend.