


Contents
- Identification of the Evening Star Doji
- The Doji Candle
- Identification of an Evening Star Doji
- Target Price
- Hedging Position
- The Grass is Greener
The Evening Star Doji pattern is a pattern consisting of three candlesticks.
It is used by technical analysts as a reversal pattern and the potential end to a bullish trend.
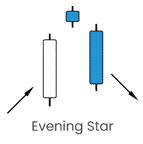
To find an Evening Star Doji pattern, we need to look for three subsequent candles:
- A large green candle in an uptrend.
- A small green or a red candle.
- A large red candle of a bearish trend.
The evening star is the opposite of a morning star pattern which is a bullish trend indicator.
One of the most critical aspects of the evening star pattern is that it signifies a decrease in the momentum of a bullish trend indicated by a short candlestick in the middle candle before the downturn.
This can visually show that when a stock is overbought, the momentum is starting to wane.
Identification of the Evening Star Doji
Identification of an Evening Star Doji requires more than identifying the three candles.
The trader needs to understand the price trend before and after the pattern.
After all, if the asset is not trending, the signal could be entirely different from what the trader thinks they are trading.
Detailed identification can be carried out using the following steps:
Identify a volatile bullish trend – The asset prices reach new highs and lows in the recent past. Price is moving in one direction.
Large bullish candlestick – Towards the end of the uptrend, a large bullish candle is formed. The trend is still likely to be bullish, and the reversal is still not likely as there is no such evidence from the markets. At this point, the stock may look overextended.
Small bullish/bearish candle – This signifies that the pattern is losing steam. The small candle can be a Doji and is a sign of the uptrend being pressured by the bears. The market is now in undecided territory. This candle usually reaches higher highs.
Large bearish candle – indicates the selling pressure from the bears. The bears overpower the bulls, and the price falls, signaling an effective downtrend.
Subsequent down-trend – The bearish trend continues for several candles, and prices experience lower lows.
Experienced traders will look out for the tussle between the bulls and the bears and the formation of a Doji or a small candle.
Since it is a reversal pattern, it is better to short the asset to profit from the downturn.
If an investor is long the stock, it may signify a good time to take profits.
The Doji Candle
The formation of the Doji candle results from the candle opening and closing at a similar price point.
An evening star doji shows the market is undecided after the bull rally.
This indecision could be seen as a turning point, as shown below.
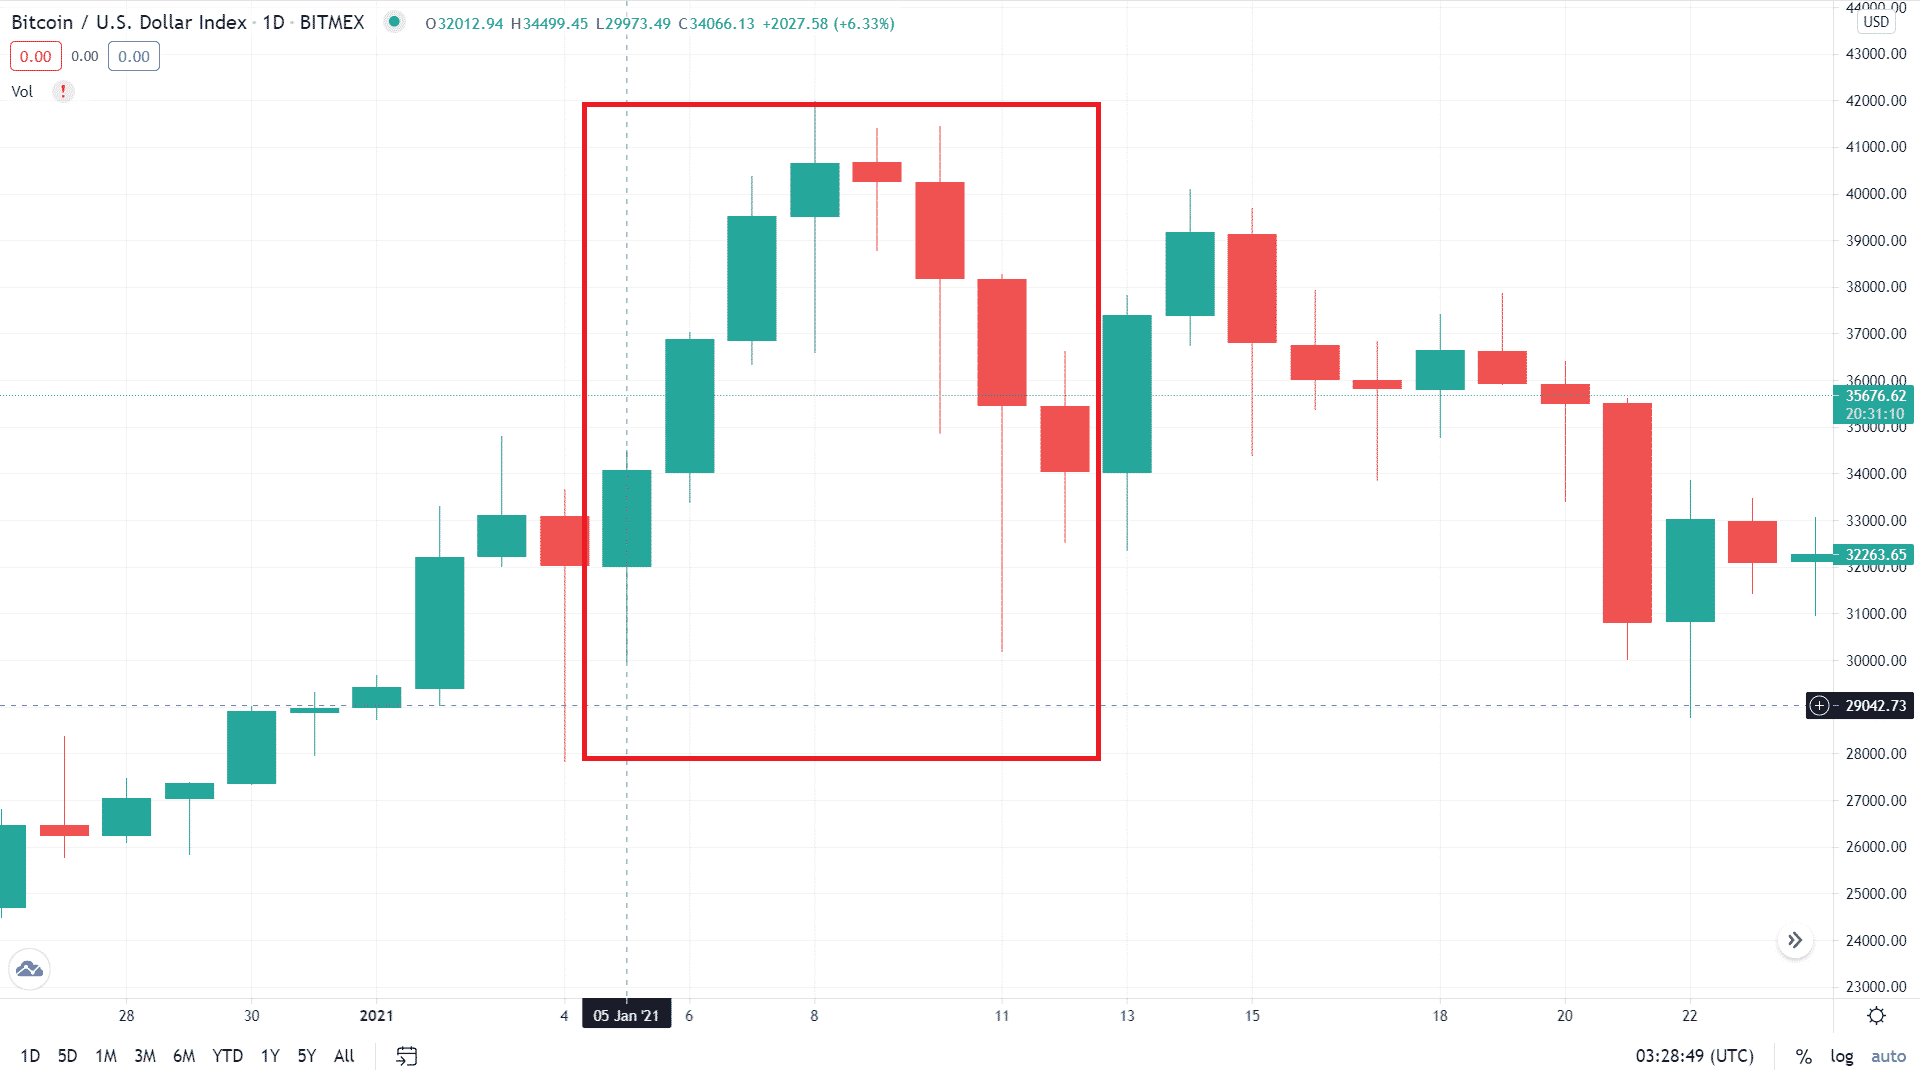
Let’s look at Bitcoin prices from January 2021.
Around the 5th of January, we see a bullish pattern establishing itself, continuing till the 8th of January.
The price increase is significant, leading to all-time highs in Bitcoin prices.
Bullish sentiment is fully in control.
Identification of an Evening Star Doji
Around the 9th of January, there is a slight fall in price, which indicates that the bull run might be ending.
This is where the decision to short needs to be taken.
Some traders would like to wait for some hours or even a day to confirm the downturn.
However, this would reduce their profit from short trade as they enter at a lower price point.
From the graph, a short trade can be entered at somewhere around $41,000.
Then when the price falls below a target level, the trader can buy back the shares and take profits.
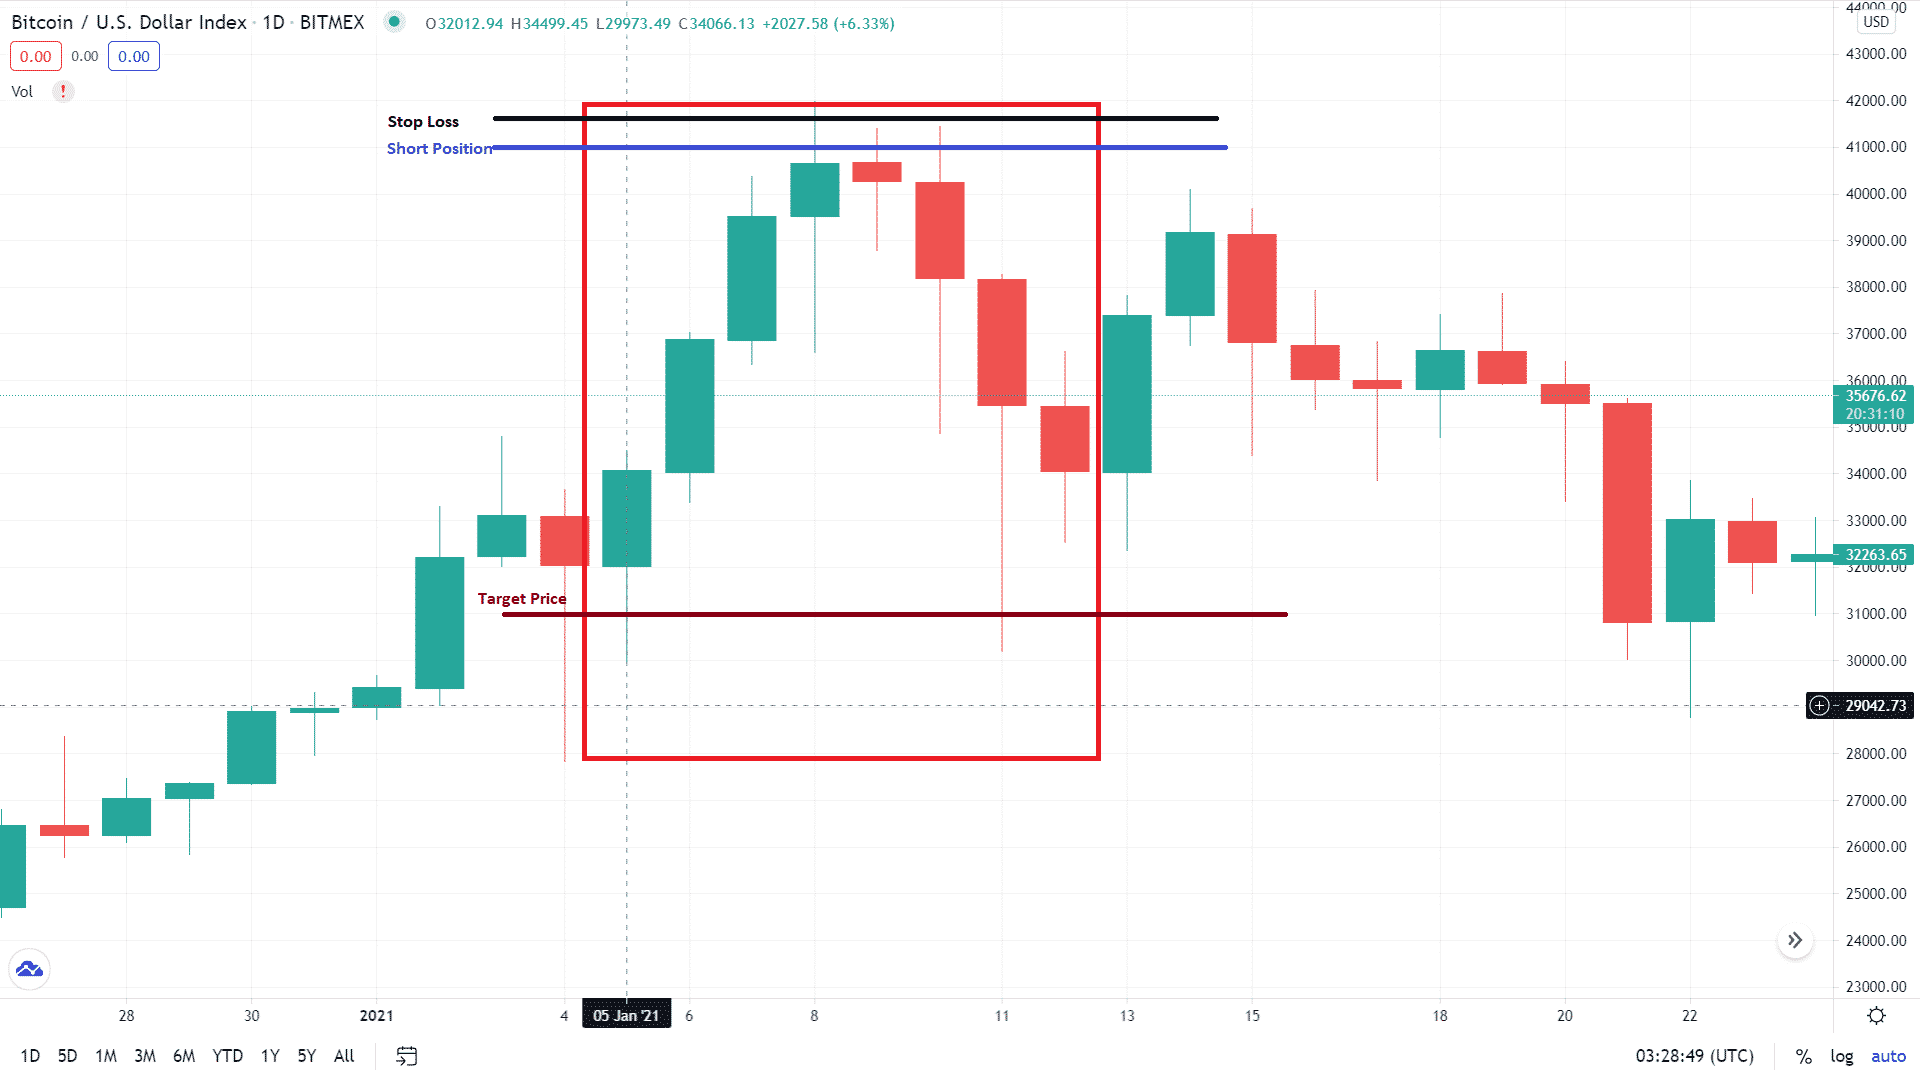
Target Price
The target price for the short trade is crucial to take full benefit of the pattern. Too early, and money is left on the table.
Too late, and the trend could change completely.
To assess a profit target, traders can look at the previous resistance levels or a longer-term trend line.
This would indicate a region of long green candles, as seen in our example.
In the graph provided of Bitcoin, long elongated candles start at somewhere near the $31,000 region.
This is where the target for short trade is applied.
At this level, the profit should be realized by exiting the trade.
In our example, we can see that the prices decrease to below $31,000 and then pick up again.
Hedging Position
To hedge the position, you need to include a stop loss.
Ideally, it should be placed somewhere above the Doji candle price point.
A price rise above this would invalidate the pattern, and the bull run may continue.
So, it would be placed somewhere around the $41,500 – $42,000 level in our example.
Hedging is necessary because a significant price rise above the price at which the short trade was entered could result in a substantial loss.
Despite this, including the stop loss at the price at which trade was entered could result in exiting the trade for even a small rise in price.
This may result in a loss of opportunity because the patterns are not always exact, and there can be small deviations.
Therefore, it is better to have a small wiggle room for the pattern, and hence traders should place the stop loss above the $41,000 level.
In our graph, the stop loss is placed approximately at the $41,700 level, which may result in a small loss if prices rise but would not invalidate the trade for a small rise above the $41,000 level.
The Grass is Greener
A word of caution as with any trade.
Technical trading can be lucrative but can be risky at the same time. A trader cannot be sure of the Evening Star Doji pattern developing even after forming the Doji candle.
There can be a continued rise, and without hedging, this may result in significant losses.
This trade will result in a lot of small losers and some infrequent larger winners.
The Evening Star pattern is relatively easy to identify since it consists of three candlesticks.
It is also easier to identify the entry and exit points as the bull, and the bear run can be easily seen on the charts.
It would therefore be wise to be on the lookout for the evening star and, with proper hedging, see if the trade works out.
Trade safe!
Disclaimer: The information above is for educational purposes only and should not be treated as investment advice. The strategy presented would not be suitable for investors who are not familiar with exchange traded options. Any readers interested in this strategy should do their own research and seek advice from a licensed financial adviser.


