

Contents
With VIX at three-year lows, let’s look at a calendar and double calendar example.
Calendars are long vega trades and theoretically make money if IV increases.
Let’s say a trader started the trade with a two-lot at-the-money calendar on the SPX like this:
Date: January 7, 2022
Price: SPX @ 4687
Sell two January 21 PM SPX 4690 put @ $57.15
Buy two January 24 SPX 4690 put @ $60.75
Debit: -$720
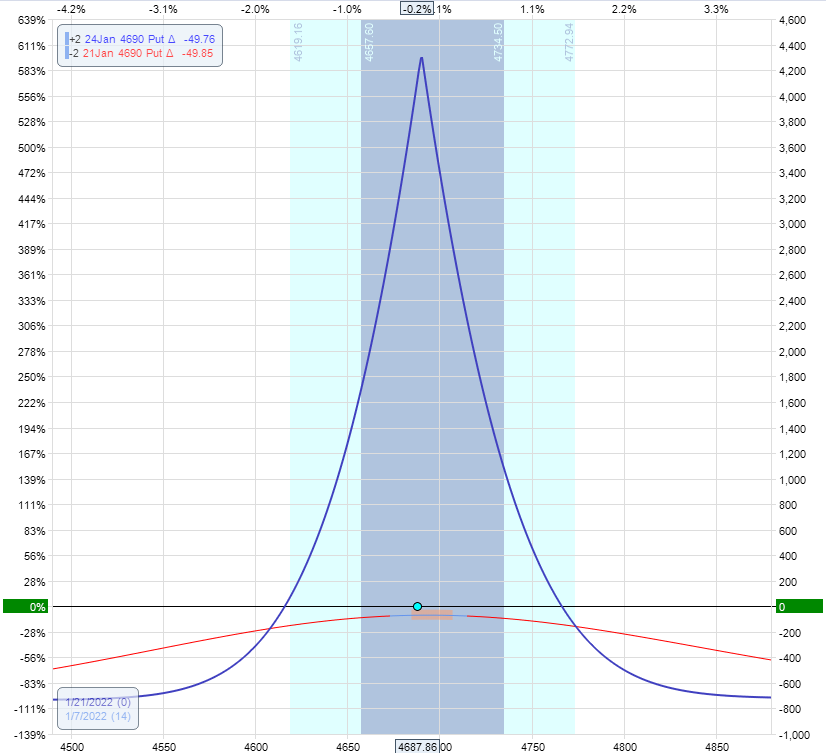
The max risk currently in this trade is $720, the same as the debit paid.
We just want the price dot to be in the center of the at-the-money calendars.
We’ll adjust if the price moves to the edge of one side of the calendar.
We say that the expiration graph is the “tent.”
Like a circus tent, people want to be inside underneath it to avoid getting wet from the rain.
I know.
It is a bad analogy.
The next day, the price exited the tent on the left:
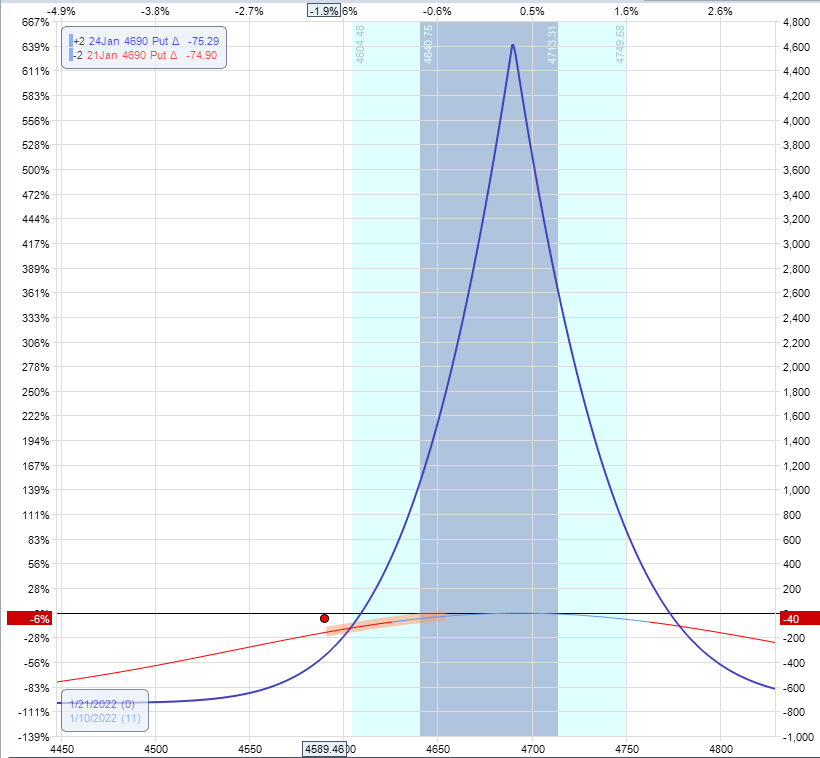
We’re getting rained on.
We have to adjust.
The trader adds another set of calendars (equal in number of contracts as the first).
We want to add it below the price so that the two calendars are about equidistant from the current price.
So, for example, right now, the price is 100 points below the strike of the existing calendar.
Let’s try adding a calendar at 4490, which is 100 points below the current price.
The modeling software OptionNet Explorer shows that this adjustment would produce an expiration graph that is sagging a lot in the middle.
To reduce the sag, try moving the calendar closer to the price.
Let’s try 4520:
Date: January 10, 2022
Price: SPX @ 4589
Sell two January 21 SPX 4520 put @ $42.15
Buy two January 24 SPX 4520 put @ $46.30
Debit: -$830
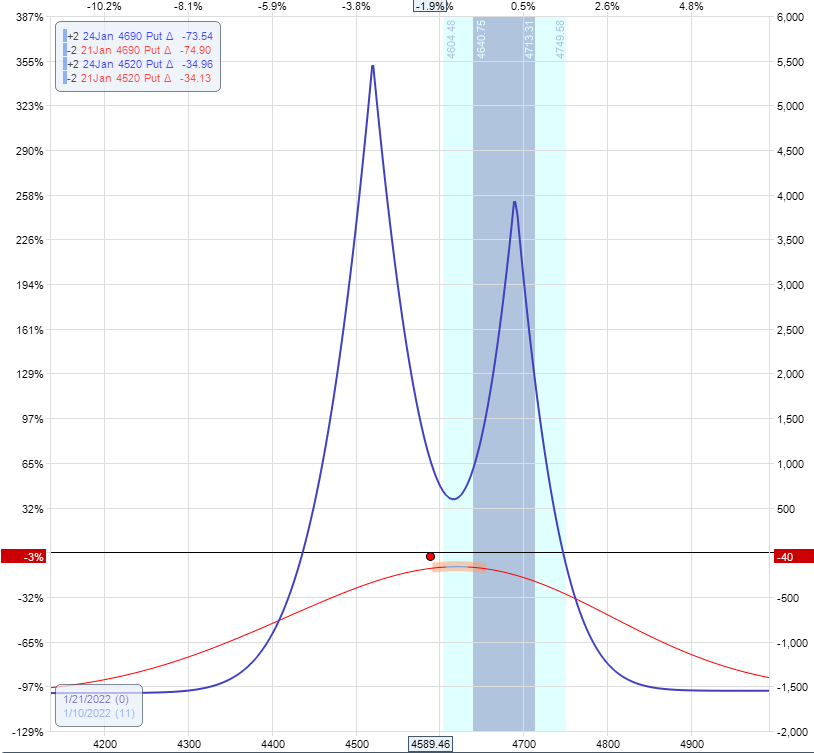
That’s a little better.
At least now the double tent is covering the price.
We now have a double calendar.
Note that we have about double the risk in the trade than before.
The max risk is now around $1500.
The most important thing about the double calendar is to keep the price dot between the two calendars’ peaks.
The next day, the price stays inside:
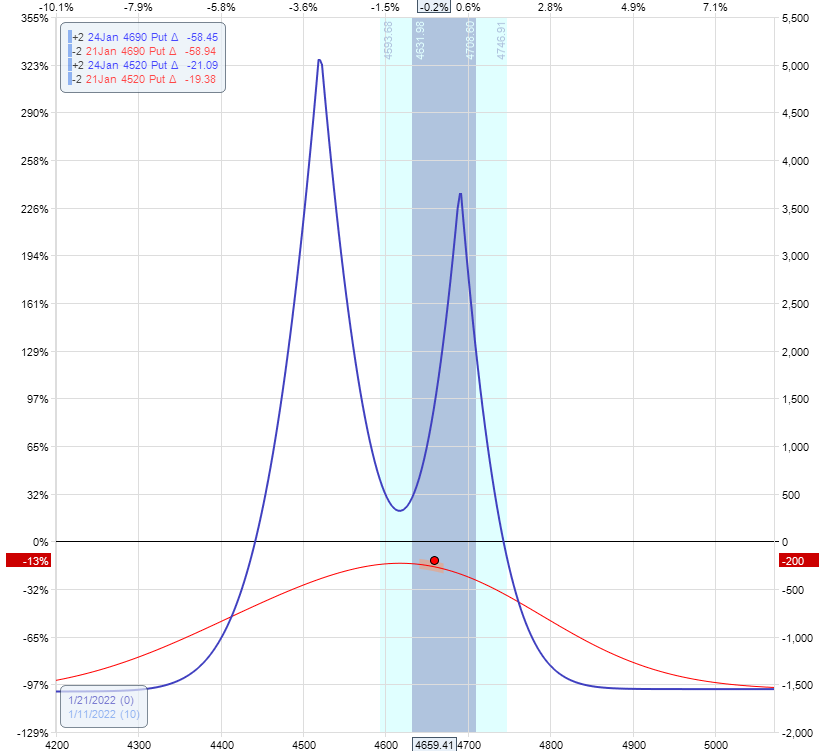
We adjust if the price goes outside of the peaks of the calendars, as in the case of the following day:
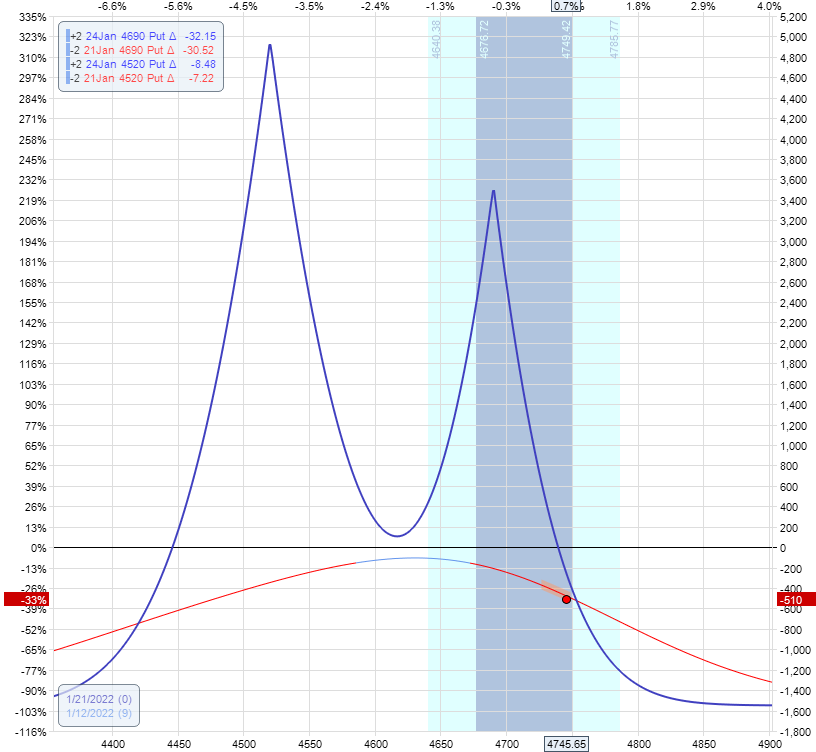
The upper calendar has a strike price of 4690.
The price of SPX is 4745.
The price of SPX has exceeded the upper calendar’s strike (or peak).
Perform the calendar swap.
The calendar swap is to remove the calendar that is further away from the current price.
In this case, the trader closes the put calendar at 4520.
Date: January 12, 2022
Price: SPX at 4745
Buy to close two January 21 SPX 4520 put @ $5.10
Sell to close two January 24 SPX 4520 put @ $6.75
Credit: $330
And then add call calendars at 4800.
Sell two January 21 SPX 4800 call @ $14.00
Buy two January 24 SPX 4800 call @ $16.70
Debit: -$540
This is usually done in two separate orders.
However, it can be done as a single order if you like.
The resulting graph keeps the price in the middle of the tent.
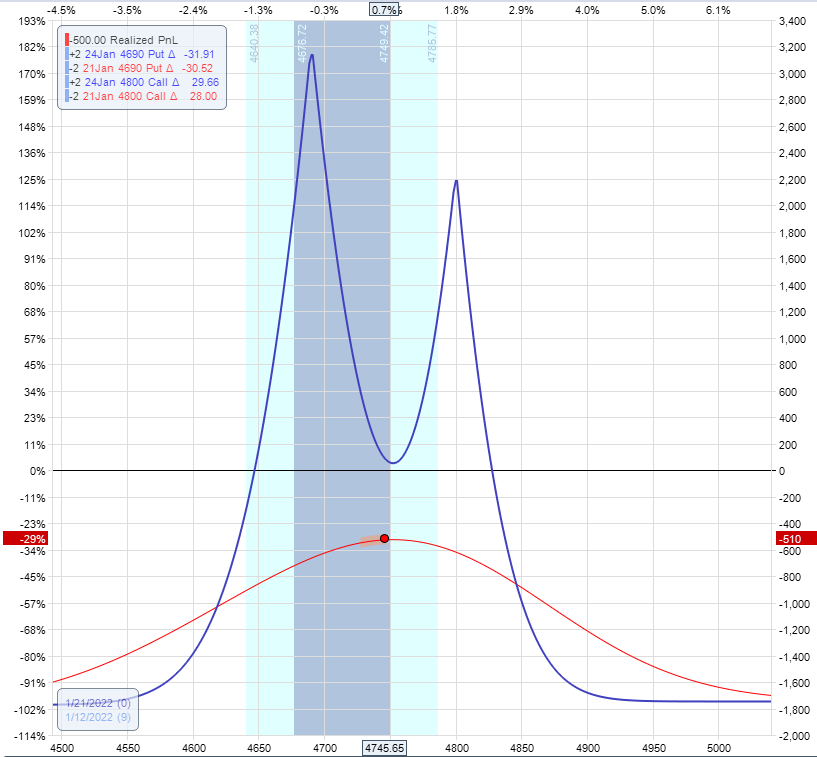
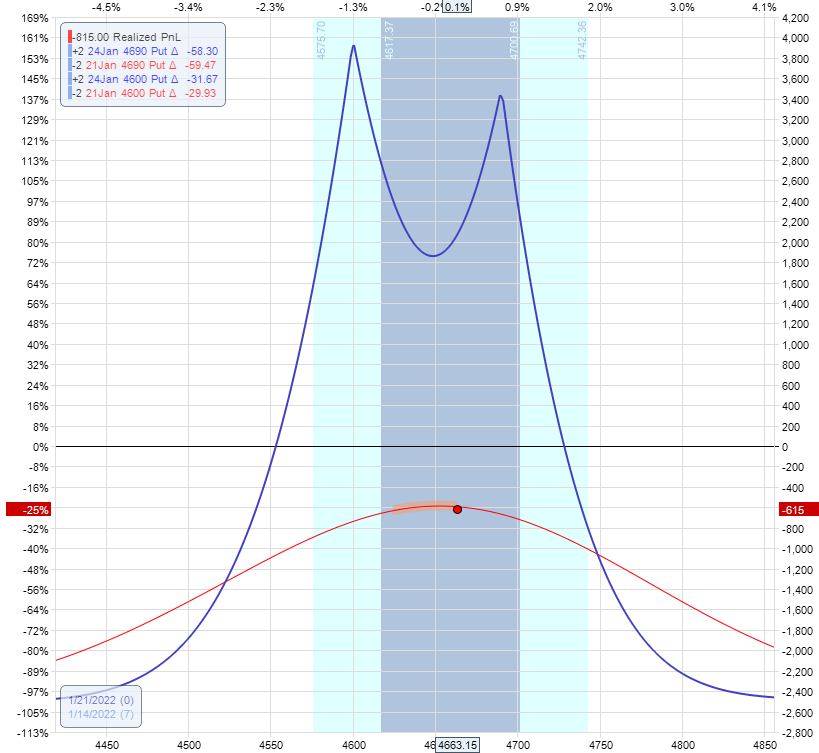
On January 14, 2022, the price moved down and below the peaks of the two calendars:
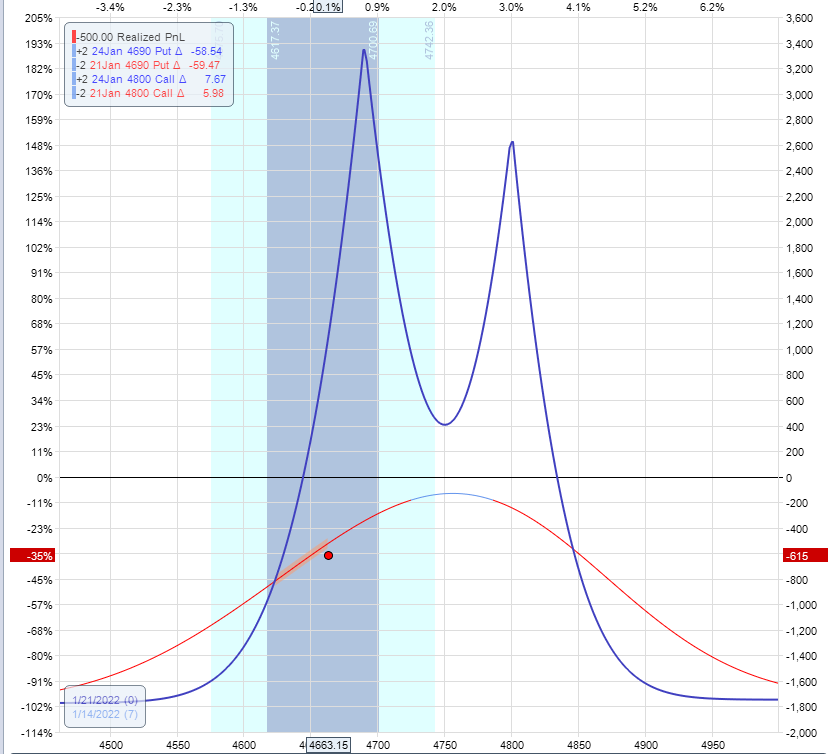
Perform another calendar swap.
The trader removes the call calendar and adds a put calendar at 4600.
Date: January 14, 2022
Price: SPX @ 4663
Buy to close January 21 SPX 4800 call @ $2.08
Sell to close January 24 SPX 4800 call @ $3.20
Credit: $225
Sell to open two January 21 SPX 4600 put @ $24.50
Buy to open two January 24 SPX 4600 put @ $29.25
Debit: -$950
What If The Price Comes Right To The Strike Of One Of The Calendars?
That happened on January 18, 2022.
It looked like this.
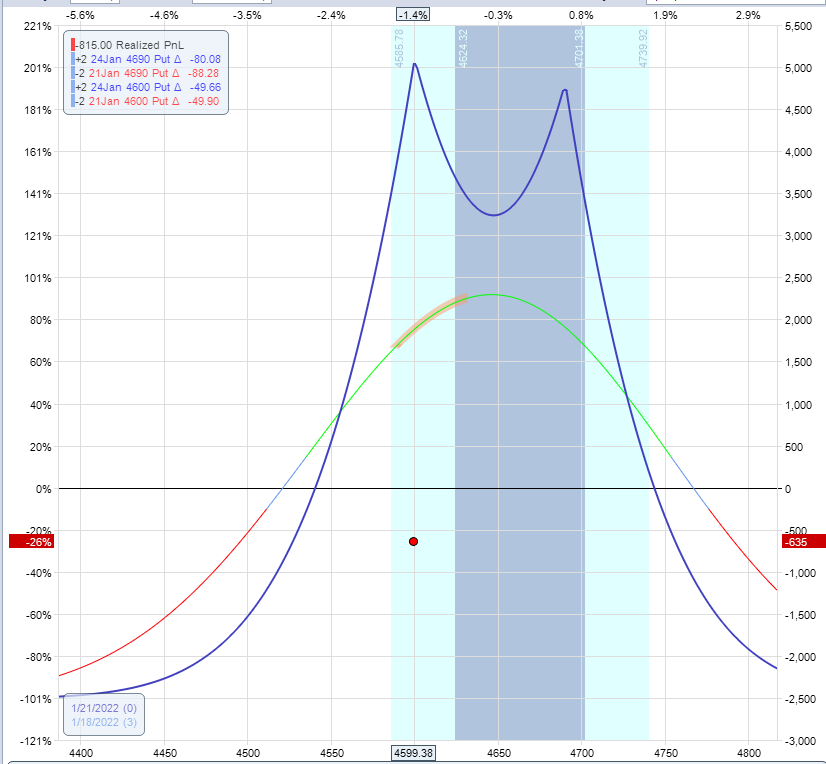
The price was at 4599, and the strike of the lower calendar was at 4600.
The Greeks are:
Delta: 16.70
Theta: 299
Vega: 303
Theta/Delta ratio: 17.9
If we take the upper calendar off, the Greeks would be:
Delta: 0.5
Theta: 298
Vega: 137
Theta/Delta ratio: 611
This adjustment would flatten our delta with very little reduction in theta.
Therefore, the trader takes the upper calendar off.
Date: January 18, 2022
Price: SPX @ 4599
Buy to close two January 21 SPX 4690 put @ $98.60
Sell to close two January 24 SPX 4690 put @ $101.80
Credit: $640
Now we are back to a single two-lot calendar:
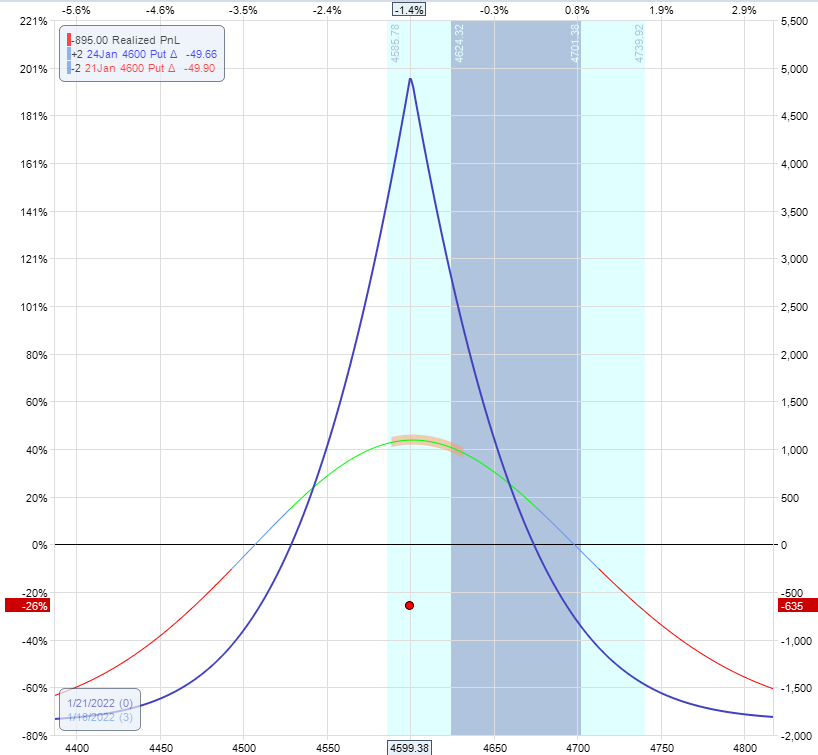
If the price starts moving off to the edge of the tent, we would have to make it into a double calendar again, provided there is still time left in the trade.
On the morning of January 20, there was only one day left till the expiration of the short option.
And the trade is down -$285, looking like this:
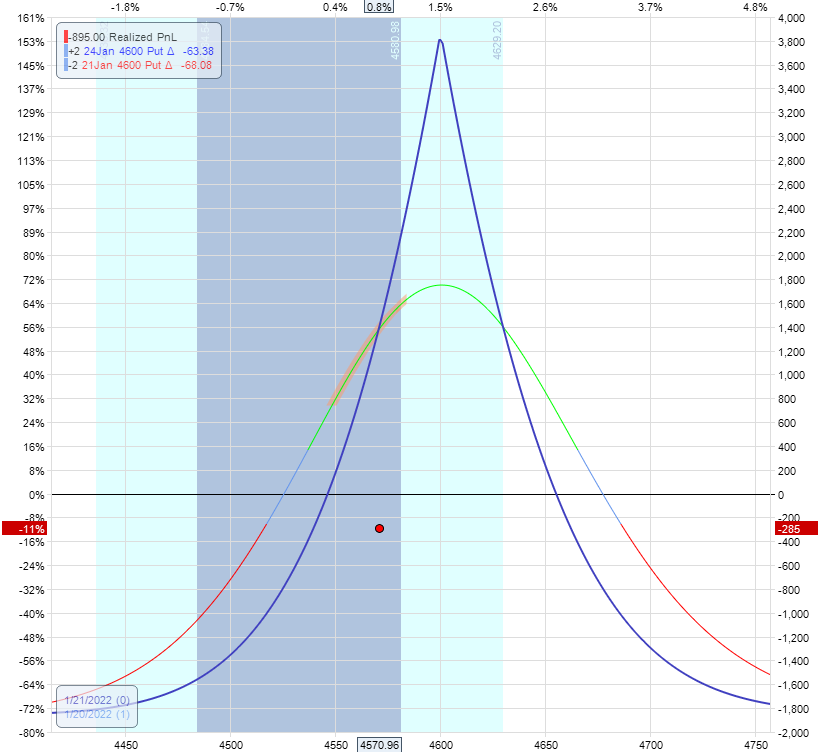
A trader could close that trade at this point and take the loss to avoid a larger loss.
Or the trader can day-trade it and watch the trade, hour by hour, to see if it moves back to the center or further away.
Or better yet, set a GTC order to exit the trade at breakeven.
At three hours into the day, that order would have triggered because the trade looked like this at some point:
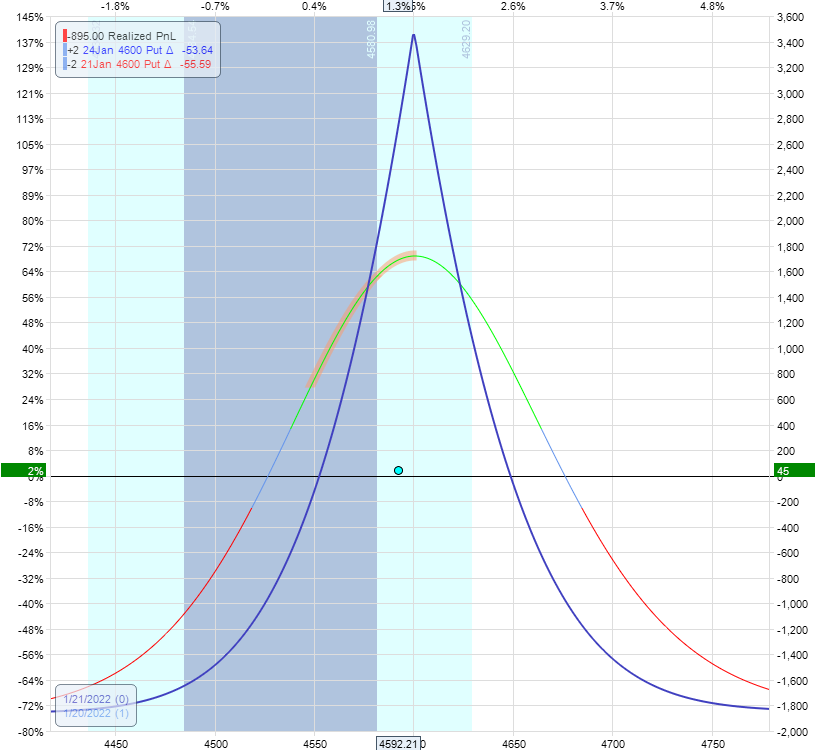
The price moved back into the tent’s center, and with a large theta of 1200 working, the trade came into positive P&L.
Time to exit at breakeven.
If the trader didn’t, the next morning, they would find the trade looking like this:
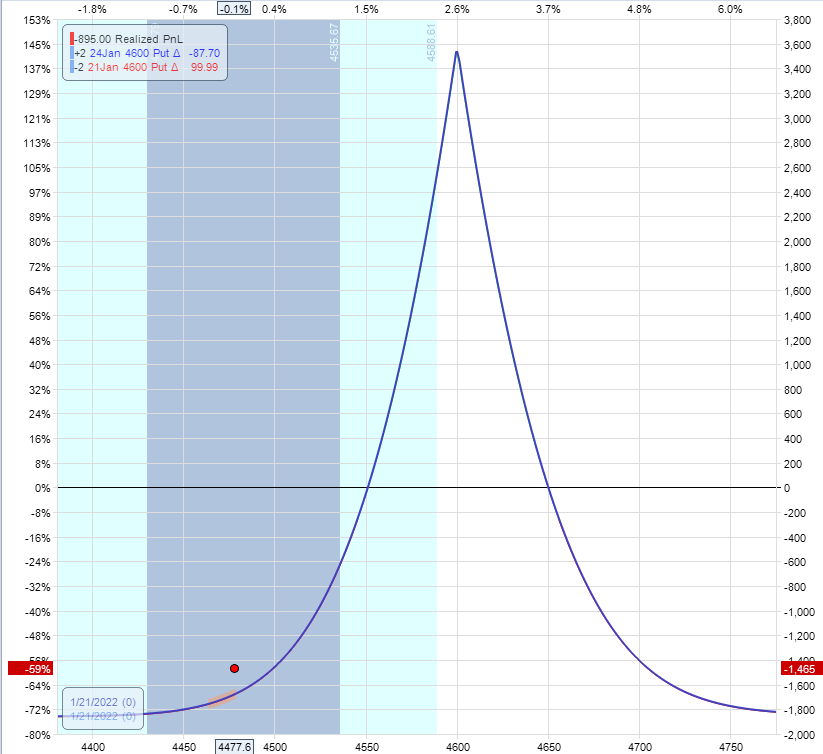
Frequently Asked Questions
How do you decide to add put or call calendars?
It doesn’t matter too much.
But most people prefer to use put calendars if they are adding them below the current price of the underlying.
And to use call calendars if they are adding them above the current price.
This way, the calendar that is being added is an out-of-the-money calendar.
Out-of-the-money strikes tend to have tighter bid/ask spreads because more people buy and sell out-of-the-money options than in-the-money options.
However, for liquid underlyings such as SPX, the difference is not that much.
What is the theory for the calendar swap adjustment?
Since this income trade makes money from positive theta, we want theta to be as high as possible.
We are removing the calendar that is losing the most money, which is the one furthest from the current price.
It is contributing very little theta to the overall trade.
The calendar that is closer to price is the one that provides the greatest theta contribution.
For calendars, the closer its strike price is to the current price, the greater theta you will get.
As the price moves away from the calendar, we lose theta.
We are removing the losing calendar and keeping the good one.
Conclusion
Wow. In this example, the trader got really lucky to have been able to exit at breakeven by monitoring the trade, hour by hour, on the day before expiration.
And the P&L and swing a thousand dollars in a single day.
One day at breakeven and the next day at -$1000 loss.
This is the nature when going close to expiration.
Not all traders would want to stay in this trade so close to expiration, nor have the time to monitor it on an hour-by-hour basis.
But to each their own.
We hope you enjoyed this article on the calendar and double calendar example.
If you have any questions, please send an email or leave a comment below.
Trade safe!
Disclaimer: The information above is for educational purposes only and should not be treated as investment advice. The strategy presented would not be suitable for investors who are not familiar with exchange traded options. Any readers interested in this strategy should do their own research and seek advice from a licensed financial adviser.


It doesn’t look like your example trade did very well. Calendars aren’t really long vega regardless of what the software says they are. More like roughly vega neutral. Calendars are much more successful in periods of backwardation than periods of low volatility. And a period of backwardation usually corresponds to a period of high volatility. Good post otherwise.
For me complex but I enjoy these because it challenges my education as I grow my experience. Keep them coming I learn something every time.
I follow your examples in IBD as well and it gives me daily ideas.
Thanks Joe, I appreciate the feedback.