
Of the many chart patterns, the head and shoulders chart pattern is probably one of the most complicated to master.
Just because it is complicated to master does not mean it’s impossible to trade.
Below, we will run through the Head and Shoulders pattern, how to spot it, and how to trade it. Let’s get started.
Contents
What Is The Head And Shoulders Pattern?
The head and shoulders are chart patterns that, when formed, may indicate that the price is ready to reverse.
This pattern is only seen on the termination of an uptrend and is characterized by three distinct peaks or tops: a higher peak (head) in the middle and two lower peaks (shoulders) on either side.
The other key component is the “neckline,” which is drawn by connecting the lowest two points between the peaks.
The neckline serves as a critical support level after it is formed.
Once the price breaks below this level, it can be traded as if it signals a new downtrend.
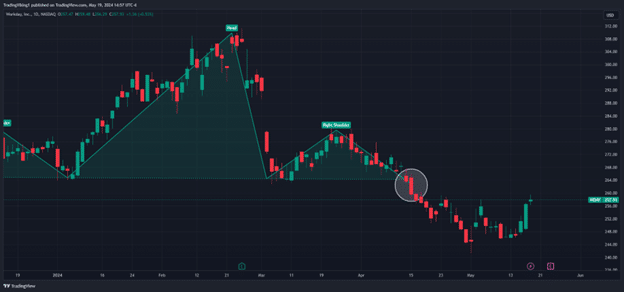
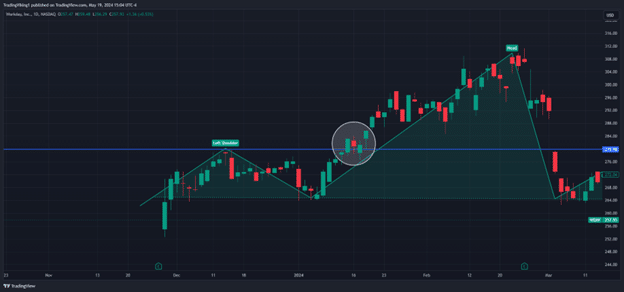
As an example, let’s take a look at Workday (WDAY) below:
As you can see, the price has been on an uptrend for several months heading into 2024.
It then dips and bounces around the $265 level to form the left shoulder.
The price then rallies into the highs around $310 before dropping back down to that $265 level after earnings.
This is a second test of that support level, which has now formed the head.
This is another bounce from $265ish before the price finally breaks down through it and starts to trade lower.
The head and shoulder formation would have been successfully set up on that last test of the support level (Neckline) at $265.
How To Spot The Head And Shoulders Pattern
Now that we have a basic understanding of the head and shoulder pattern let’s look at how we can spot it and then trade it.
First, you must identify stocks that have been in a sustained uptrend.
Since this is a reversal pattern, we need a trend to reverse.
Next is to look for the formation of the left shoulder. In the example above, it’s the place where the price has retraced to and bounced ($265 area).
Next, you look for the formation of the head.
The head is formed when the price resumes its upward trend and eventually falls back down to the bounce point.
This is also its trade, which will be discussed in the next section.
Lastly, we are looking for the formation of the right shoulder.
This shoulder is formed When the price once again bounces off the support level, but this bounce should exhaust someplace around where the left shoulder did.
With this, the formation of the head and shoulders is complete.
The last piece of information to tie this all together is the neckline.
Technically, you can draw the neckline at any point in the formation after the left shoulder is formed.
This is difficult this early on, though, as you have no idea if it’s a head and shoulder or just a bounce.
Many traders wait for the formation of the left shoulder and head to draw in the neckline support.
Waiting until this point does a few things: first, it confirms the neckline as a support level, and second, it sets up the rest of the trade and gives some time to plan an entry.
Pattern Spotting Tools
Several tools available now can help speed up the learning curve for spotting head and shoulders (or any chart pattern).
Sites like Trendspider and CMLViz made a name for themselves by being able to automatically detect chart patterns and let users scan through them.
In addition, free sites like FinViz have a section that lets users scan for technical patterns, and now even brokers are catching up with tools like Pattern Identification through ThinkorSwim.
While none of these options are foolproof, they are a great way to help find stocks matching chart patterns and help speed up the learning curve to spot them yourself.
How To Trade The Head And Shoulders Pattern
Now that we are all up to speed on the head and shoulders pattern and how to spot it, here are a few ways that you can trade it:
Breakout Trade
The breakout trade is the standard head and shoulders trade.
It is executed by waiting for the price to break below the neckline for the trade to be entered.
The stop loss of this trade is often set right above the most recent swing high (the right shoulder), and the profit target is the swing high on the head minus the swing high of the shoulder.
So, in the workday example, the entry would have been inside the white circle with a stop around $280 above the shoulder.
The profit target would be 30 points (The head of $310 – the right shoulder of $280).

The Bounce Trade
The second type of trade possible within the head and shoulder is the bounce trade.
This is a short trade looking to play the formation of the head.
The entry on this trade is when the price closes above the high of the left shoulder, and the stop loss is below the neckline.
In terms of profit, there are two main methods here:
The first is to take the distance from the neckline to the left shoulder and use that as the number of points to look for.
The second is to run a trailing stop to take the maximum amount of the move possible.

Options
The head and shoulder pattern lends itself to using options pretty well.
A regular put or call option could suffice if you take the breakout or bounce trade. As is usual with naked calls, though, theta decay works against you, and your move can be right, but your timing is wrong.
This makes vertical spreads, ratio spreads, and even more exotic spreads like the Zebra strategy more beneficial here.
Options are a great way to leverage our potential gain and cap your potential loss on these trades, assuming you buy/sell with enough time.
Concluding Thoughts
The head and shoulders pattern is a powerful trend reversal pattern that allows users to spot and trade bearish reversals with both a defined stop and a location for a take profit.
Learning to spot and trade them effectively can help boost profitability in stocks trending down or help keep you out of stocks that look bearish.
Utilizing options can be a great way to further leverage up the head and shoulders potential while keeping your risk defined.
Remember to keep your risk defined whether you’re trading the regular breakout trade or looking to catch the bounce trade.
These patterns are powerful but can always reverse on you.
We hope you enjoyed this article on the heads and shoulders chart pattern.
If you have any questions, please send an email or leave a comment below.
Trade safe!
Disclaimer: The information above is for educational purposes only and should not be treated as investment advice. The strategy presented would not be suitable for investors who are not familiar with exchange traded options. Any readers interested in this strategy should do their own research and seek advice from a licensed financial adviser.


