


CMLViz Pattern Finder is a new tool being introduced by Capital Market Laboratories, the same team that produced TradeMachine and CMLViz.com, which we had written about previously.
At the time of this writing, in early November 2022, Pattern Finder is still not listed as an officially released product on their website.
Still, I’m seeing the sneak peek videos appearing on their YouTube channel.
A couple of videos caught my eye:
They were both presented by Ophir Gottlieb, the CEO, and co-founder of Capital Market Laboratories.
Since he is a former options market maker and hedge fund manager, I naturally would want to see how he personally uses charts.
He believes a chart is a picture of market psychology in the short and medium term, but not the long term.
The chart also reflects all known information about the company, both past and present, including, but not limited to, fundamentals, product launches, news, earnings, and everything.
This is part of the Dow Theory that states that the “market discounts everything” due to the efficient market hypothesis.
However, just because all known information is reflected in the price does not mean we can see it.
Traders with trained eyes can probably see this information better than those with untrained eyes.
This is where Pattern Finder comes in.
It will draw things out on the chart so that you can see them.
Contents
- Support Resistance and Trendlines
- How He Finds Trades
- Drawing Tools
- Fundamentals And Technical Indicators
- Stock Screener
- Pattern Breakouts
- FAQs
- Conclusion
Support Resistance and Trendlines
Pattern Finder algorithmically draws horizontal support and resistance lines, and trendlines.
Here you see it turned on with the high/low pivot points indicated as well.
source: screenshot from YouTube video
The nice thing about the software drawing those lines for you is that it makes it objective.
When a trader draws a trendline, some subjectivity can be involved, consciously or subconsciously, due to trader bias.
How He Finds Trades
Ophir looks at the long-term charts first, then the medium-term, and then the shorter-term.
He doesn’t make decisions based on the long-term chart.
As long as there is no glaring warning, he continues to lower timeframes to look for trades. What is considered long-term and what is short-term is personal style.
Ophir likes to always turn on support/resistance and trendlines, and he likes looking at the relative strength of a company compared to the market or industry, as well as the RSI.
Drawing Tools
One important point that he stressed in the video is you got to write down explicitly the plan for the trade — where are you getting in and where are you getting out?
It should not be just in your head.
It has to be written down, so you do not make trade decisions based on your current moment’s emotions.
He says, “If you trade with poor emotions, then the market psychology will make you bankrupt.”
Once he finds a potential trade, he uses Pattern Finder’s drawing tools to draw manually in his loss zone and profit zone as rectangles.
These represent when to stop out or take profit.
This gives him a visual view of his risk to reward.
The nice thing about these rectangles is that they mark the same price values even when you switch to different timeframes.
This enables you to see in multiple time frames how much room the stock can go up before hitting resistance.
Fundamentals And Technical Indicators
Like any charting software, you can put on various technical indicators such as RSI, Bollinger Bands, MACD, and a few others.
Of course, there are the ever-popular moving averages.
Pattern Finder also has Fibonacci.
Besides technical data, Pattern Finder provides fundamental data such as revenue, relative strength, EPS, etc.
There is also real-time market news related to the company and the latest earning report numbers.
Stock Screener
The stock screener that is built into Pattern Finder will scan for stock meeting your criteria.
Some criteria you can set include market cap, cash flow, revenue, growth rates, relative strength to its industry, price change, and other metrics that you would expect in a screener.
It even has a few proprietary ratings, such as the “buying selling strength rating,” EPS rating, and overall rating.
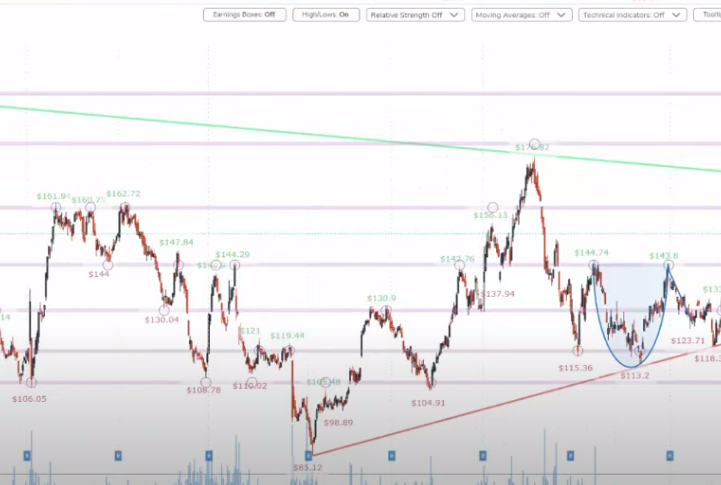
Pattern Breakouts
The Pattern Breakouts feature will scan for stocks with certain chart pattern forming.
These may be patterns such as the cup and handle pattern, descending bases, double bottoms, and so on.
Here you see that Pattern Finder had found a cup and handle chart formation sitting on the support line.
FAQs
Is there a discount for TradeMachine members?
Subscribers of TradeMachine can get Pattern Finder at a discounted rate.
The two products work well together.
For example, suppose TradeMachine’s “Today” tab shows you several signals.
Now you can go into Pattern Finder to look at the technical analysis of each of those signals to decide which ones to take.
Can you set alerts in Pattern Finder?
Yes, you can set alerts, such as when the price crosses the 50-day moving average, etc.
Can you chat with other Pattern Finder members?
Yes, anyone who joins Pattern Finder will be a member of the Capital Market Laboratory web community room, which is the same room as the TradeMachine members.
What is the difference between relative strength and RSI?
I admit that this is quite confusing because Ophir likes to use both and mentions both.
But they are not the same.
Relative strength (RS) tells you how strong the company is in relation to its industry or market over a given timeframe (say, three months or a year).
RSI (Relative Strength Index) is a momentum indicator.
It is a mathematical calculation based solely on the values of past prices over a given timeframe (typically 14 days).
It suggests to the trader how strong the prices are being bid up or down and whether the current price is “overbought” or “oversold.”
Conclusion
Pattern Finder is a subscription-based charting/scanning platform that will speed up your technical analysis by objectively and algorithmically drawing in support/resistance and trendlines.
Those who enjoy Capital Markets Laboratory’s existing product, TradeMachine, will likely enjoy their latest product, Pattern Finder.
We hope you enjoyed this article on the CMLViz Pattern Finder.
If you have any questions, please send an email or leave a comment below.
Trade safe!
Disclaimer: The information above is for educational purposes only and should not be treated as investment advice. The strategy presented would not be suitable for investors who are not familiar with exchange traded options. Any readers interested in this strategy should do their own research and seek advice from a licensed financial adviser.


Hi how does it compare to thinkorswim charting and technical indicators which is free? Thanks.
You can use CMLViz to do advanced backtesting of options strategies.