


Contents
- Break-Even Calculation
- When To Initiate The Put Ratio Spread
- Example 1: Close With A Credit
- The Greeks
- Example 2: Acquiring The Stock
- Define The Risk With The Broken Wing Butterfly
- Rolling
- Conclusion
The put ratio spread is a strategy that some investors use to acquire stocks at a discount.
The discount is greater than that of using a cash-secured put because the put ratio spread is a short put combined with a debit put spread that picks up additional profits as the price comes down to the short put.
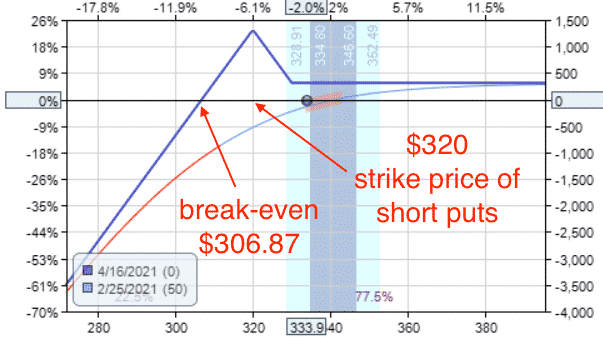
Here is an example of a put ratio spread on Costco (COST):
Date: Feb 25, 2021
Price: COST @ $333.90
Buy one Apr 16th COST $330 put at $11.525
Sell two Apr 16th COST $320 puts at $7.325
Credit: $312.50
We are buying one put either at-the-money or slightly out-of-the-money. And we are selling two puts further out-of-the-money.
We like to structure the trade for an initial credit — not just a slight credit, but a good enough credit to take home if the price of the underlying goes up.
All option legs expire at the same expiry which is anywhere between 25 days to 60 days out (preferably on a monthly expiration cycle).
The risk graph looks like this…
If the price goes down past the strike price of our short puts at expiration, then we will need to purchase the stock at the stock price.
Make sure you have enough cash on reserve to make the purchase.
If we are doing a one-by-two ratio spread where we are buying one put and selling two puts, we only will be assigned on one of the puts.
The other short put would be cashed settled by the long put.
This can be more clearly seen if we decompose the put ratio spread into a debit spread and a short put.
Debit spread:
Buy one Apr 16th COST $330 put
Sell one Apr 16th COST $320 put
Short put:
Sell one Apr 1st COST $320 put
It is this short put that you can be assigned on.
Break-Even Calculation
Look at the break-even point on the risk graph, it is way below the short strikes.
So, the stock can continue to fall below our strike price to a certain extent before we are at a loss.
The exact break-even point is calculated by the short strike price minus the max reward of the put debit spread, and then minus the initial credit received.
In our example, the numbers are…
Break-even = $320 – $10 – $3.13 = $306.87
The wider the distance between your strikes and the larger the initial credit that you can get, then the lower your break-even point can be.
As you widen the distance between your strikes, the break-even point will get lower and lower (which is good).
But your initial credit will be less and less (which is not so good).
At some point, the distance between the two strikes is so far apart that you don’t get a credit at all.
Find a balance where you can widen the distance between the strikes and still get a decent credit.
When To Initiate The Put Ratio Spread
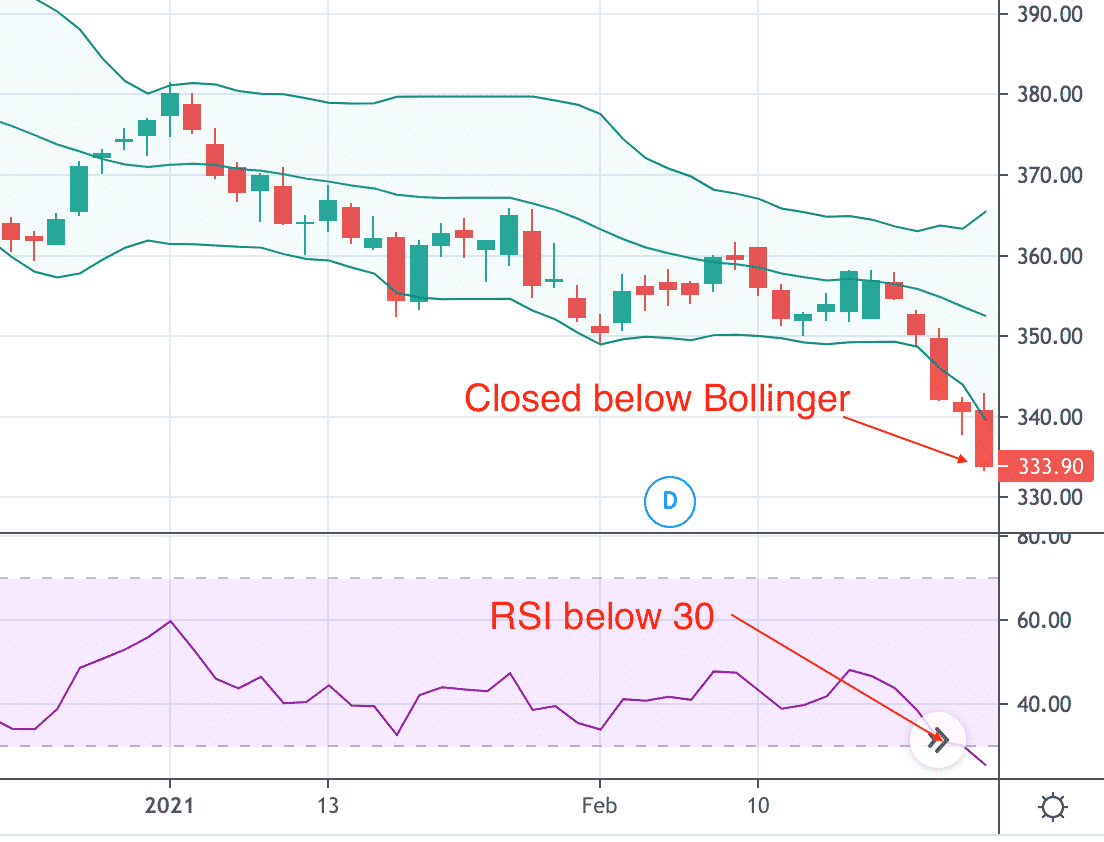
A good time to initiate the put ratio spread is when the price has already been dropping due to either temporary bad news or market sell-off.
A price extreme is indicated when RSI is oversold (RSI < 30). Keep in mind that a stock can remain in oversold territory for some time.
A more conservative investor might wait for the RSI to start coming out of oversold before putting on the trade.
A more aggressive investor who wants to get in early and is willing to sit through some negative P&L may want to initiate the trade anytime RSI shows oversold.
In our example, the investor initiated the put ratio spread when COST had RSI below 30 and it closed below its lower Bollinger Band.
The investor does not use a stop loss because the investor is planning to acquire the stock.
If, however, the stock price goes up and it doesn’t look like the short puts are going to be assigned, then the investor takes the profit if the entire trade shows a profit equal to the credit received or thereabouts.
That means the investor closes the entire trade if it can be done for a credit, or perhaps a small debit.
But the debit must be significantly smaller than our initial credit.
Example 1: Close With A Credit
Targeting for a profit of $300, let’s see how the COST trade turns out.
On March 17th, COST is showing a profit of $307.50
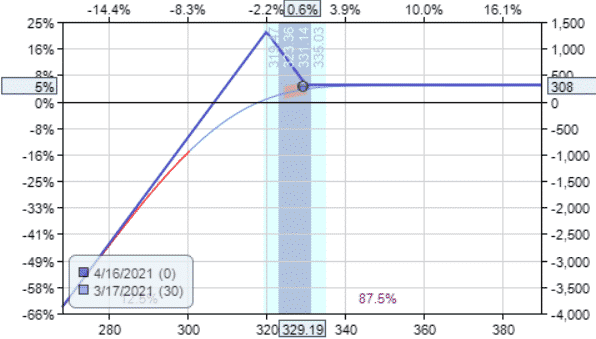
So, the investor closes the trade by paying a small debit of $5:
Date: March 17
Buy to close two Apr 16th COST $320 puts at $4.225
Sell to close one Apr 16th COST $330 put at $8.40
Debit: $5
The total credit received out of this trade is:
$312.50 – $5 = $307.50
Here we see that the investor ended up with a profit of $308 in the trade.
The investor did not get assigned on the stock because COST bounced back from its oversold condition.
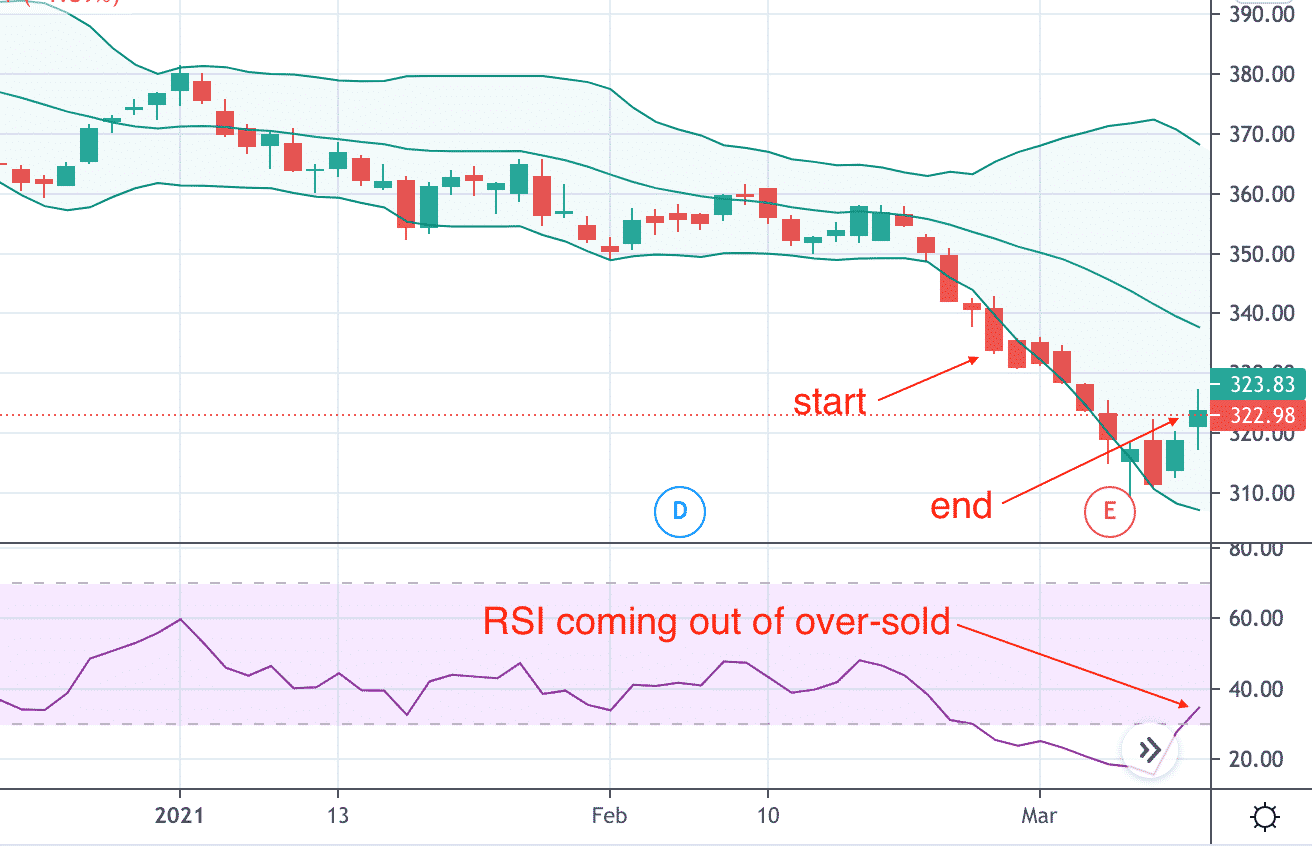
The stock had stayed in over-sold condition for about nine days. And the trade also lasted nine days.
The Greeks
Now let’s look at the Greeks for COST put ratio spread.
Delta: 21
Vega: -40
Theta: 12
Note that the stock went down in price and the investor is still profitable.
While delta indicates that the strategy prefers for the price to go up.
The strategy is also short vega and has positive theta.
That means that it benefits if volatility drops and as time passes.
Since we are net sellers of options in this strategy, it is good to place this strategy in higher implied volatility environments.
Example 2: Acquiring The Stock
In this next example, we show a case where the investor ends up acquiring the stock.
Date: Dec 17, 2020
Price: LULU at $386.07
Buy one Jan 15 LULU $380 put at $14.125
Sell two Jan 15 LULU $370 puts at $10.325
Credit: $652.50
Break-even: $353.47
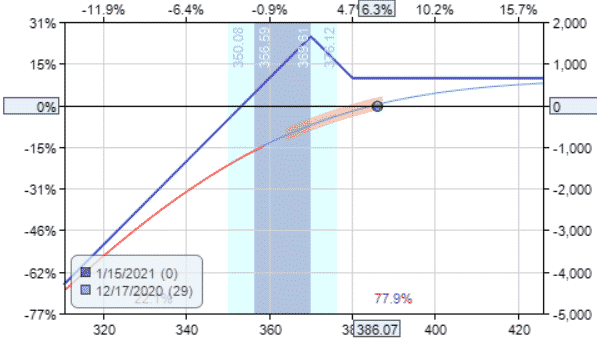
When an investor initiates such a trade, the investor is willing to purchase 100 shares of LULU at $370.
Looking at the end-of-day data, the profit never reached our target of $650.

On January 15, 2021, LULU closed at $344.50 and the investor is assigned 100 shares of LULU stock at the price of $370.
The investor also receives a credit of $1000 from the put debit spread which had reached maximum profit.
Due to the options structure, whenever the short put is assigned, the embedded debit spread will be at maximum profit.
Adding the initial credit of $652.50 plus $1000 from the debit spread, the investor had received a total of $1652.50 in order to purchase 100 shares of LULU at $370.
You can think of it as a 4.5% discount for buying the stock:
$1652.50 / $37000 = 4.5%
Unfortunately, the price of LULU keeps dropping after the short strike was reached.
At end of the expiration day on January 15, the net loss to the investor is:
($344.50 – $370) x 100 + $1652.50 = –$897.50
In comparison, if another investor had purchased straight 100 shares of LULU at $370, that investor would have lost significantly more:
($344.50 – $370) x 100 = –$2550
The Greeks for the LULU put ratio spread are:
Delta: 10.84
Vega: -13
Theta: 8.27
These trades profit when the price goes up. Similar to iron condors, they are short vega and don’t do well when volatility spikes up.
Because they have positive theta, the investor can let the strategy sit and wait. The longer the wait, the more money made as the days pass (assuming all other factors being equal).
Define The Risk With The Broken Wing Butterfly
The put ratio spread is an undefined risk strategy.
However, if an investor wants to define the risk, the investor can add an additional put and the trade becomes a broken wing butterfly:
Date: Dec 17, 2020
Price: LULU at $386.07
Buy one Jan 15 LULU $340 put at $2.70
Sell two Jan 15 LULU $370 puts at $10.325
Buy one Jan 15 LULU $380 put at $14.125
Credit: $382.50
Break-even: $356.18
Max Risk: $1617.50
Here the max risk is capped at $1617.50. Let’s see how this trade does. Setting a mental take profit level of $380.
The take profit level was not achieved.
On Jan 15 expiration day when LULU closed at $344.50, the investor is assigned 100 shares of LULU at a price of $370 and plus received a credit of $1000 from the put debit spread just as with the put ratio spread.
The $340 long put was never used because the price was not below $340 at expiration.
The net loss to the investor is…
($344.50 – $370) x 100 + $1382.50 = –$1167.50
This investor lost $270 more than the put ratio investor because that was the cost of buying the protective put which ended up not being used.
Rolling
For an investor who does not want to be assigned on the stock, one technique is to roll one of the short strikes further out in time whenever the price reaches the short strike.
Roll only if it can be done for a credit. Don’t roll if it has to be done for a debit; otherwise, you would be increasing the risk in the trade.
Taking the same LULU trade as an example, the short strike is hit on December 22nd, whereupon the investor rolls one of the short puts.
Date: December 22nd, 2020
Buy to close one Jan 15 LULU $370 put at $20.475
Sell to open one Feb 19 LULU $370 put at $27.50
Credit: $702.50
After the adjustment, we get a curvy but still upward sloping risk graph that looks like this…
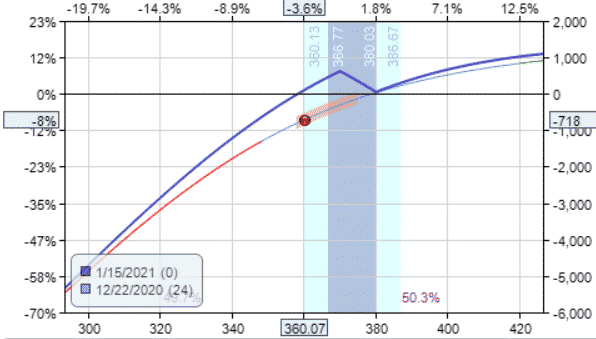
It is still short vega and positive theta.
The profit target of $650 was never reached.
On January 15 expiration day when LULU closed at $344.50, the put debit spread achieved maximum profit of $1000 which is credited to the investor’s account.
There is no stock assignment. The remaining short put with Feb 19 expiration can be closed by buying it back for $3205.
In the end, the investor lost around $850 thereabouts depending on the fills of the multiple transactions.
It is calculated by:
initial credit + credit from roll + max profit of debit spread – cost to close in-the-money short put:
$652.50 + $702.50 + $1000 – $3205 = –$850
Making this adjustment in this case did not change the bottom line by much.
Nevertheless, the roll technique is useful if the investor does not want to acquire the stock, or if the investor believes the stock may reverse back up if given more time.
Conclusion
The put ratio spread is a strategy that an investor can use to acquire quality stocks that they want to own.
If the price of the underlying goes down, the investor acquires the stock at a discount.
If the price of the underlying goes up, the investor receives a small profit. It is a win-win situation.
Some good candidates for this strategy are Dow stocks that have already sold off with an RSI less than 30 and/or with price closing at the lower Bollinger Band.
Most of the time under normal market conditions, the stock will come out of oversold condition and the put ratio spread will end up in profit.
Just make sure to put enough days till expiration in the ratio spread for this to happen.
While waiting, the theta decay is picking up a little bit of profit each day.
Trade safe!
Disclaimer: The information above is for educational purposes only and should not be treated as investment advice. The strategy presented would not be suitable for investors who are not familiar with exchange traded options. Any readers interested in this strategy should do their own research and seek advice from a licensed financial adviser.


