


Today we’re talking about how to identify support and resistance levels.
This is a large topic, and there are many ways to do it.
Unfortunately, there is no one simple mechanical formula that one can apply.
It is a bit of art.
You may not get an identical answer if you ask several traders to draw support and resistance on an identical chart.
This implies a bit of subjectivity and interpretation in drawing support and resistance.
However, most experienced traders will come up with very similar obvious support and resistance lines.
These are the lines you want on your chart.
You want your lines to be what most other traders see.
You don’t want a line that only you can see.
Contents
Introduction
Support and resistance work best when everyone sees the same zones, which causes the price to react at that zone.
Support and resistance are not exactly lines.
They are zones. Sometimes, we draw them as a line as a simplification.
While seeing the support and resistance zone comes only with practice and a lot of screen time, we will provide some tips on spotting them in this article.
Trading Range
The easiest support and resistance to spot is when the price is in a trading range, as in this daily chart of Boeing (BA) in early 2023.
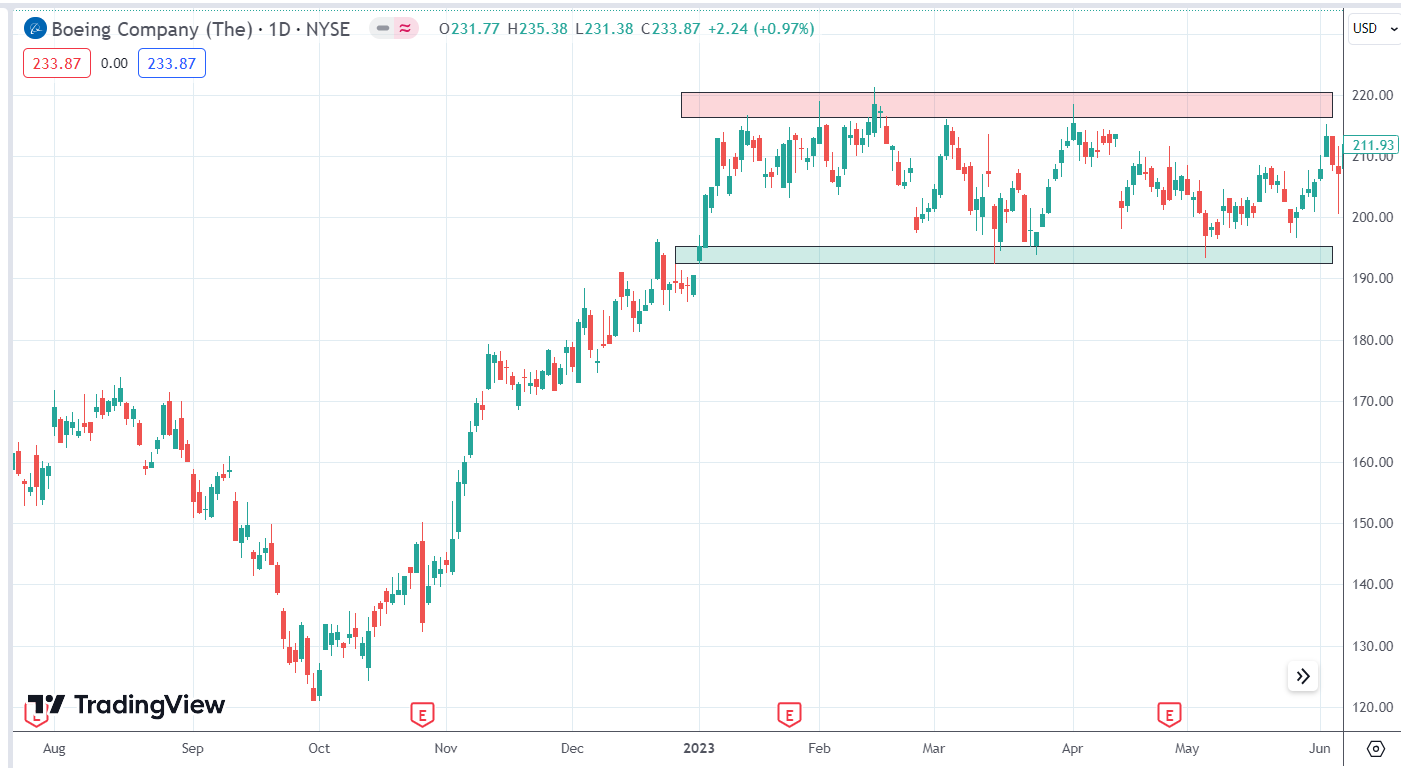
The top of the trading range represents resistance (indicated by the red zone).
The bottom of the trading range represents support (indicated by the green zone).
Stock tends to go into trading ranges after a big move.
See that Boeing rallied up from its October low.
It stopped going higher after reaching the $220 level.
This is the formation of the resistance.
It started to pull back but did not drop below $195, forming support.
Double Tops
Double tops form resistance, as in the case of Coinbase (COIN).
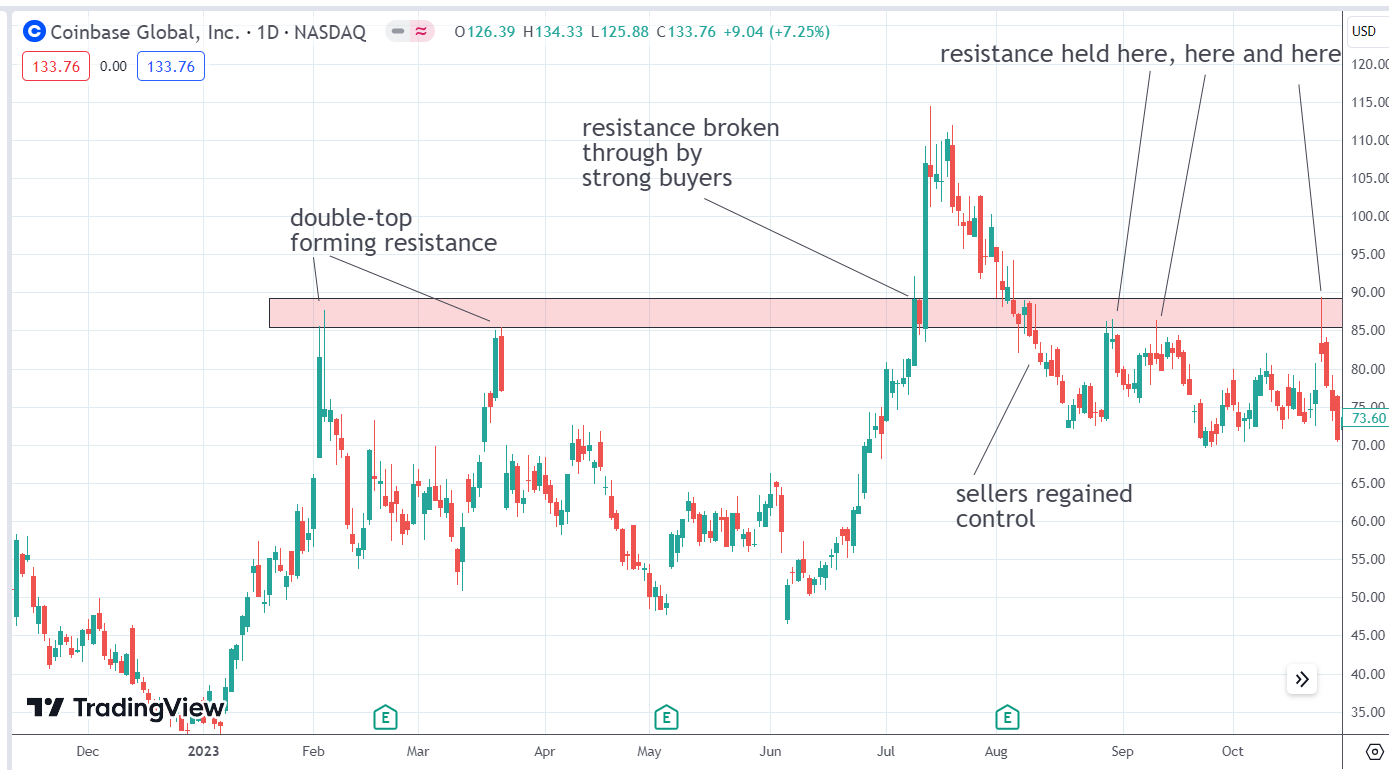
That is not to say that resistance cannot be broken through.
But if it does break, then it requires very strong buyers to do it.
In July, those strong bulls came.
Look at that large green candle.
The buyers were only slowed down slightly by one red candle as it passed through the zone.
However, the sellers subsequently regained control, pushing the price back below the resistance zone.
The resistance was able to hold the later three attempts to break above it.
The candlesticks tell a story.
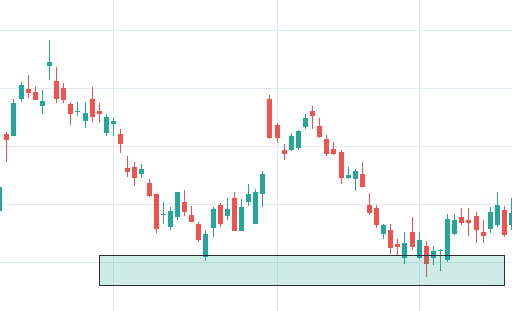
Double Bottom
Similarly, a double bottom forms support:
Multiple Wick Price Rejection
The wicks of the candles are very telling.
Take a look at this one-hour candlestick chart of Apple (AAPL).
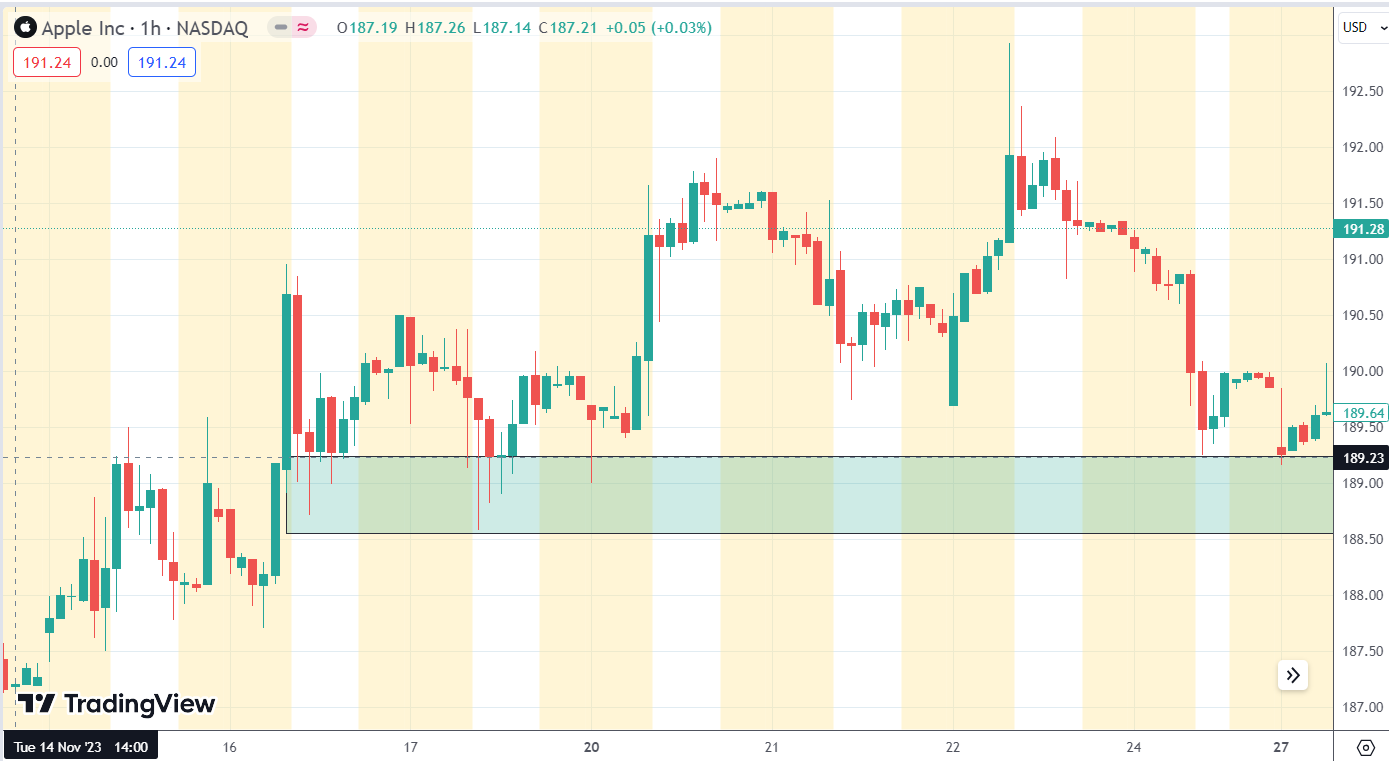
We see multiple bottom-tail candles on November 16 and 17.
This indicates that the price could not go below the price level of $189.20.
Because every time the price goes below that level, the price is rejected and has to come back up above that level.
This is what forms the wicks.
So, we can draw a support zone at that level, as shown.
Price went away from that level.
On November 27, it returned to that support level zone:
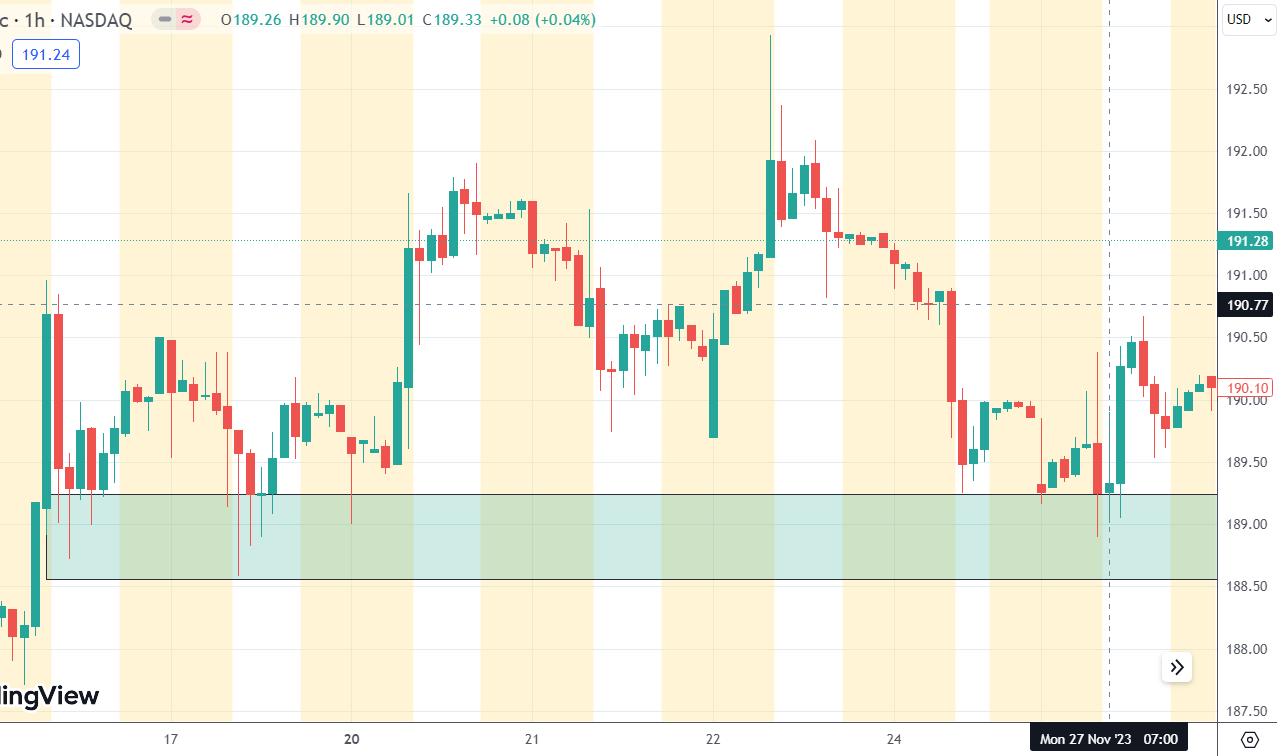
A trader aware of the price returning to this support zone will go down to a lower timeframe chart (say the 5-minute chart) to see if there is a trade setup to buy.
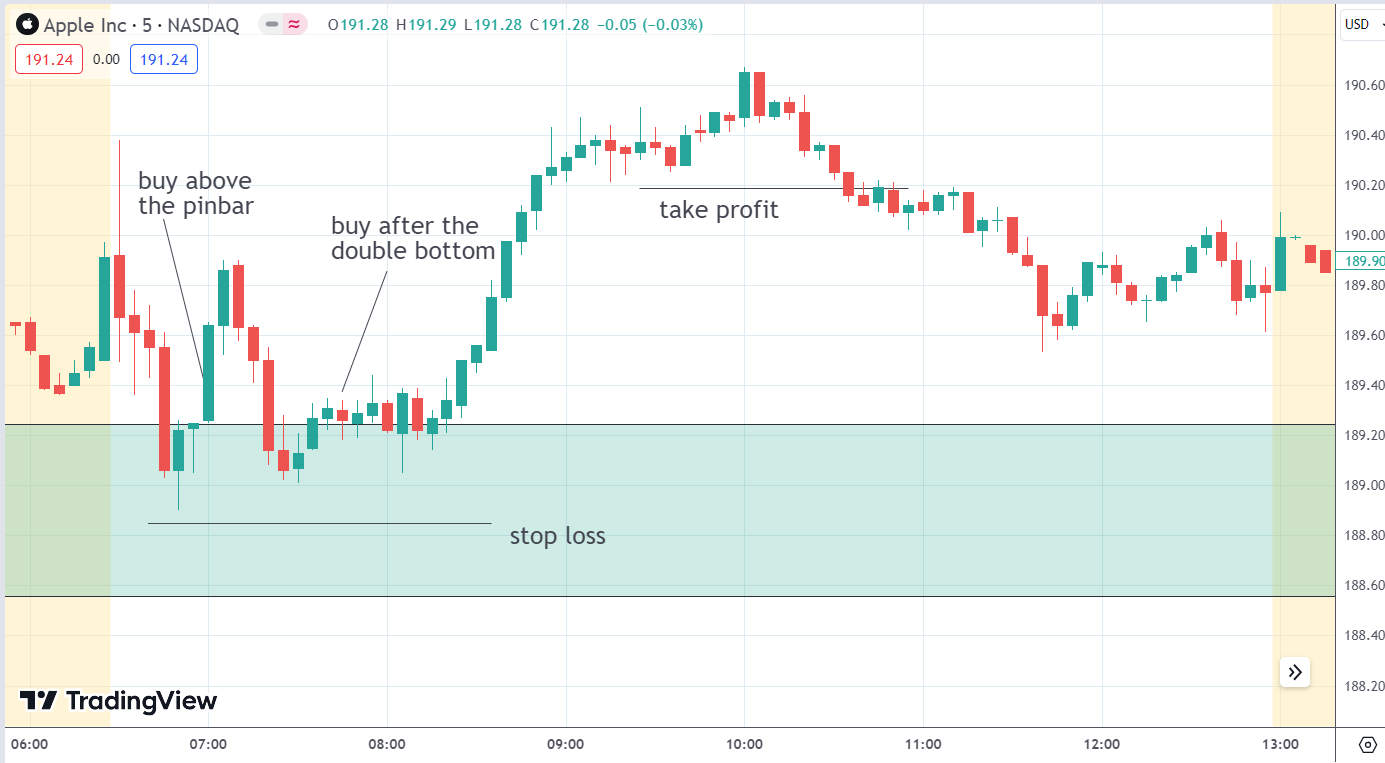
The price dips into the support zone and then reverses up.
After seeing the bottoming pin bar, a trader could have bought stock for a long trade.
Or perhaps after seeing the double bottom form.
Depending on how they manage the trade, either with a fixed price target, trailing a stop, or scaling out with partial take profits, they could potentially capture price appreciation up to the $190 level with a potential 2-to-1 reward-to-risk.
Support And Resistance On Multiple Timeframes
Support and resistance can be found in any timeframe. Here is a 15-minute chart of Disney (DIS).
A clue for finding support is to look for where a large upward move came from.
The support zone is where buyers live.
So, it makes sense that a large up move may emanate from a support zone.
Similarly, the resistance zone is where sellers live.
If you see a large down move, see if it came from a resistance zone.
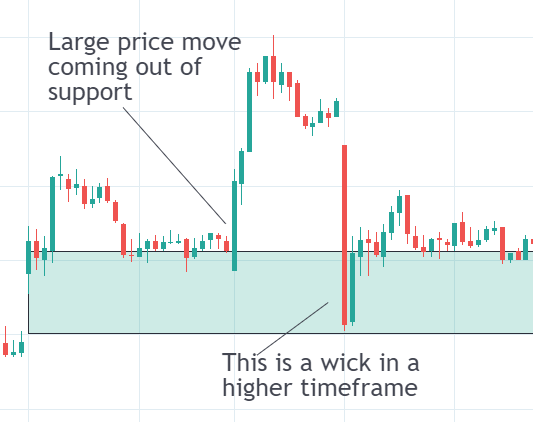
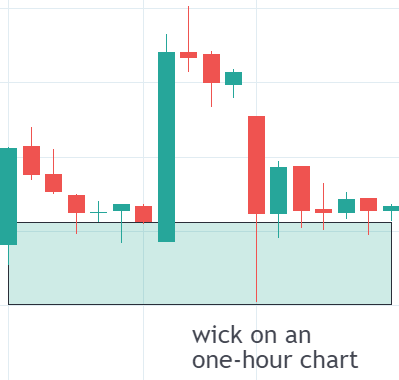
We have seen that wicks represent price rejection and can clue us in on support and resistance zones.
In the above, we see price rejection as a two-candle pattern.
We see a full-bodied red candle followed by a full-bodied green candle.
Price made a 180-degree U-turn.
Instead of two candles in this 15-minute timeframe, this would be a candle wick in a higher one-hour timeframe, as you can see here:
Support Becomes Resistance
An important concept is that support can often become resistance.
Here, the price formed a double bottom at support.
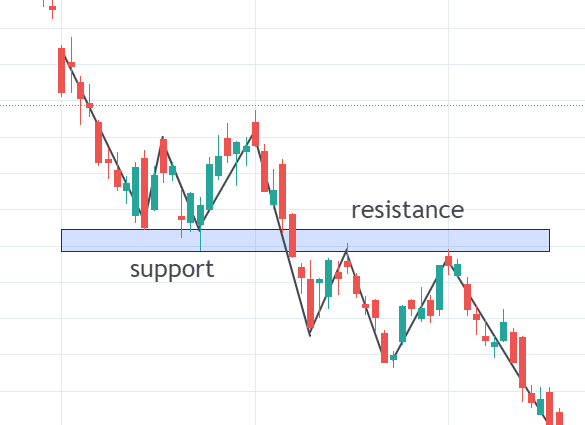
Then, the price broke down through that support zone with a series of strong red candles.
Once that zone has been broken, that same zone becomes the resistance.
And we see the price hit its head on that resistance zone twice before proceeding down.
Why would the zone flip?
It flipped because there was a flip in who was in control.
At first, buyers were in control, holding the price above support.
When sellers became strong enough, it broke through that zone.
The fact that it broke through that zone indicates that sellers are strong in that zone now.
So when the price came back up to that zone, the strong sellers could push it back down.
Resistance Becomes Support
In an uptrend with higher highs and higher lows, we see that resistance becomes support, as in this daily Shopify (SHOP) chart.
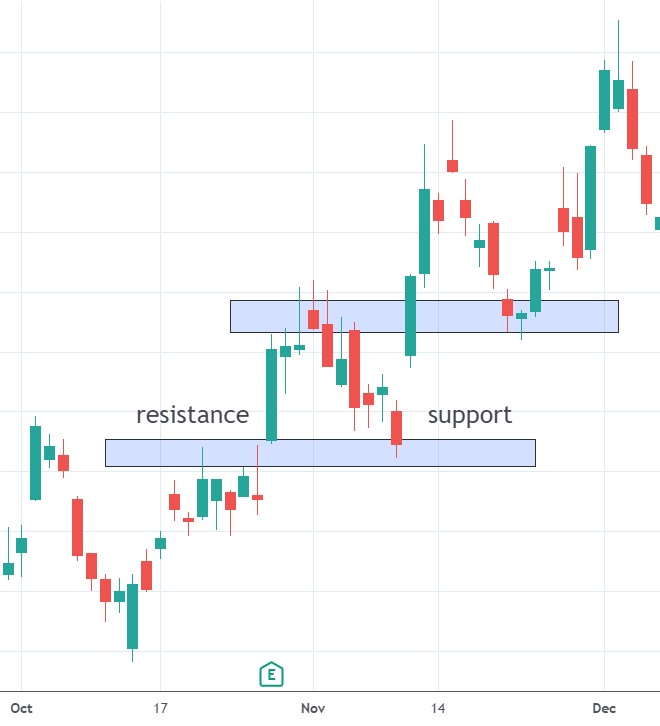
An earning report catalyst broke the resistance.
Using The Volume Profile To Find Support Resistance
As a review of the points learned.
See if you can spot the support and resistance levels on this one-hour candlestick chart of Roku (ROKU).
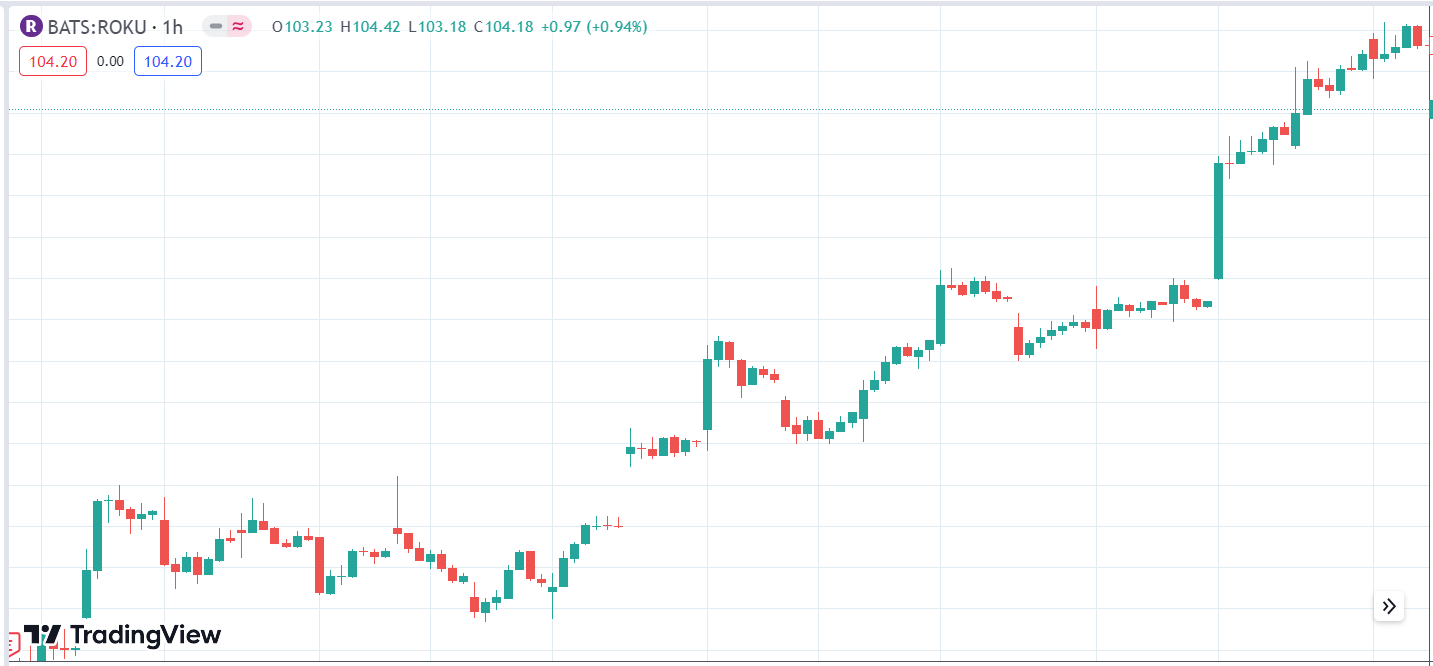
Here is what I have:
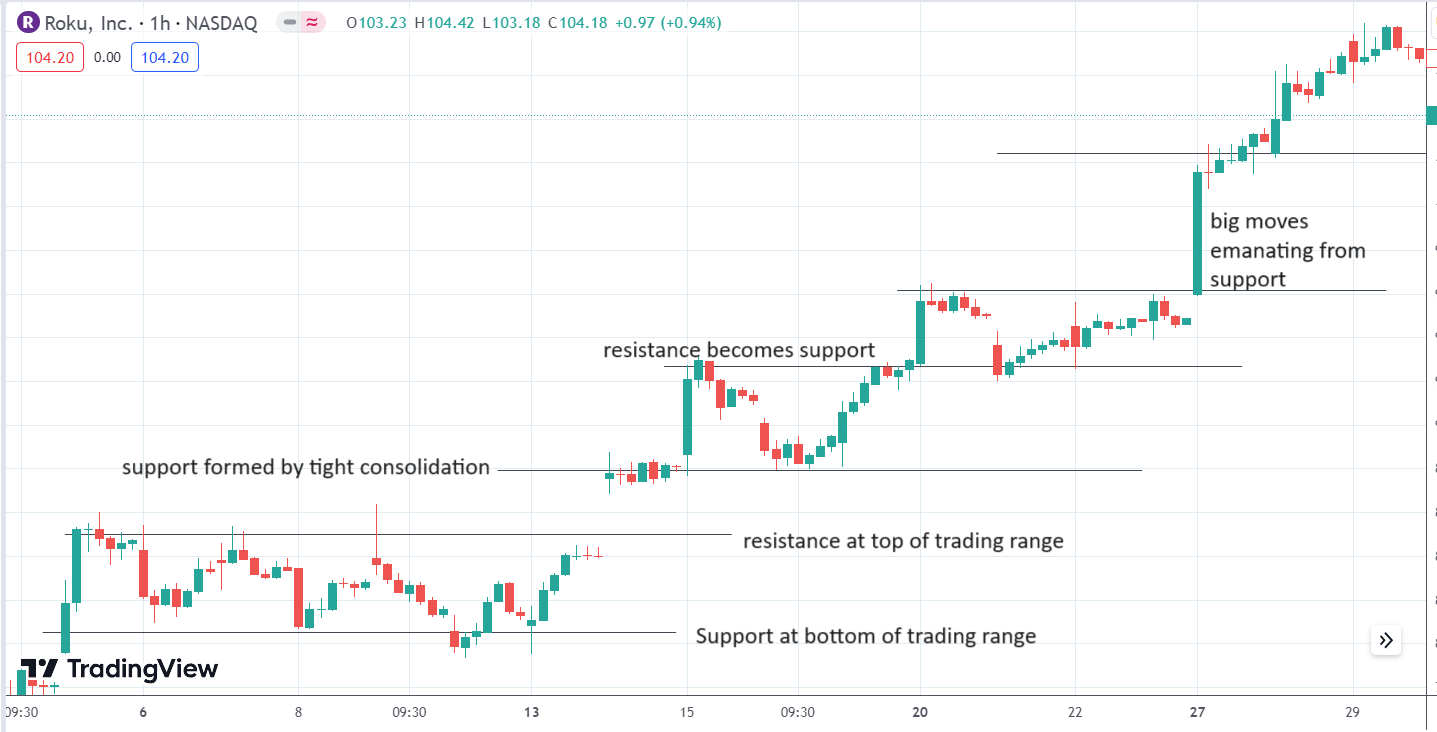
Why is support and resistance important?
Having these lines on the chart lets us know where the price might stop.
And where it might reverse.
As we advance the chart, we see Roku can not go up further.
It pulls back, but where will it pull back to before possibly going up again?
At a support level:
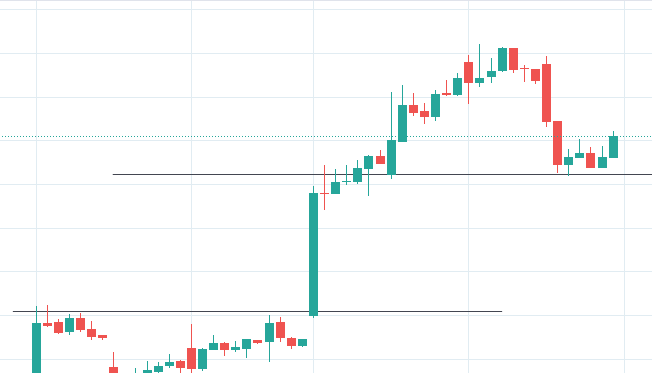
Nothing is 100% for sure.
There is a possibility that it might break through that support level.
If it does, where might it go?
To the next support level below.
Using The Volume Profile Tool
Pretend that we have no knowledge of that pullback and that this is all the chart that we have so far:
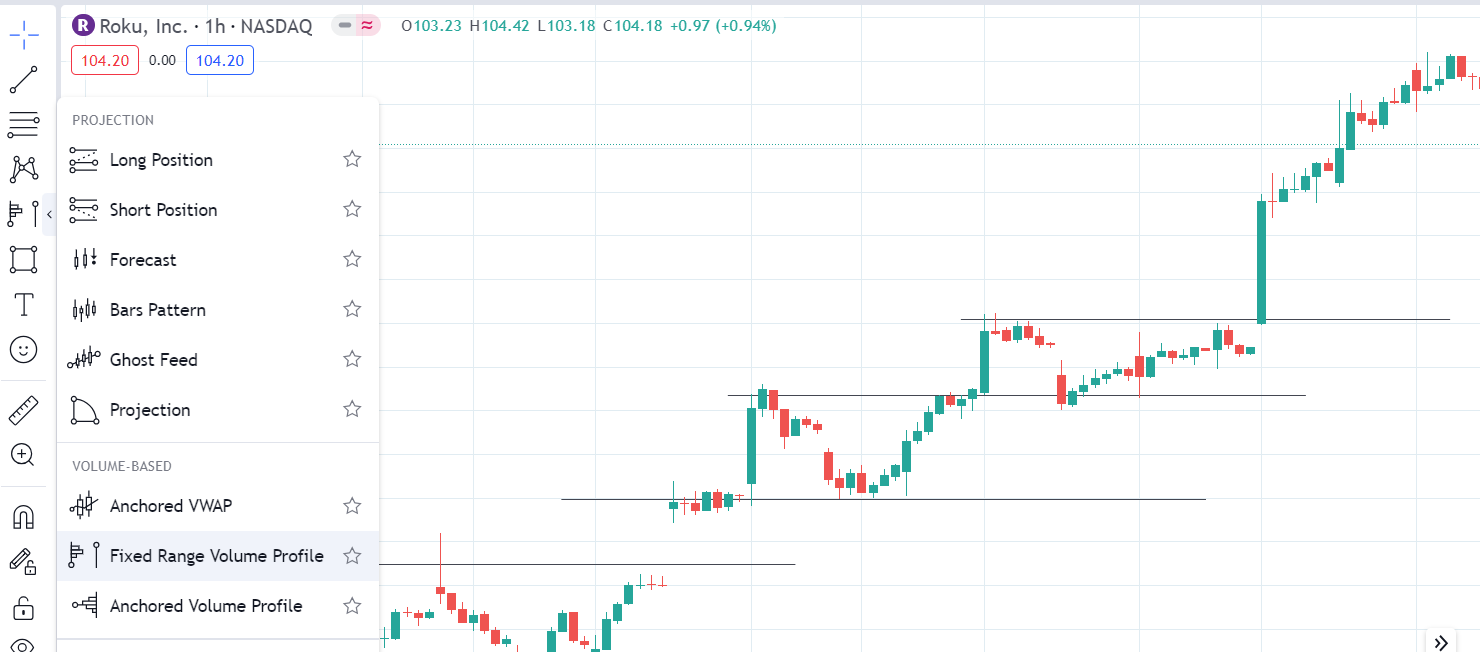
We pull out the “Fixed Range Volume Profile” tool in TradingView (or an equivalent tool in other charting platforms).
Then drag the volume profile from the start of the impulse move to the top of the move like this:
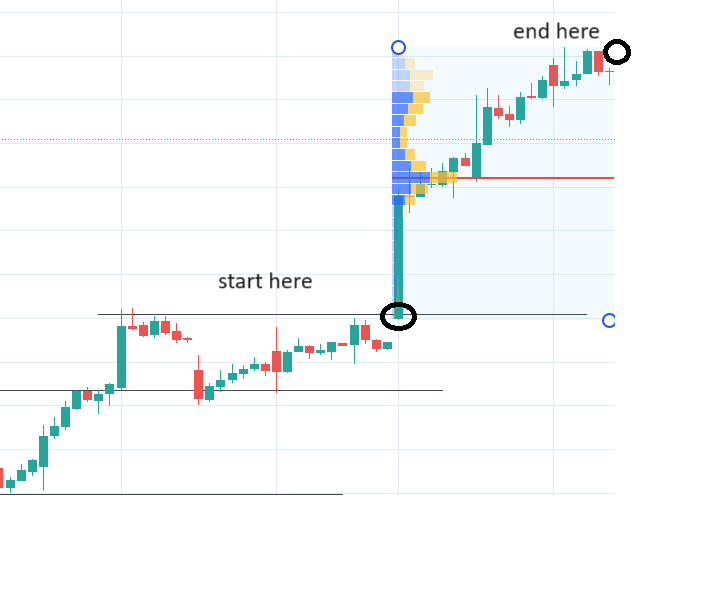 The volume profile shows a red line, which is the “point of control,” or POC.
In that upward movement, the price at which buyers and sellers transact most shares is at the level of that red line.
Because this is such a heavily traded price, this is where a support and resistance line can be drawn.
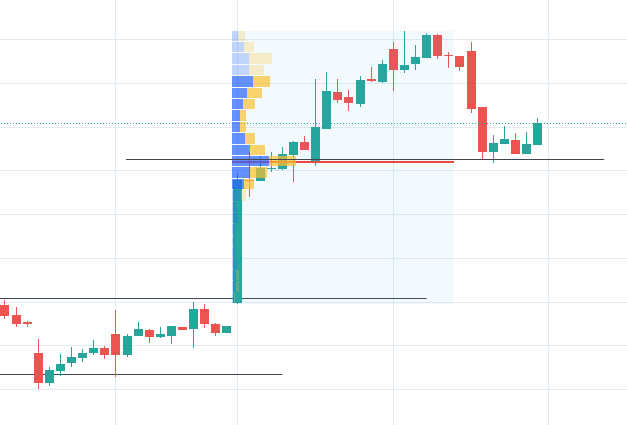
And you see the price pull back to stop almost exactly at that point.
I’m not saying it always will work out this nicely.
Nothing ever does in trading. But this is a good example of when it works.
Conclusion
Price tends to move from one level to another level.
It likes to stay at a certain level for some before deciding to move to the next level up or down.
It is like a person living in a multi-floor house who stays in the first-floor living room for a while before climbing to the second floor and sleeps for eight hours before returning to the first floor.
It is not normal for a person to stay too long halfway between the floors in the middle of the stairs because that would be weird, like this analogy.
We hope you enjoyed this article on how to identify support and resistance levels.
If you have any questions, please send a message or leave a comment below.
Trade safe!
Disclaimer: The information above is for educational purposes only and should not be treated as investment advice. The strategy presented would not be suitable for investors who are not familiar with exchange traded options. Any readers interested in this strategy should do their own research and seek advice from a licensed financial adviser.


Great Gavin………..your work is superb.
Thanks Mike, I appreciate it.