


Welcome to our article on the fundamentals of support and resistance in trading.
As a trader, you must have come across these terms before, but understanding their underlying principles and why they work is essential to making informed trading decisions.
In this article, we will delve deeper into the concepts of support and resistance and explore how they can help you identify potential trading opportunities and manage your risk effectively.
So, let’s get started and build a strong foundation in these critical aspects of trading.
Contents
- Support And Resistance Are Memories Of The Market
- An Analogy
- Support And Resistance As A Zone
- Support Is The Floor
- Watching Reaction At The Support / Resistance Zone
- Resistance Becomes Support
- Back To Our Analogy
- View Of A Longer-Term Investor
- FAQs
- Conclusion
Support And Resistance Are Memories Of The Market
Support and resistance are key concepts in trading that stem from the market’s memory.
Unlike a fair coin toss game, the market is not entirely random and its memory enables traders to profit.
Support and resistance levels represent the market’s memory, which is a historical reflection of previous supply and demand imbalances.
The market’s memory is the reason why past support or resistance levels can act as a barrier to future price movements.
This memory allows traders to identify key levels where buying or selling pressures have previously entered the market and use this information to make trading decisions.
Understanding the market’s memory and how it manifests as support and resistance is crucial for any trader looking to successfully navigate the markets.
An Analogy
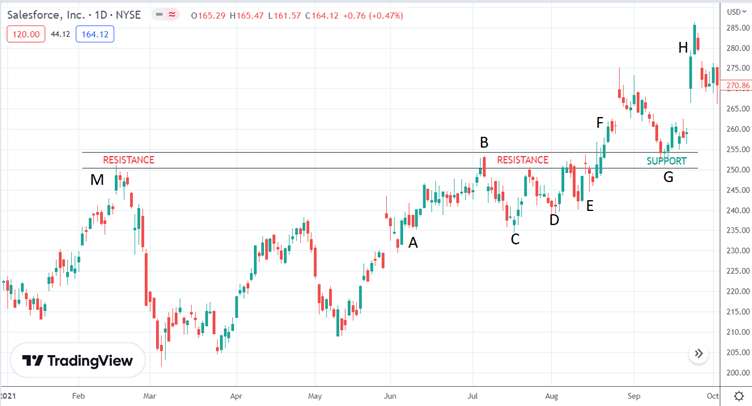
source: TradingView.com
While this is a chart of the price of a share of Salesforce stock,
it could have been the price chart of any product or service in any marketplace.
Because the psychology of buyers and sellers is the same in any liquid market.
As an analogy, let’s say this is the chart of the price of a high-fidelity monitor that someone wants to buy.
As any buyer, he wants a good deal.
He is watching the ads for bargains and sees the monitor price in June 2021 go up from $230 to $250 — look at the chart above, from point A to point B
At $250, he is saying, “Geez, that’s expensive. It used to be $230.
I’m not going to buy it at $250.”
Lots of other buyers are thinking the same, that’s why there are no more buyers at point B, and the price does not go up further.
This is resistance.
Prices drop to point C at $235. The buyer remembers that the price used to be $250.
Now he is thinking, that’s a discount.
While not as low as its original price of $230, it is good enough for him to buy.
Other buyers think the same and drive the price up to $250 again.
At this point, everyone remembers and knows that the typical price range of the monitor is around $230 to $250.
No one is going to buy at $250 because that is the high end of the range.
They are trying to get the price as close to $230 as possible.
In August, the price drops down to $240 (point D in the chart above).
This must be a good monitor because buyers are willing to pay more and more for this monitor.
After waiting for a long time, the price never returned to $235.
And the price seems like it will never go back to its original $230.
Buyers who really want this monitor will have to buy it at higher and higher prices.
This creates the “higher lows” at points C, D, and E.
There are also “higher highs” as well (although I have not labeled them on the chart).
These higher highs bounce back down at roughly around the $250 price level.
This $250 price level is known as “resistance.”
Price has a difficult time getting above resistance.
Note that it is also a big round number of 250, which is easy for everyone to remember.
That’s why some will say that large round numbers can sometimes act as psychological resistance levels.
Count how many times I’ve used the word remember in the above explanation of the price action.
This price action only works if there is memory.
Without memory, price action and support, and resistance do not work.
Without memory, the market becomes completely random.
Support And Resistance As A Zone
Note how I have drawn the support and resistance zone.
The key word here is zone.
Support and resistance are not precise lines at one exact price number.
Think of it as a gray zone, anything around $250 to $255.
You cannot say, “once the price hits $250, it will go down.”
No, it can go up to $254. Or it can reverse at $247 instead.
Or it can have wicks going above $255.
People often ask how they shall draw the support and resistance line.
Can it cut through the bodies of candles?
Is it drawn from the tip of the wick or the body?
Or should it have the line cut through the bodies of as many candles as possible?
Honestly, all those answers are correct.
Support and resistance levels are not precise price points, but rather areas where traders expect significant price action to occur.
Therefore, they can be drawn in various ways and are subject to interpretation.
The important thing is to identify the areas where buying or selling pressure has historically been strong enough to influence the price movement
Because there is nothing precise about how the price will move, you don’t need to draw it precisely.
Not only is support and resistance a zone, but it is also a flexible zone, which means it can bend and flex.
Many people think of resistance as a ceiling or a wall.
That is fine.
But because it is not rigid, it might be better to think of it as flexible fencing.
Support Is The Floor
If resistance is the ceiling, then support is the floor.
The resistance zone appears above the price.
The support zone appears below the price.
Think of resistance as something that the price needs to push up through above (hands push up on the ceiling).
Think of support as something that holds up the price (hands supporting a baby).
Support and resistance are not impenetrable.
They often are breached.
In fact, they are likely to be breached at some point.
To figure out the likelihood of when and where you will need to read the price action of the candles instead of drawing lines and counting touches.
In our example chart above, buyers are getting stronger and stronger, making higher highs and higher lows at points C, D, and E before breaching the resistance with four strong green sequential candles to break through on the other side at point F.
Watching Reaction At The Support / Resistance Zone
You want to see how the price reacts in these zones.
You want to see how strong the reaction is at these zones.
Ideally, you want to see how emotional the candles are at these zones.
Large full-body candles with little or no wicks are emotional.
Doji candles are non-emotional and suggest indecision.
See the large red candle at point B.
This is a strong emotional bearish candle.
It is like the price is driving along nicely from point A
and then all of a sudden runs into a brick wall and stops the car immediately.
Again, in mid-August, we see another strong bearish red candle, the tallest one seen for a long time.
It opens at $250.87 and closes at $243.39 — a 3% move.
The car rams into that same wall again and is stopped dead in its tracks.
We know there are sellers at this wall because of this.
These are the big institutions because retail traders like you and me will not create these large candles in a large liquid stock like Salesforce.
Buyers need to be wary when approaching this wall.
Strong emotions create strong memory.
Strong memory means strong resistance or support zone.
And strong memory means more likely support and resistance to work as expected.
If you see strong emotional candles at the zone you’ve drawn, you most likely have drawn the zone in the correct place.
Resistance Becomes Support
There are also large buyers in this zone.
The buyers start showing up at point E with the tall green candle.
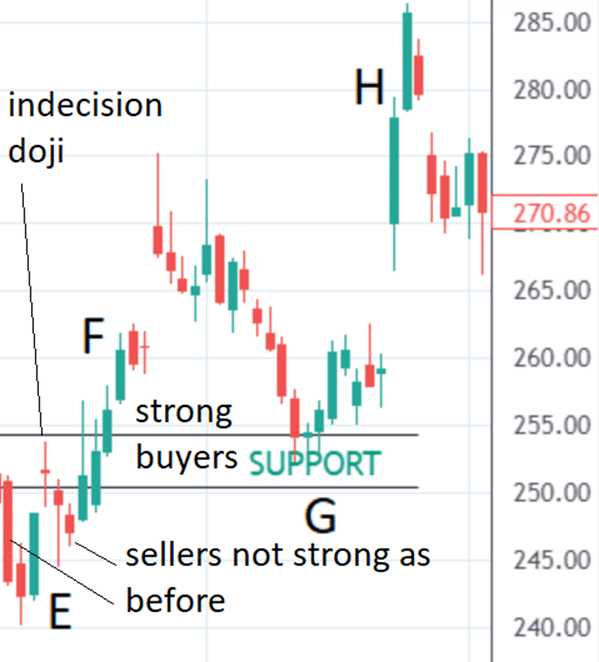
When the price reached the zone, we got an indecision doji followed by two red candles that appeared quite weak.
One has a bottoming tail that indicates that buyers pushed the price back up on that day.
And the other has a small body.
Certainly, sellers are weaker than before when we saw the big red candle.
Then the buyers came in force from E to F with four big green candles in a row that broke the wall.
These are also big players because you and I don’t have enough money to buy, buy, and buy four days in a row.
Once the wall is broken, the resistance zone sometimes becomes a support zone. Sometimes, but not all the time.
To get a clue as to whether it is likely to become support, look at how the wall was broken. In this example, the wall was broken with strong momentum and energy.
This means strong buyers are present.
When strong buyers are present, it is more likely for it to become a support zone and more likely for the support zone to be able to maintain price increases
After an upward thrust at point F, it is natural to have a pullback.
This pullback comes back down to the zone.
But will this zone hold?
Or will the price fall right through it?
We can never tell for sure.
But in this case, it did hold, and the price bounced up from support at point G to make new highs at point H.
The buyers were strong indeed.
So this is how you read price action.
Support and resistance are not just about connecting points on a chart.
It is an area in which price action is to be read and an area to watch how prices respond.
Back To Our Analogy
Let us go back to the analogy of buying a monitor.
Now that price of the monitor has reached as high as $270; the buyer does not think that he will ever be able to get the price at $235 anymore.
He regretted that he had missed the sale and had not bought it earlier.
At the next sale, he will buy it.
The next discount came in mid-September when the price dropped to $255.
Okay, fine.
He buys, producing the support at point G.
View Of A Longer-Term Investor
Let’s look at the same chart with the same zone again.
But this time, from the point of view of a longer-term investor who had owned Salesforce stock since January 2021, when she bought it at $220 per share.
She was happy when the price increased to around $250 just one and a half months later (see point M).
Because of her elated emotions and because $250 is a nice big round number, she remembers this price of $250.
But something happened to the stock in March when it fell to $205. She is at a loss — in both meanings of the word.
She is at a loss due to a negative P&L number.
And she is at a loss as to what to do next.
She says, “Oh, geez.
I should have sold and taken profits when the stock was up at $250.”
Ultimately, she decided to hang onto the stock because she still believed in the company, which was why she had bought the stock in the first place.
In July (point B), the stock came back up to $250. She remembers how glad she was back then when the stock gave her quick profits.
She remembers how devasting she felt when the stock crashed down to $205 and how she regretted not taking profits when she had the opportunity.
There is no choice for her now.
There is only one thing to do.
The psychology is too strong.
She sells her stock at $250 per share at point B, locks in the profit, and says she is done.
Many investors and even large fund managers might have gone through the same experience.
Hence you see the selling at point B due to the memory at point M.
This psychology forms the resistance zone connecting point M to point B.
FAQs
Does support and resistance work in any timeframe?
Yes, any timeframe that people regularly trade-in.
Does support and resistance work in any market?
Yes, in any market, that is liquid, meaning that enough humans are trading it such that it activates memory and emotions.
Q: What are support and resistance levels in trading?
A: Support and resistance levels are price levels on a chart where the price of an asset tends to stop and reverse direction. Support levels are where the price tends to stop falling and start rising, while resistance levels are where the price tends to stop rising and start falling.
How do you identify support and resistance levels?
There are different methods to identify support and resistance levels, but some common approaches include looking at previous price levels where the price has bounced off, using technical indicators such as moving averages or trend lines, and analyzing market sentiment and order flow.
Why are support and resistance levels important?
Support and resistance levels are important because they can indicate potential buying and selling opportunities for traders. When the price reaches a support level, it may be a good time to buy as the price is expected to bounce back up. Conversely, when the price reaches a resistance level, it may be a good time to sell as the price is expected to fall back down.
How do support and resistance levels change over time?
Support and resistance levels can change over time as market conditions change. If a support level is breached, it may become a resistance level as traders who bought at that level are now looking to sell. Similarly, a resistance level that is breached may become a support level as traders who sold at that level are now looking to buy.
Are support and resistance levels always reliable?
Support and resistance levels are not always reliable as they can be broken due to sudden market shifts or unexpected news events. Traders should use support and resistance levels in conjunction with other technical analysis tools and market indicators to make informed trading decisions.
Conclusion
Have you ever thought of support and resistance in this way?
Thinking of it as the memory of the marketplace?
Or did you just connect points on a chart with a line?
Many people would have just mechanically drawn a resistance line from point M to point B.
In this case, it happens to be correct. B
ut it might not be in all cases.
However, if you read the psychology of the investors inside the candles going from left to right in the chart, then you are more likely to draw the support and resistance correctly.
Hopefully, this will give you an understanding of why support and resistance work.
It is human emotions and memory that drive the movement of the markets.
We hope you enjoyed this article about the fundamentals of support and resistance.
If you have any questions, please send an email or leave a comment below.
Trade safe!
Disclaimer: The information above is for educational purposes only and should not be treated as investment advice. The strategy presented would not be suitable for investors who are not familiar with exchange traded options. Any readers interested in this strategy should do their own research and seek advice from a licensed financial adviser.


