


Today, we’re doing a Finviz review. IT’s one of my favorite sites with loads of great tools, and most of them are free!
Contents
- Introduction
- Groups and Maps
- Finviz Stock Screener
- News Section
- Insider, Futures, Forex & Crypto
- Finviz Elite
- Conclusion
Introduction
There are many financial sites available for retail traders.
One of the best known is Finviz.
This article will give a review of their website and discuss some of the valuable functionality available to users.
Groups and Maps
Two of my favorite tools in Finviz are the Groups and Maps sections.
Having a market overview to see how sectors are performing on a day to day basis is always useful as a trader.
When I started out learning it helped to check how each sector performed every day.
This way, over time, I could develop a feel for how the sectors were correlated with each other and how they respond differently to market news.
The groups section does a great job of displaying this.
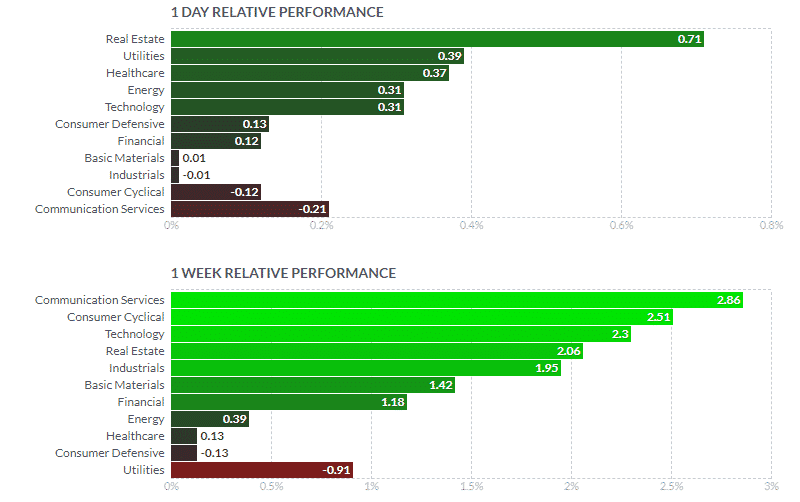
Here we can see how sectors have performed over the course of the day and week.
While this information is available on tons of other sites, I really enjoy the ability to scroll down and see the real time performances for longer time periods.
This is useful as Finviz shows the 1 month, 3 month, half year and year performances in an easy to see format.
All you have to do is simply scroll down.
This allows us to see longer term sector rotations and performances in addition to shorter term moves.
In the groups section you can also toggle to see some fundamental data for the sectors such as P/E ratios and dividend yields.
These are useful, but hard to compare as different sectors should naturally have different ratios.
Though comparing the same sectors across different countries is an idea as a value investor.
Maps
The maps section is also popular on Finviz.
The maps section allows investors to break down the sectors to see performances of their largest stocks. All in one visual (shown below).
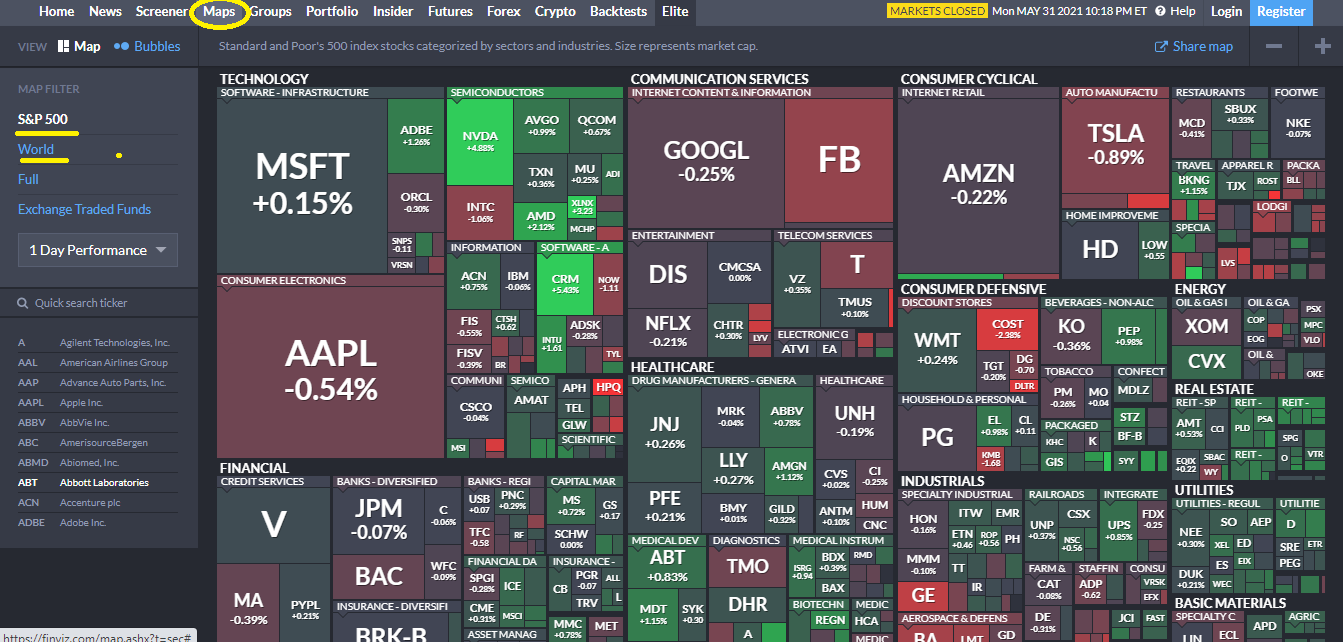
While the heatmap is pretty cool to see in fairness I haven’t found a practical use for it.
Despite this it tends to be a favorite visual when the market has a huge sell off.
Simply post a screenshot of a completely red heat map on twitter with the tag “sea of red” and you are bound to get a comment.
As an aside I always find it fun looking for the one speck of green when the market has a huge sell-off. Not a bad idea to pick some of these stocks in a portfolio!
Finviz Stock Screener
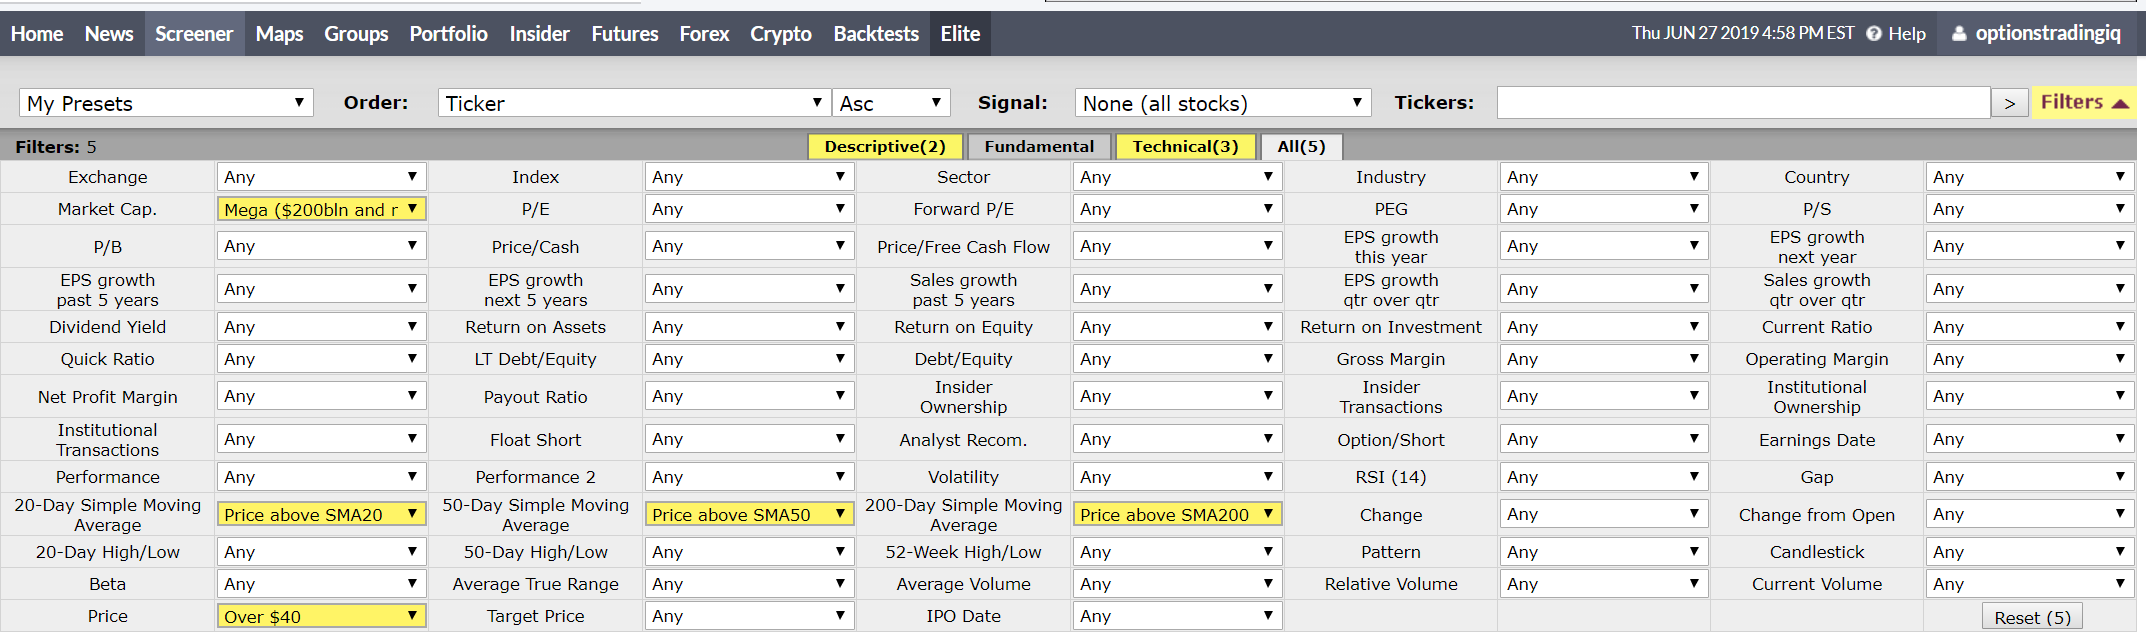
By far my favorite feature in Finviz is the free stock screener.
This allows users to take a top-down approach and find stocks based on multiple descriptive, fundamental and technical values.
The great thing about Finviz’s stock screener is simply the number of options available to screen from.
There are easily over 50 filters to allow you to create a custom screen.
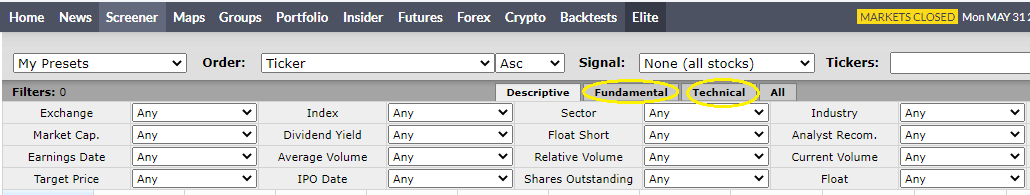
To toggle to see the different filters you can simply click on the fundamental or technical headings.
Another cool thing about the Finviz screener is that if you have a favorite scan using multiple variables you can save it.
This allows you to use it whenever you would like without having to recreate the screen again.
In order to use this feature, you simply need to sign up for the free version and create an account.
I find that having the ability to screen for a shortlist of stocks using the screener tool can be invaluable.
It is fast and easy.
It also removes the bias of finding a cool stock randomly while avoiding better options.
Here’s an example of a Finviz screener that I use to find technically strong mega cap stocks.
News Section
The News section in Finviz offers the latest articles and blogs from major publications.
The useful thing is that it sorts these publications by time so you can see the most recent articles.
Even more importantly it screens out a lot of these “robot news” stories where a stock’s ticker is inserted with a generic article that conveys no value to the reader.
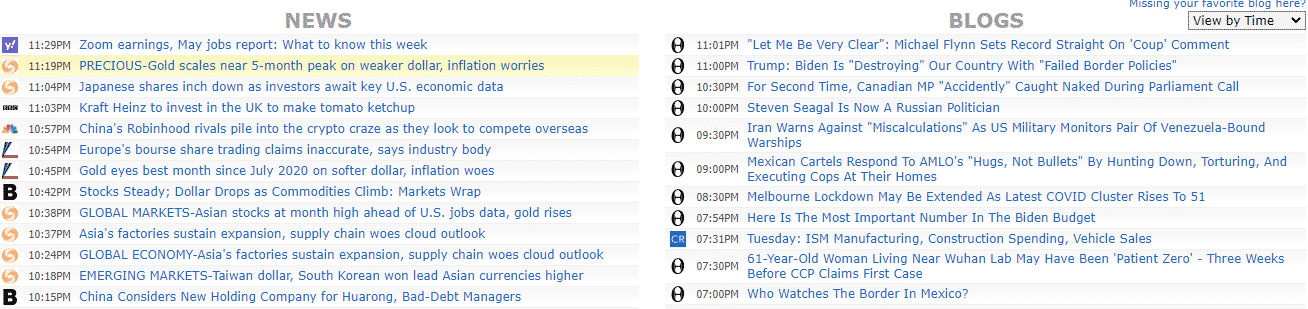
Alternatively, you can change the page to view by source which shows the latest articles separated by publications.
Though admittedly if I were to take the steps to do this I would rather just open Bloomberg’s website myself.
On a personal level, some well displayed images may make me more likely to read the articles.
Despite this the news section is worth checking out just from the sheer scale of recent articles you can see on a single page.
For some people they may find it more straight to the point and enjoyable than other websites.
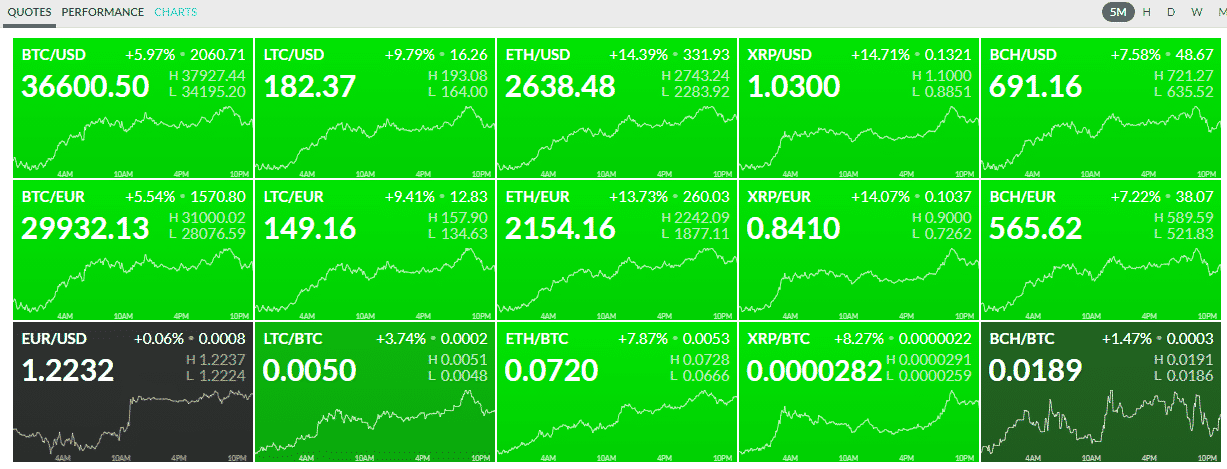
Insider, Futures, Forex & Crypto
These are the areas of the site which I don’t find very useful.
The Futures, Forex and Crypto are basically heatmap sections but in my opinion are kind of disjointed.
For example, with the Crypto heatmap below we have the crypto currencies against the USD then we have them against the Euro, then again against each other.
It just seems kind of messy. For an average investor living in the United States, knowing Bitcoin’s price in Euros is not very relevant.
The currency section is similar as it also makes a mix and uses crosses.
It would be nice to just have a base currency displayed in local currency and the other currencies against it.
The insider section, while providing details on transactions conveys little value.
The reality is tradable information in this area is hoarded, expensive and almost already priced in by the time the average investor gets their eyes on it.
Oftentimes people will see insider trades as signals when there could be so many reasons why a company member buys or sells shares.
Maybe what you thought was tradable information from the CEO selling shares was in fact his yacht club renewal is coming due!
Though if you find a tradable edge using it, please leave it in the comments below!
Finviz Elite
Is Finviz Elite worth it? Let’s take a look.
While the basic membership to Finviz is free there is an elite membership costing $25 a month.
Aside from real time data the major difference is access to the backtest section.
If you do not plan to use the backtest version, paying $25 a month for some minor upgrades is definitely not worth it.
After all, the maps and groups sections are only delayed by 5 minutes.
Since I would use these for a general sector review anyway it would make virtually no difference for me.
If you are wanting to use the backtest feature as you don’t have it from another platform it could make sense to try out.
In this case, I would suggest listing down a number of different backtests you would like to run so you can truly get a full value from it.
Since it is monthly you can always do a lot of backtests, cancel, then come back later when you have more ideas.
Overall, for most people the basic version will suffice.
Conclusion
Finviz is a cool financial website.
It is definitely one of the best free pages overall as it offers both a great market overview and a pretty good scanner.
At the end of the day there are many other competitors who offer financial information,
so it may come down a bit to personal preference.
That being said, if you haven’t already checked out Finviz it is definitely worth a look to see if it could be valuable to you.
Trade safe!
Disclaimer: The information above is for educational purposes only and should not be treated as investment advice. The strategy presented would not be suitable for investors who are not familiar with exchange traded options. Any readers interested in this strategy should do their own research and seek advice from a licensed financial adviser.


Ditto!!