

Triple tops and bottoms are powerful chart patterns that signal potential reversals in the market.
These patterns can help traders either enter new trades to capitalize on the potential reversal or exit a position to help maximize profit.
Below, we will review what makes up a good triple top or bottom and how to trade it.
Contents
What Is A Triple Top?
A triple top is a bearish chart pattern that forms after a stock has been in an uptrend and makes three consecutive tops at nearly the same price level.
This type of chart pattern often signals the inability of buyers to push through a level of resistance, signaling a potential reversal.
The key to identifying a triple top is watching for three distinct tops.
You want to see buyers not being able to post multiple closes above that resistance level.
Identifying A Triple Top
Now that we have a basic understanding of a triple top let’s look at how to identify it:
1. Previous Trend: For a triple top to form, there must be a period of an up trend before the first top
2. Three tops: The price hits a resistance level three times with roughly the same high; this does not have to be the exact same price but is usually not more than 1% different on a daily time frame.
3. Decline: After the third top, the price typically falls below the support level formed between the tops and will not be retested.
4. Volume Confirmation: Volume tends to decline with each successive top, indicating weakening buying pressure. Using this can be a great way to verify a triple-top
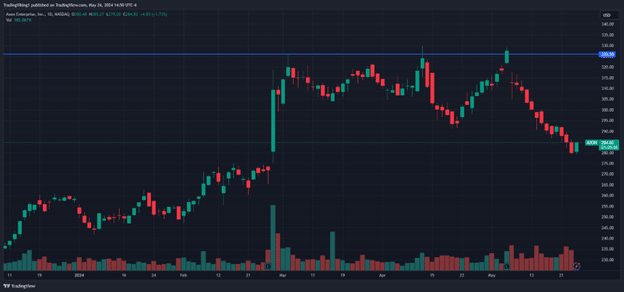
Below is an example in Axon Enterprises.
As you can see, there was an uptrend heading into March of 2024, when the first top was formed.
Price then pushed through two more times before ultimately failing.
Trading A Triple Top
The goal of trading a triple top is to try to anticipate the trend reversal.
Entry: Entering based on a triple top can be done in a few ways. The more aggressive way is to wait for several consecutive closes under the resistance level and take the short trade. The more conservative way is to wait for the price to break the support formed between the tops, or in the case above, someplace around the $305 price level.
Stop Loss: Place a stop loss just above the highest top to limit potential losses if the pattern fails. Risk should be fairly tight on these trades.
Profit Target: Similar to the entry criteria, the take-profit criteria has a few options. The more conservative option is to take the distance from the highest peak and the lowest valley and use that as the number of points profit. In the above example, it would be roughly 30 points. The more aggressive example is following your trade with your stop loss to allow the trade to run. You may be in the trade longer but have a higher potential profit.
What Is A Triple Bottom?
Conversely, a triple bottom is a bullish chart pattern that occurs when a stock that has been trending down makes three consecutive lows at nearly the same price level, showing sellers cannot push through the support level.
This, similar to a triple top, indicates a potential reversal.
Identifying A Triple Bottom
To recognize a triple bottom, look for these signs:
1. Previous Trend: Look for a stock trending down before the first low.
2. Three lows: The price hits a support level three times with roughly the same low. Similar to the triple top, these don’t all have to be the same price exactly but should be close.
3. Rally: After the third low, look for the price to reverse back up.
4. Volume Confirmation: Similar to the triple top, look for volume to decline as the bottoms are formed to confirm a potential reversal.
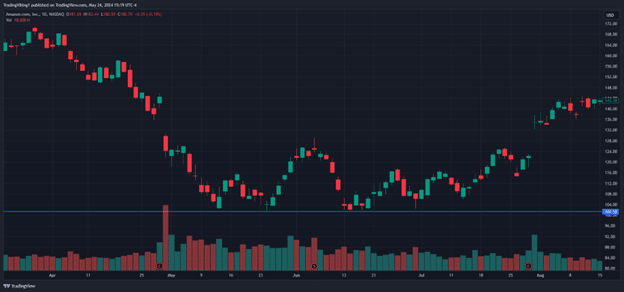
Below is an example of a triple bottom formed on Amazon back in 2022.
The price was decreasing before it eventually bounced after a 3rd attempt to break the 101 price level.
Trading A Triple Bottom
Similar to the triple top, the goal of the triple bottom is to anticipate the upside reversal and capitalize on the price appreciation. :
Entry: Similar to the triple top, entering a trade with a triple bottom can be done in a few ways. The more aggressive way is to wait for several consecutive closes above the support level and take the short trade. The more conservative way is to wait for the price to break the resistance level formed between the bottoms, which could be around the $115 level in the example above.
Stop Loss: Place a stop loss just below the lowest bottom to limit potential losses if the pattern fails.
Profit Target: Similar to the triple top, the triple bottom has the same two profit-taking strategies. The conservative strategy is to take the distance between the highest peak and the tipple bottom and make that the target in points. In the Amazon example above, it would be roughly 25 points. The more aggressive approach is to follow up with your stop loss again to pick up potentially larger returns.
Using Indicators for Confirmation
As with any chart pattern, adding technical indicators can help confirm the triple top and triple bottom patterns.
The first indicator is the RSI.
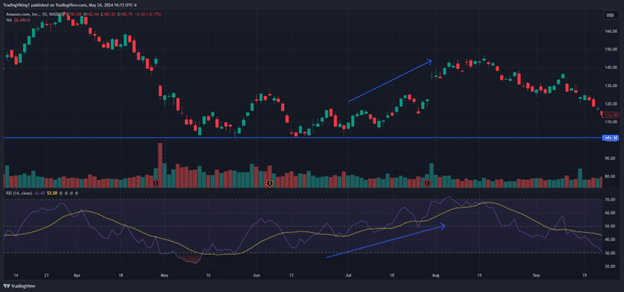
The RSI can be a great way to confirm a move off of a triple bottom or top by looking for the RSI to trend in the direction of the reversal.
Take a look again at the Amazon triple bottom with the RSI on it.
You can see the RSI trending up to diverge from the price pattern.
Eventually, the price follows suit after the third bottom is put in.
A second indicator to use to confirm a triple bottom or top is the ADX.
The ADX is often used to measure the strength of a trend, so looking for the ADX to decline into either the bottom or the top can help confirm the reversal.
Let’s look at the same trade in Amazon again, but this time with the ADX on the chart.
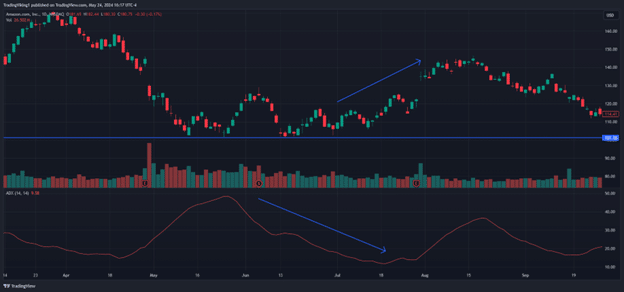
The more times the price taps that bottom support, the lower the ADX goes, showing a weakening trend.
You would want to see this to confirm a potential reversal.
Trading With Options
Finally, let’s look at how to utilize these patterns with options.
Since these are both reversal patterns, naked puts and calls can be a good way to trade them.
The common issue of theta decay can be mitigated by buying time and looking to close the option early, almost like a stock replacement.
Other option strategies that work well are verticals and ratio spreads, which allow you to place a directional trade and not be exposed to theta decay in the same manner.
Verticals are perhaps the best option; you can sell the spread and get paid to wait to see if the trade works out.
Wrapping It Up
Triple tops and bottoms can be a great way to look for market reversals.
Learning to master these chart patterns can help you spot trades earlier and stay profitable by exiting existing positions when you see them forming.
Whether you trade them by themselves or with the help of other indicators like the ADX or RSI, these chart patterns are vital for traders of every level to learn.
We hope you enjoyed this article on triple tops and bottoms.
If you have any questions, please send an email or leave a comment below.
Trade safe!
Disclaimer: The information above is for educational purposes only and should not be treated as investment advice. The strategy presented would not be suitable for investors who are not familiar with exchange traded options. Any readers interested in this strategy should do their own research and seek advice from a licensed financial adviser.


