

Double tops and bottoms are technical patterns that many traders rely on to spot reversals in the market.
Their signature “M” or “W” pattern have become synonymous with trades that can produce massive returns.
In this article, we will look at what makes up a good double top or bottom, how to identify it with more confidence, and finally, how to trade it with both the underlying and options.
Contents
What Is A Double Top
The first pattern we will look at is the double top.
This is a bearish chart pattern because it shows that buyers had failed to break through the previous local high and hold it, which is important.
A double top often has a wick that extends above the previous high, but the price closes well below it.
This spike and drop can be a key indicator that a double top has arrived.
This wick is not a requirement, though, as the second top will occasionally fall just below the previous high.
Let’s look at Exxon Mobil’s chart below as an example of a wicked top.
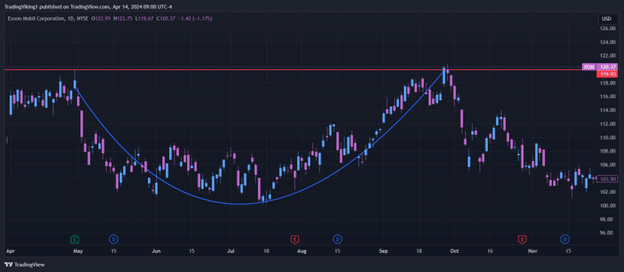
This is a pretty textbook example of how to spot a double top.
The price is coming off of a nice rounded move back into the previous high.
Price then spikes above it, and the next day, opens below and continues to fall.
This trade would have set it up nicely after the second consecutive close lower, but we will look more into how to confirm and trade these setups below.
What Is A Double Bottom
The double bottom is the same formation as a double top, just inverted. It is a bullish chart pattern because just as the double top shows buyers couldn’t hold the top, a double bottom shows sellers couldn’t hold the bottom.
Let’s look at the example below from Home Depot.
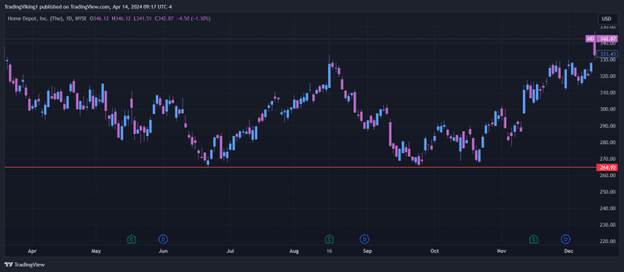
You can see in the above chart that the price comes down to make a local bottom, rebounds back up, and then comes down to test the previous bottom.
As discussed above, this is a sign of strength because the price could not break through the previous low.
The stock then went on to rebound almost 80 points from the low.
Now that we have identified the components of a double top and double bottom let’s look at some ways to help you more confidently identify and trade them.
Identification
Identifying the double top or bottom formation may seem simple when looking back at charts, but it can be significantly more complex in real time.
If you time a trade wrong or misjudge if it truly is a double top or bottom, you could quickly go from a home run trade to a pain trade.
To correctly identify a double top or bottom, you must look at the charts after the market has closed for the day, before the opening the following morning works, and see if the current candle is around any previous local tops or bottoms.
You can do this manually daily if you have a fairly stable watchlist, or you can use a tool like TrendSpider or Tradingview to automatically scan for technical setups for you on a larger universe of stocks.
After you have identified a stock that has closed around a previous top or bottom, the next step is to look for consecutive closes in the correct direction to help solidify the trade.
Take that Exxon chart above; there were three consecutive closes lower before a single candle of pause and some additional continuation.
There was a similar situation on the Home Depot chart, but that chart is a lot less clear, especially in real-time. Looking for consecutive closes in the direction of the trade will help you avoid some false signals.
A second method for identifying if a double top or bottom will stick is using a supporting indicator like the RSI or MACD.
Any indicator that is part of your trading plan will work, but we will go over these here as they are two of the more popular indicators.
RSI
Let’s look at that Home Depot chart with an RSI added to it.
Things will get a lot more clear with the addition of the supporting indicator for confirmation.
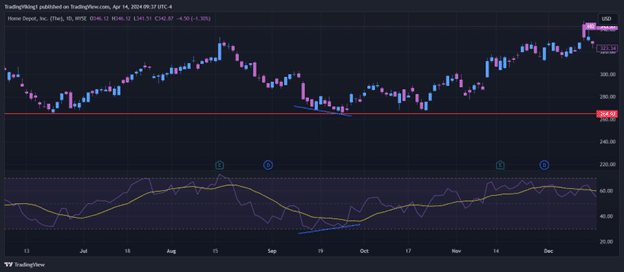
Once we have added the RSI, a divergence forms at the double bottom (indicated by the blue lines on the chart).
This can be a great sign that the trade could work out in your favor. In addition to the divergence at the bounce, the RSI continues to increase as the trade plays out.
This is a further confirmation that the double bottom will stick.
MACD
Let’s revisit that XOM trade, with the MACD added to the chart, for some additional confluence to trade with.
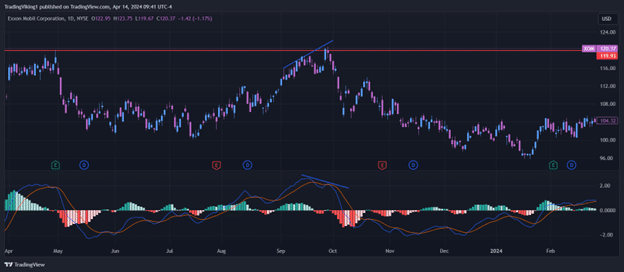
Similar to the RSI, we can see a divergence between price and the MACD as the stock heads back towards the double top (blue lines again).
As the divergence resolves itself, you get the MACD cross-over in a bearish manner and several consecutive closes off of the high.
This indicates that the double top will stick and that a short could work out for you.
Trading The Double Top And Bottom
Now that you know what a double top and bottom are, what they look like, and how to identify them, let’s look at how to trade them.
If you are trading the underlying equity or instrument, waiting for a couple of consecutive closes in the trade’s direction will help confirm the move.
Entering on the open of the following session would be ideal, and setting a stop loss above or below the double top or bottom will help keep your risk as defined as possible.
Regarding a target, double-formation trades can be managed in any way you see fit.
However, one common target for these types of trades is the peak or trough from the initial bottom or top.
Below is an example of that Exxon chart:
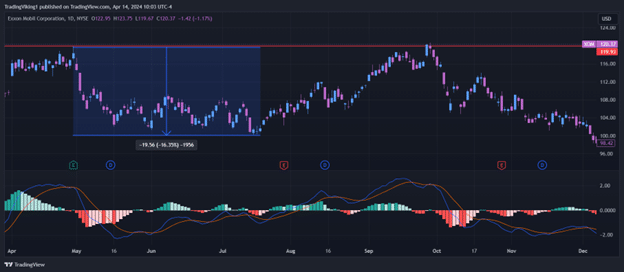
The first top in the double top produced a selloff of roughly 20 points, as noted by the blue box above.
So, if you were to take this trade short off of the double top, a 20-point target would be standard, and as you can see, this trade would have hit your target.
Options are another excellent vehicle for trading double tops and bottoms. Credit spreads are among the most popular trades for these types of setups.
Utilizing a credit spread after the trade is set up allows you to collect the profit even if the price barely moves.
This is because theta decay is working to your advantage here.
These spreads also remove the need for any real directional move to occur; as long as the price doesn’t go against you, there is a higher probability you will profit.
Another common method to trade these is to purchase the call or put option to trade the move off the top or bottom.
This is significantly trickier, though, as it requires you as a trader to have the price move in the correct direction and magnitude inside the window of your contract expiration.
LEAP Options
One potential way around this is to utilize LEAPs, but that can be an expensive position while still exposing you to theta decay that is now working against you.
The best way to choose the best option strategy for your trading is to take what you are comfortable with and what works well with that stock.
Exxon and Home Depot are not known for their extreme volatility, so spreads could be a better trade option.
If you were looking at something like Tesla, which can move 20+ points in a day, a long option could be a better choice if you are comfortable with the risk.
Concluding Thoughts
Double tops and bottoms can serve as invaluable tools for technical traders seeking to trade market reversals.
Successfully identifying these patterns requires daily practice and updating, as well as the use of supporting indicators or trading plans.
These patterns can be very profitable if you plan on trading the underlying stocks, but they can be turbocharged with options and spreads to help leverage the move.
Just remember that, like all technical patterns, there are no guarantees and that stop losses are required to keep your account safe from moves against you if these technical setups fail.
We hope you enjoyed this article on double tops and bottoms.
If you have any questions, please send an email or leave a comment below.
Trade safe!
Disclaimer: The information above is for educational purposes only and should not be treated as investment advice. The strategy presented would not be suitable for investors who are not familiar with exchange traded options. Any readers interested in this strategy should do their own research and seek advice from a licensed financial adviser.


