


Contents
- What is the RSI
- How Is The RSI Calculated?
- Benefits And Risks Of The RSI
- How Do Traders Use RSI?
- What Is Considered Overbought and Oversold?
- Difference Between RSI and MACD
Today, we are looking at the RSI Calculation.
We will look at the calculation itself and then discuss how traders use the indicator.
What is the RSI
The RSI stands for the Relative Strength Index, and it is used most often by technical analysts to gauge whether a stock is overbought or oversold.
The RSI measures the magnitude of recent market moves over a period of time, and it is calculated using a formula that compares the average of up days to the average of down days.
A stock is considered overbought when the RSI reaches 70 or above and oversold when the RSI falls below 30.
These are just the standard inputs.
However, many traders manipulate them to fit their strategy.
Some traders look to buy when the RSI falls into the oversold territory and sell when it enters the overbought territory, but it can stay oversold/overbought for long periods of time, so the RSI should be used as part of a broader trading strategy.
How Is The RSI Calculated?
The RSI is calculated using the following formula:
100 – (100 / (1 + RS)), RS (standing for relative strength) being the average of x up days/average of x down days.
The x-up days are defined as the number of days where the closing price is higher than the previous day, while the x-down days are defined as the number of days where the closing price is lower than the previous day.
Generally, 14 days is used as the period for calculating RSI.
Therefore, if there have been eight up days and six down days over the past 14 days, RS would be equal to 8/6, or 1.33.
Applying this to our formula above gives us a final RSI value of 100 – (100 / (1 + 1.33)), or 74.63.
Benefits and Risks of the RSI
The RSI can be used to measure the magnitude and velocity of price changes for a given security.
Investors can use it to gauge whether a security is overbought or oversold and identify potential trend reversals.
It is very important to remember that it is a lagging indicator, though, and while it has many valid use cases, it is best used in conjunction with a larger trading method because it is based on previous prices.
A few of the better uses for RSI are move confirmation, meaning if you think a stock is potentially a long and you see the RSI crossing up from under the lower bound, it can be a potential confirmation to enter the trade.
Another use is to see how strong a trend is.
If a stock is rising and the RSI is pegged over the upper bounds, it can be considered a confirmation that the stock is strong.
The same can be said if the stock is falling and the RSI is continually under the lower bounds.
Risks
There are also several risks to the RSI, one of them is that it is, in fact, a lagging indicator.
This can make setting stops and taking profits difficult on an underlying because there is the potential for some serious price movement before you get a signal to exit.
Another risk to using the RSI is the market conditions.
Slower markets make it more effective because the prices it works off of are slower to move. Faster markets make it oscillate faster, making it more difficult to read.
The RSI is a fantastic tool to have in your trader toolbox.
Even though it is not the only indicator, it certainly has its place in trading.
Using it has several risks, but the potential benefits can well outweigh them.
How Do Traders Use RSI?
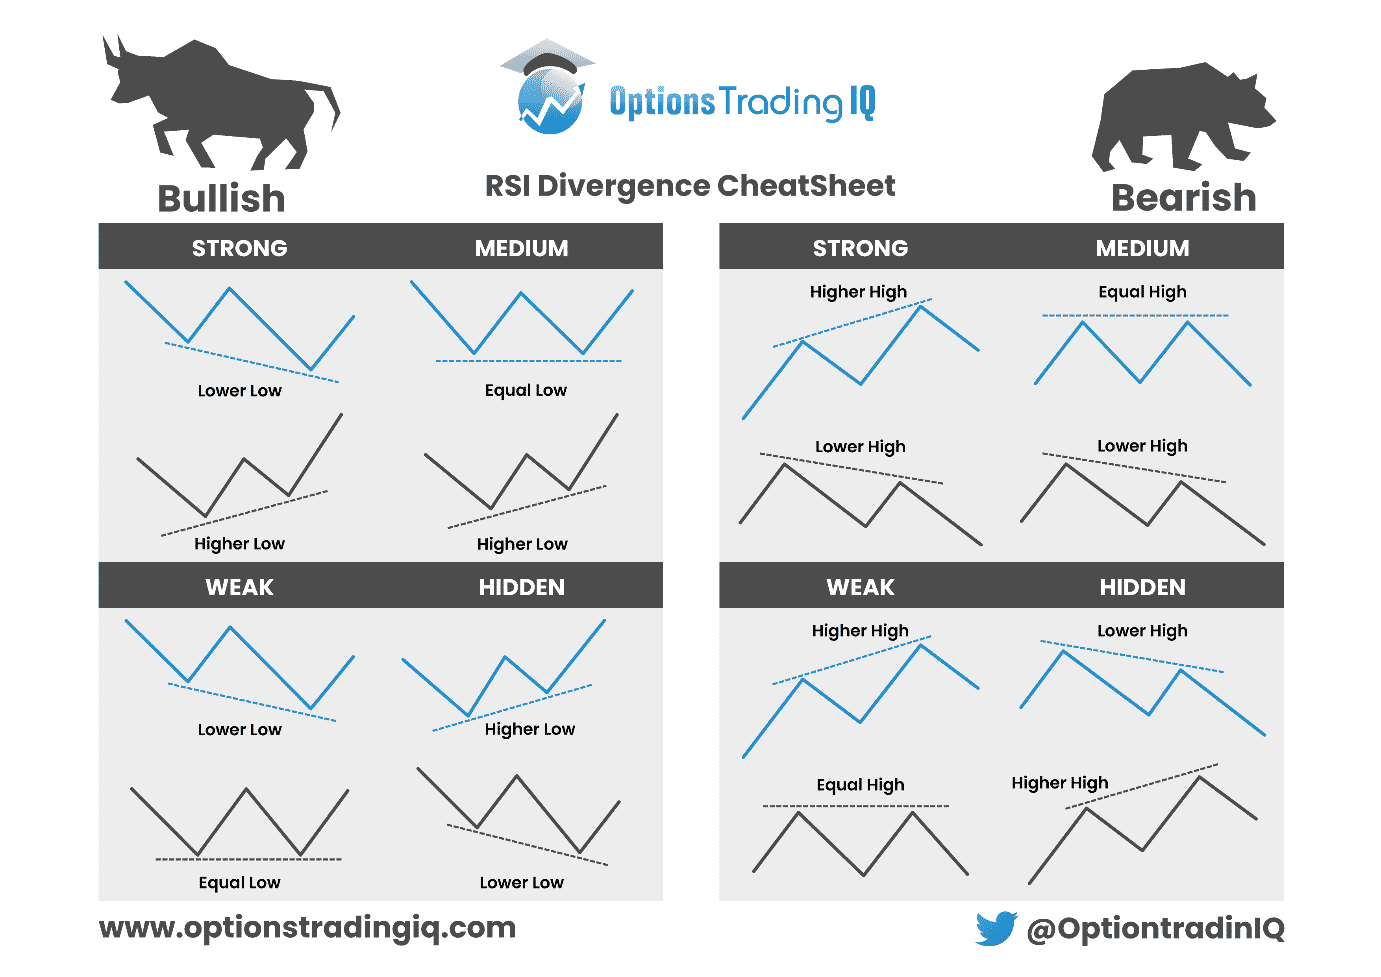
One of the most common uses for the RSI in trading is the RSI Divergence trade.
A divergence trade is when the indicator is signaling a top or bottom, and the price is not yet respecting the new direction.
There are two main divergence trades: the bullish divergence and the bearish divergence.
The bullish divergence trade is when the RSI is making higher lows, and the actual price is still making lower lows.
There are several variations on this, but the higher low/lower low is the most basic setup.
The bearish divergence is the inverse of the bullish trade.
For the bearish divergence, you are looking for the price to be making a higher high and the RSI to be making a lower higher.
This is when you will start looking to short the instrument.
While these divergences are very popular, another way to use the RSI is an oscillator looking for overbought or oversold conditions.
What Is Considered Overbought and Oversold?
Another common way to utilize the RSI in trading is to use it as an oscillator when the price is in an overbought or oversold condition.
Price is considered overbought when the RSI displays a reading of over 70.
Conversely, it is considered oversold when it reads below 30.
A possible way to trade the overbought/oversold condition is to start looking for longs when RSI reads below 30 and start looking for shorts/selling once it is over 70.
A note on this trading style, though, while divergences can be fairly stable when combined with a complete trade plan, an indicator can remain overbought/oversold for a nearly indefinite period of time.
So overbought and oversold should not be the only qualification for entering into a trade.
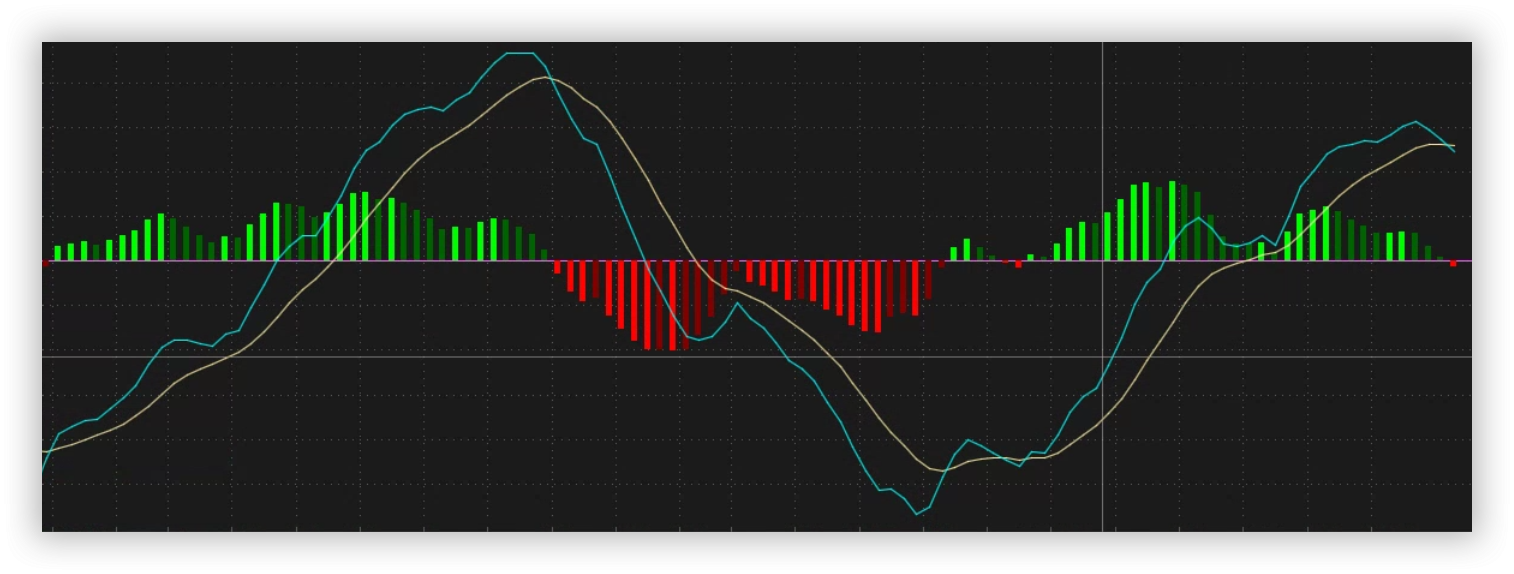
Difference Between RSI and MACD
The RSI provides a lot of potential trading opportunities, but it is often discussed in the same breath as the MACD.
And while both provide plenty of trading opportunities, there are significant differences between them.
The RSI measures the Relative strength of a stock by measuring the up days vs. the down days.
The MACD, which stands for Moving Average Convergence Divergence, is often used to measure trends and is calculated by subtracting the 26-period EMA from the 12-period EMA.
This allows the MACD to always shift around a zero line to show the prevalent trend and is one of the largest differences between the MACD and the RSI.
There are then two moving averages often overlaid on the MACD calculation itself, giving the user the entry and exit signals and giving the MACD a look that is so popular.
We hope you enjoyed this article on RSI calculation.
If you have any questions, please send an email or leave a comment below.
Trade safe!
Disclaimer: The information above is for educational purposes only and should not be treated as investment advice. The strategy presented would not be suitable for investors who are not familiar with exchange traded options. Any readers interested in this strategy should do their own research and seek advice from a licensed financial adviser.


