
Backtesting is an important part of any strategy development cycle.
It lets a trader look back at theoretical past performance and see if the strategy would have been profitable.
Good backtesting software also displays valuable information, such as equity curves, percentage or profitable trades, and other statistical measures.
Backtesting software’s ease of use makes it even better, which is where TradingView comes in.
They allow users to overlay existing strategies on their charts and backtest how they would have performed in real time.
Let’s look at how to use TradingView to backtest your trades in more detail below.
Contents
What Is TradingView
For anyone who has never heard of them, TradingView is a web-based charting and trading platform to help traders visualize stock, future, forex, and government data on customizable charts.
Users can customize everything from the chart type and timeframe to the colors and indicators.
They also have their own programming language, Pinescript, allowing users to write custom indicators and strategies.
Finally, users can utilize their free data for delayed and end-of-day analysis; or pay for a premium plan/connect with their broker to get live data and trading capabilities.
Why Backtest
Now that everyone knows what TradingView is, let’s look at why someone would want to backtest.
One common protest from people about backtesting is that since it’s all historical data and the markets are constantly changing, the tests don’t indicate profitability.
While it’s true that past results won’t necessarily predict future results, backtesting is a great place to look for if an idea is even viable to forward test.
Would you want to test that live if a trader backtests their strategy and never places a profitable trade? Of course not.
Backtests are also useful for the optimization of an existing strategy.
If a trader already knows their strategy is profitable and is trading it live, backtesting is a great way to see if your risk/reward and entry parameters are at their optimal levels.
Examples of optimizations to make are scaling into or out of a trade, sometimes known as pyramiding, or if stop losses can be tightened up without negatively affecting profitability.
These can be done manually by looking over a chart and searching for trade locations, which is extremely time-consuming.
Ideally, a trader would use software to automatically scan the historical data to spit out a report that shows how the strategy worked, and that’s where we come to backtesting with TradingView.
How To Use TradingView To Backtest
You will need an account with TradingView to backtest; as was stated above, you can do this for free and use their delayed data.
Assuming that you already have an account, let’s jump into backtesting.
The Chart
The first thing you will need to set up is your trading chart.
This chart can have as many indicators as your plan allows, but this is strictly visual since indicators cannot play trades by design.
The next step is to select a strategy to backtest.
Learning pine script will be your best bet if you are looking to backtest something uncommon or custom.
This allows you to write up entry and exit rules that align with your trading plan. You can always hire someone to write it up or even use AI to help produce some mostly usable code.
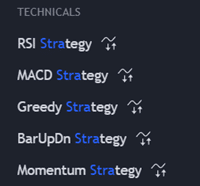
If you use something already existing on TradingView, open the indicators and select a strategy allowing trade executions.
A small wave with arrows underneath it denotes this.
The screenshot on the left shows an example of several strategies and the strategy symbol.
For our example, we will be using the Bollinger Band strategy.
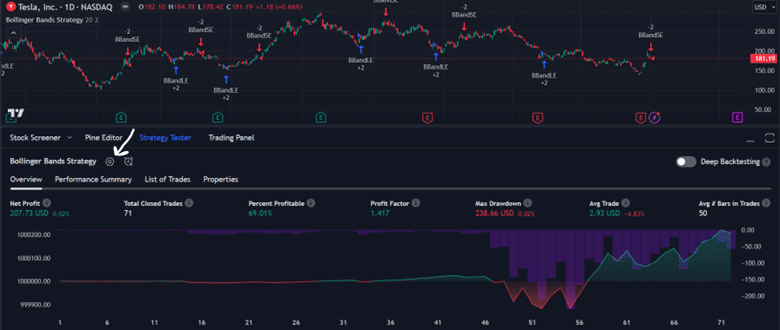
Once the strategy is loaded onto your chart, a window with an equity curve and other performance information will open at the bottom of the screen.
This is the backtesting pane.
Don’t get discouraged because it will have default settings for the backtest when it opens.
Once this is opened, click on the settings button (the button under the white arrow) to open up the strategy settings.
Customizations
This is where the fun starts.
Once in the setting pane, you can access many options.
Inputs: The inputs tab is where you can change the strategy settings. So, that would be the Length and Multiplier/Deviations for the Bollinger Bands. Other strategies will have other options.
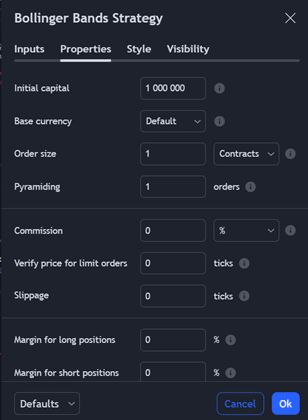
Properties: The properties tab lets you change all your trading-related inputs. TradingView allows you to alter your starting equity, base currency, and order size and method. You can pick a fixed number of contracts/shares, a percentage of the account value, or a flat dollar value per trade. This screen lets you select if you want to break your entry into multiple orders (pyramiding) to help average into a trade. The default is 1, so all in and all out, but you can set this to whatever number you see fit.
You can then set commissions, slippage, and margin percentages, adding realism to a backtest. Finally, outside of the screenshot here, you can set entry requirements, such as intra-bar(bar magnifier), on-bar close, or standard. You can also set up recalculation methods if you want bars recalculated at specific frequencies after a trade is filled, assuming your plan allows it.
Style: The style tab lets us select coloration and/or what data is displayed on the chart. Usually, trade entry/exit, quantity, and strategy names are all selected by default to easily read trade locations on the chart.
Visibility: The last tab is visibility, and this lets you set the timeframe/ranges for which this strategy will appear. This is only relevant if you have a specific entry timeframe.
Results
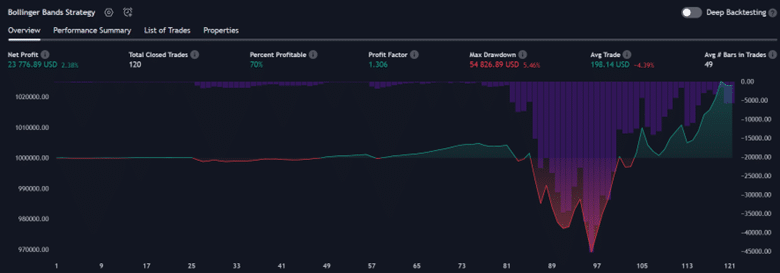
With our sample backtest run (Tesla with 100 shares assuming a .25% commission), you can see the equity curve above in the overview tab.
The red/green line shows the overall profit or loss, and the bars dropping from the top show the strategy’s drawdown.
This information and other basic information are also textually displayed in the header.
Next is the Performance Summary tab, which shows the results with much more granularity.
It will show trade statistics for both long and short, average time in trade, commissions paid, and many other extremely useful information for testing.
A few things to notice are the Sharpe, Sorentino, and profit factors.

Sharpe and Sorentino are statistical measures of how profitable a trade is, taking into account things like volatility and variance.
The profit factor shows how profitable trades were on either the long or short sides. As you can see above, if this strategy had only been long, the odds are it would have fared much better.
This is valuable information for someone looking for optimization.
The last two tabs are the List of Trades and Properties.
The List of Trades is just that: a list of each entry and exit the strategy took.
This can be helpful if you want to go back and match up trades with an existing one.
The Properties tab shows all of the settings from above in one place.
This allows you to look over multiple backtests and see how individual settings helped or hurt performance.
Additional Features
Everything discussed above is available to the free plan at the time of writing, but TradingView also offers some additional backtesting features for paid plans.
The first of these is the “Deep Backtest” mode.
Where the free mode is just the visible bars on the chart, Deep Backtesting allows the user to select a range of times to backtest over.
This makes it more customizable and allows more data to be brought into a test.
The other paid feature worth noting is in the recalculation section discussed earlier.
They have a “bar magnifier,” which is just the ability for the backtest to execute trades inside a larger bar with tick data.
For instance, our backtest was run during the daily timeframe.
The bar magnifier would have allowed this to execute exactly when the Bollinger Band was crossed instead of just using the bar data on the screen.
Both of these settings add to the reliability of the backtest but are far from required for a backtest to be valid or useful.
These are just some extras that would be worth it if you are in the late stages of strategy development.
Backtest Complete
Backtesting is vital in creating and optimizing trading strategies, providing examples of how it would have traded over historical data.
TradingView’s web-based platform and free historical data can be a great place to test a simple strategy.
If you are finding success with the basic data, you can always upgrade to gain access to more advanced features and chart types to continue refining your strategy.
Even if you stay with the free account, TradingView is a great platform to learn to backtest your trades.
We hope you enjoyed this article on backtesting with TradingView.
If you have any questions, please send an email or leave a comment below.
Trade safe!
Disclaimer: The information above is for educational purposes only and should not be treated as investment advice. The strategy presented would not be suitable for investors who are not familiar with exchange traded options. Any readers interested in this strategy should do their own research and seek advice from a licensed financial adviser.


