


Contents
- Chart Types and Time Frames
- Available Indicators
- Data Data Data
- Customization
- Price
- The Cons
- Sierra Chart: The Verdict
Sierra Chart is a professional grade charting software that allows users to have complete control over their setup and look.
While some traders shy away from its learning curve, it will be the only platform you will want to use once you get the hang of it.
Chart Types and Time Frames
Sierra Chart offers a plethora of chart types, and it completely depends on your trading style.
Below is a list of all the chart types:
Line Chart – This is pretty basic. Each price is displayed as a line on the chart.
This is commonly displayed on any of the financial news shows as the last price.
OHLC Charts – OHLC bars are also a common form of a chart.
It has a tick to the left where the candle opens and a tick to the right where the candle closes. In addition to the standard OHLC bars, you can select from a few variations, such as HL Bars and HLC bars.
Volumetric Bars – Sierra also offers a few bar types based on volume. You can Select price volume bars where the candle width depicts how much volume made up the candle. You can also select candlestick bars with color variations based on how intense the volume of the candle is.
Renko and PnF Charts – Sierra Charts also comes with the ability to plot both Renko and Point and Figure Charts. These are both calculated outside of traditional bar calculation methods and are typically considered “premium” chart types by most platforms; they are standard on Sierra Chart.
Candlestick Charts – Sierra, of course, comes with the so common candlestick charts. These need no real description. Sierra offers volume-based as well as time-based bars.
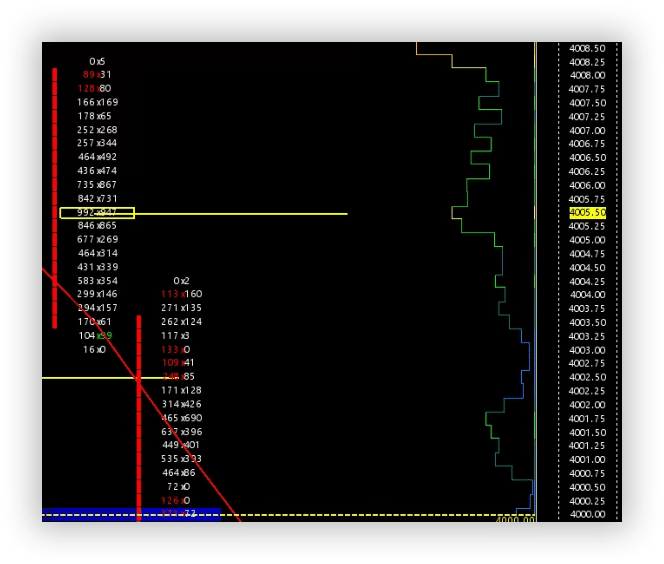
Footprint Bars – The footprint bar is a volume-based bar type that shows you the transactions at each bid and ask price. It is the definition of reading the “order flow” of the market because you can see exactly how much bid and ask volume happened at each price. It is a visual representation of the tape. Below is an example of my personal chartbook’s footprint chart for the ES (S&P 500 futures). As you can see, a significant amount of data is displayed, and it is almost overwhelming if you are unfamiliar with it.
Sierra Charts also comes with multiple ways to delineate the data on the charts.
It comes with standard time-based charts.
The times range from 1 second all the way up to multiple days.
You can select the exact amount of time you want the candle to be in an xx-xx-xx format, that is, hours-minutes-seconds.
So it allows for extreme customization in time-based charts.
They also offer the standard volume per bar option, where you can select the number of contracts you want each bar to be.
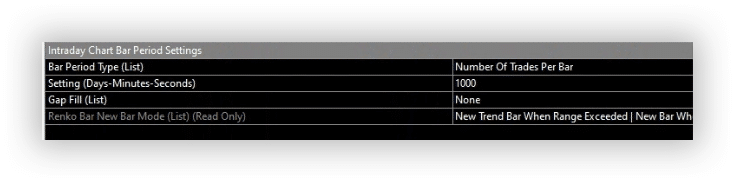
In addition, they offer several options for traders looking to use non-standard bar times.
You can use the Point and Figure time setting with the point and figure chart type, Renko as a volume type to use with the Renko chart time and range-based bars so that you can get a new bar after X number of ticks or points in one direction.
A few other bar types are the Monthly charts for some longer time frame analysis; the price changes per bar, which allows a new bar to form after X amount of price changes regardless of how many points it has moved in either direction.
Finally, there is my favorite bar time, and that is the number of trades.
This setting has a new bar form after X number of trades hit the tape, regardless of how many contracts are in each trade.
The benefit to this type of chart over, say, volume or time is that when the market is moving, you get more candles and setups, and when the market is slow, the opposite happens.
It really allows you to gauge the market condition.
Available Indicators
Sierra Charts continues to allow for unlimited customization with the indicators in its platform.
It comes with all of the standard indicators you would expect in the platform: Moving Averages, Oscillators, The MACD and RSI, and plenty of variations on each.
Sierra stands out above the rest because they also have volume-based indicators built in, such as Pace of tape, bid vs. ask volume, and many more.

In addition to the hundreds of built-in indicators for Sierra, there is a thriving community of developers and businesses that have custom indicators for Sierra Charts.
Many are available for free through Sierras’ website, and many you have to pay for if you can think it up; it has probably been coded for Sierra Chart.
And if by chance it hasn’t, many developers work with ACSIL (the language behind the indicators) to help you create it and apply it to your charts.
The immense amount of flexibility and customization is why many Prop shops and professional traders worldwide trust Sierra.
It does not have the marketing arm that some other platforms have, but that is because all of the money itself is returned to the platform.
Data Data Data
One major drawback to Sierra is the data requirement.
Unlike some other platforms, data fees are incurred separately from the platform.
You will need to have a brokerage account linked to your Sierra Chart account to qualify for non-professional fees, and you need to log into it at least once a month.
It should be noted you do NOT have to place a trade.
You just need to show you still have an open brokerage account.
Once your brokerage account is linked, you can purchase the data feed through Sierra Chart by using their Denali Data Feed.
This is a direct feed from the CME, COMEX, NYMEX, and CBOT and comes with full depth of book, market by orders (showing standing offers all the way up and down the book), and lightning-fast execution over their Teton Order Routing system.
You can also link it to most current brokers if you want to use data from, say, Interactive Brokers.
You can also activate the Nasdaq TotalView data feed to chart equities data using all of Sierra’s advanced features.
TotalView offers a full depth of book for all Nasdaq traded equities, which makes higher timeframe analysis a breeze.
Customization
Sierra Chart’s largest attraction is the granularity of customization that is allowed.
You can see from all of the options listed above that there are endless ways to configure your charts through Sierra.
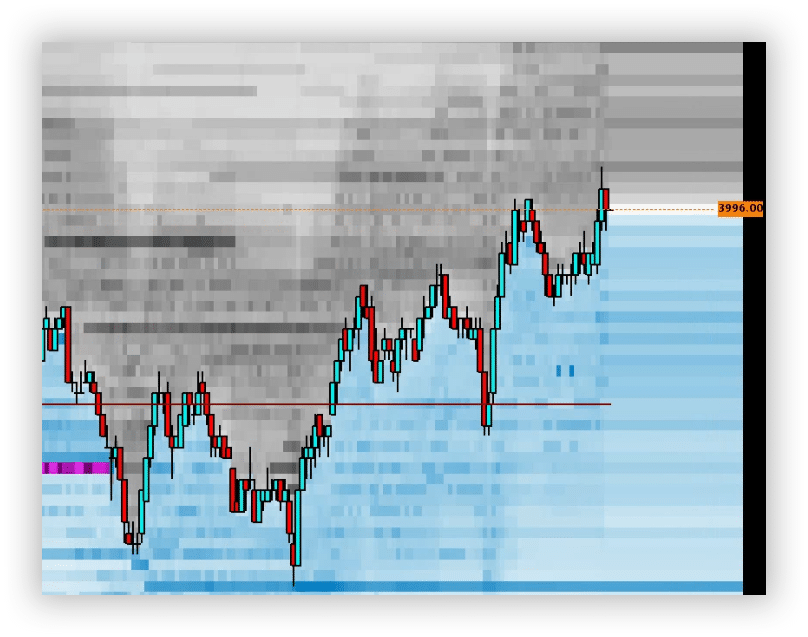
If you want to trade liquidity and use a heatmap style of chart(something similar to Bookmap), you can do that through Sierra.
If you are a DOM trades, then Sierra has something for you as well.
You can open up a Trading DOM and customize it to have volume traded, delta at price, volume at price, recent volume, and many other metrics.
Sierra is truly a one-stop shop where the only limit on what your chartbook looks like is how creative you can get.
Price
Sierra Chart will have two costs associated with it on a monthly basis:
The first is the platform fee which ranges from $36 a month to $56 a month depending on the depth of features you require.
These packages also include connectivity to the Sierra Denali exchange feed or any other supported data source.
They also have two packages for $26 and $36 a month, but this does not include connectivity.
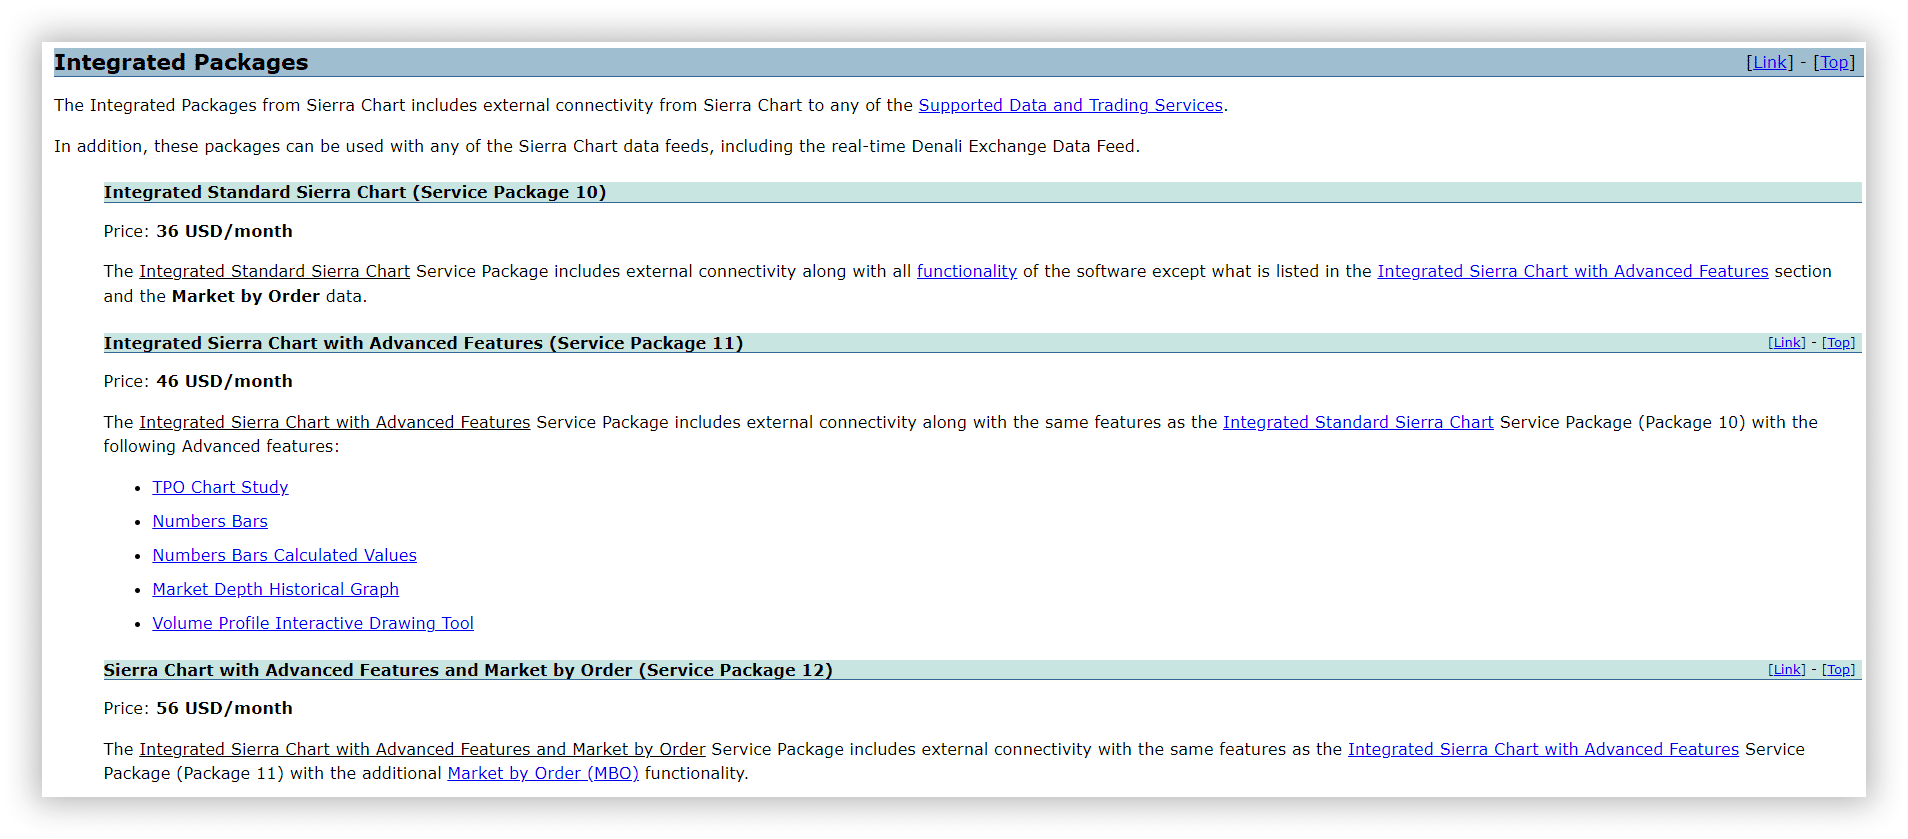
In addition to the platform fees, you will also incur data feeds to get real-time data for your charts.
The most common use of Sierra Chart is for Futures trading, so I have included the $33.00/month data fee that is available for full-depth futures data.
If you are looking to chart equities, you do not need to have a funded brokerage account, and the fee drops to $16/month for full-depth Nasdaq equities.
Unfortunately, data is required in addition to the platform if you want to use Sierra Chart.


The Cons
So all of the pros of Sierra Chart are discussed above, but what about the cons?
Well, this great software has a few drawbacks; the first is the learning curve.
Sierra takes quite a bit of time to become proficient.
You will be able to use it within a day, but you can expect a few weeks of frustration while you figure out where each menu leads and what everything is called.
This isn’t an issue if you plan on using it to its fullest, but if you are just going to be casual about it, then it may be a waste of time.
You can manipulate quite literally everything in Sierra Charts.
That level of control takes some time to master, but it is worth it if you are going to use it daily.
Another con of Sierra Chart is that it is mostly a futures software.
They do have the equities Datafeed, which is great, but if you are looking for something to replace Trandingview or Trendspider, this is not yet.
They are constantly updating the software and capabilities, and in the 3+ years I have been using it, it has become increasingly friendly to equities.
But it is still not 100% there.
Finally, there is the cost.
Depending on your data and charting needs, you can expect to pay $70-$120 a month.
While this is a worthy expense for such versatile software, it may be intimidating to newcomers.
Sierra Chart: The Verdict
So what’s the verdict with Sierra Chart?
Is it quality software?
Is it useful to traders?
Should spend time learning and getting set up?
The answer to all of these is: Absolutely! Like all answers, this one is also not cut and dry.
If you are or plan on being a serious trader, Sierra is 100% worth the time and effort to get set up and running.
If you trade futures, it is a must-have as it blows other futures software out of the water.
With equities, it is still extremely useful, but you can expect the software to grow into the equities market in the coming months/years.
We hope you enjoyed this review of Sierra Chart.
If you have any questions, please send an email or leave a comment below.
Trade safe!
Disclaimer: The information above is for educational purposes only and should not be treated as investment advice. The strategy presented would not be suitable for investors who are not familiar with exchange traded options. Any readers interested in this strategy should do their own research and seek advice from a licensed financial adviser.


Absolutely, Sierra Chart is worth every penny. Its documentation is bit intimidating.
Thanks Sajith. I value your opinion so that is good to know you are a fan.