


This Barchart review is going to be a long one.
There are so many features in Barchart.com to accommodate the full spectrum of different types of investors and traders.
There are several levels of features.
- No account, no login
- Free account
- Barchart Premium
- Barchart Trader
Contents
- Barchart Features With Free Membership Account
- Barchart Free Features
- Features With Premium Membership Paid Subscription
- Barchart Trader
- Interactive Charting
- Comparative Analysis
- Mobile Friendly
- Indicators Galore
- Sector Analysis
- Industry Heat Map
- Stock Screener for Fundamental Investors
- Stock Screener for Technical Analysts
- Lists
- Portfolios
- Alerts
- Premier Membership
- Option Screener From Barchart
- Grid View
- Top Picks
- Some Negatives of Barchart
- Top Wish Features
- Conclusion
Barchart Features With Free Membership Account
Barchart.com already shows lots of basic information without needing to create a free account.
The equities, indices, and ETFs are 15 minute delayed.
Futures and Forex are 15 minute delayed.
Options data is at least 15 minutes delayed.
But by creating a free membership account and enabling CBOE BZX real-time, you get real-time charts for equities, indices, and ETFs. (The other data are still delayed — even with Premier membership.)
A free account is also needed to:
- get alerts
- use screeners
- save customizations, chart templates, watch lists, portfolios
Barchart Free Features
For fundamental investors:
- news and headlines on individual symbols
- market, sector, and world indices
- fundamental data including income statement, balance sheet, SEC filings
- stock screener
For option investors:
- option chain with implied volatility data
- unusual options activity
- options IV rank sorter
For swing traders:
- Barchart technical rating
- Price and volume leaders
- 52-week highs and lows
- earnings info
- candlestick pattern screener
For day traders:
- Intraday candles of any minute timeframe
- VWAP indicator
- Extended hour data
- Gap up/down and price surprises
- Hot penny stocks list
- Market Internals: $TICK, $TRIN, advance/decline
And there are a lot more not listed.
Features With Premium Membership Paid Subscription
- No more ads
- Top stock picks with trading signals
- Grid Charts view
- Download historical price data
- more advance stock and options screeners
- ability to run screener on your watch lists
Barchart Trader
Barchart Trader is a free downloadable app but requires a login that is subscription (separate from Premium membership).
This provides for:
- Connect to your certain brokerage account
- Time and Sales panel
- Tick Chart
Interactive Charting
Now let’s look at some of the basic features that are available with the free membership.
Here is a popped-out interactive chart showing Bollinger bands, exponential and simple moving averages, RSI indicator, and with earnings and dividend dates turned on.
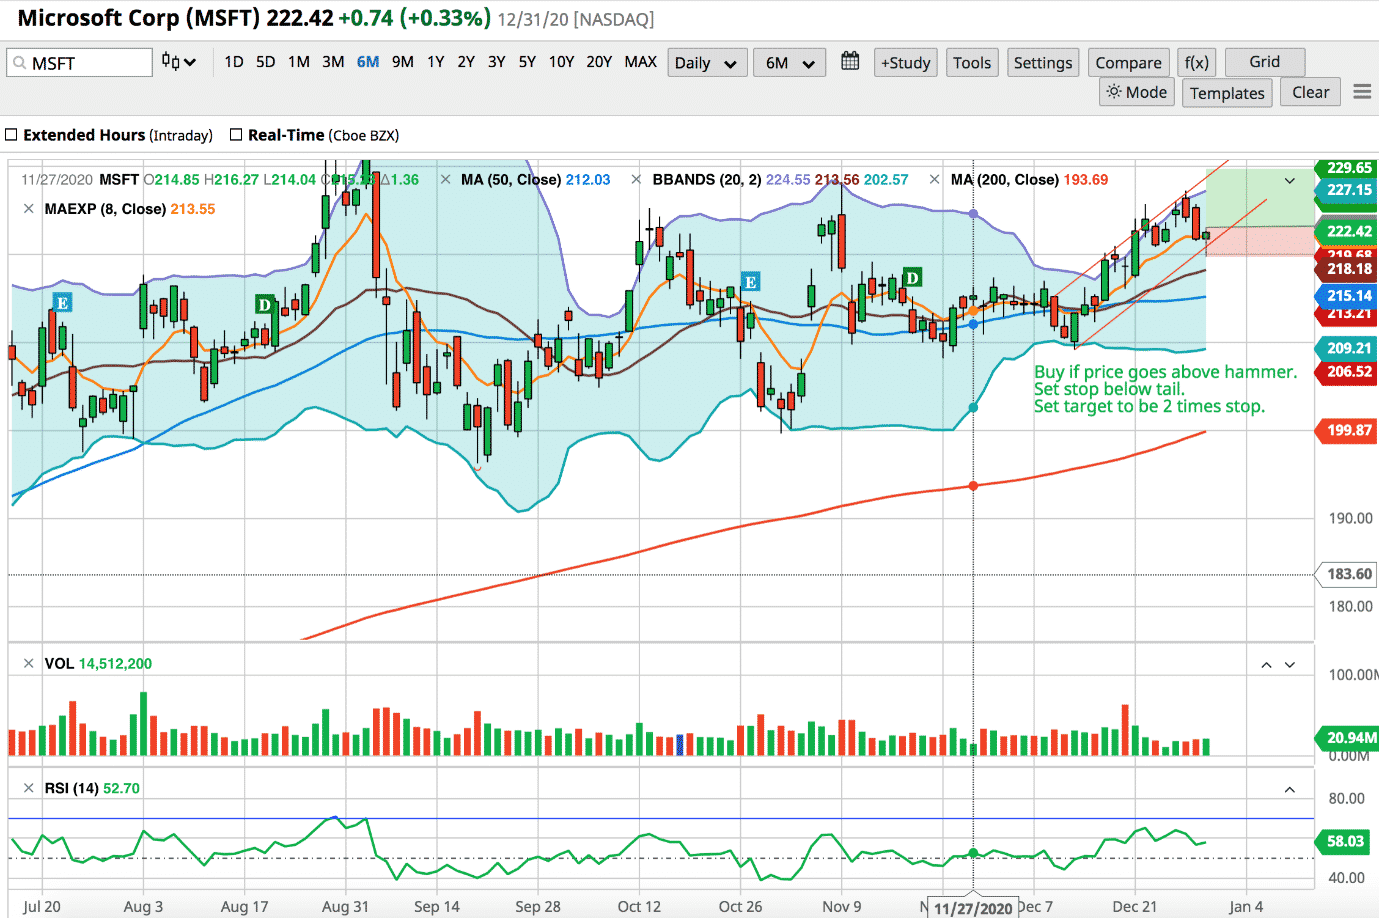
Using their drawing tools, I’ve drawn in a trend channel and wrote note with a trade plan that includes target and stop placement for a possible trade.
You can draw support/resistance, Fibonacci, Gann, pitchfork, etc.
For those who like dark theme charts, you there is a mode button that toggles between light and dark theme.
I can pan the chart by dragging.
I can zoom by dragging the vertical and horizontal scales.
Or I can use the calendar to jump to any date range in the past.
I can save multiple custom chart templates.
Comparative Analysis
I can use charts for comparative analysis or study stock strength relative to the market.
Here we see KO (Coca Cola) is under-performing relative to the S&P500 benchmark, while its competitor MNST (Monster Beverage) out-performed during the same nine-month period.
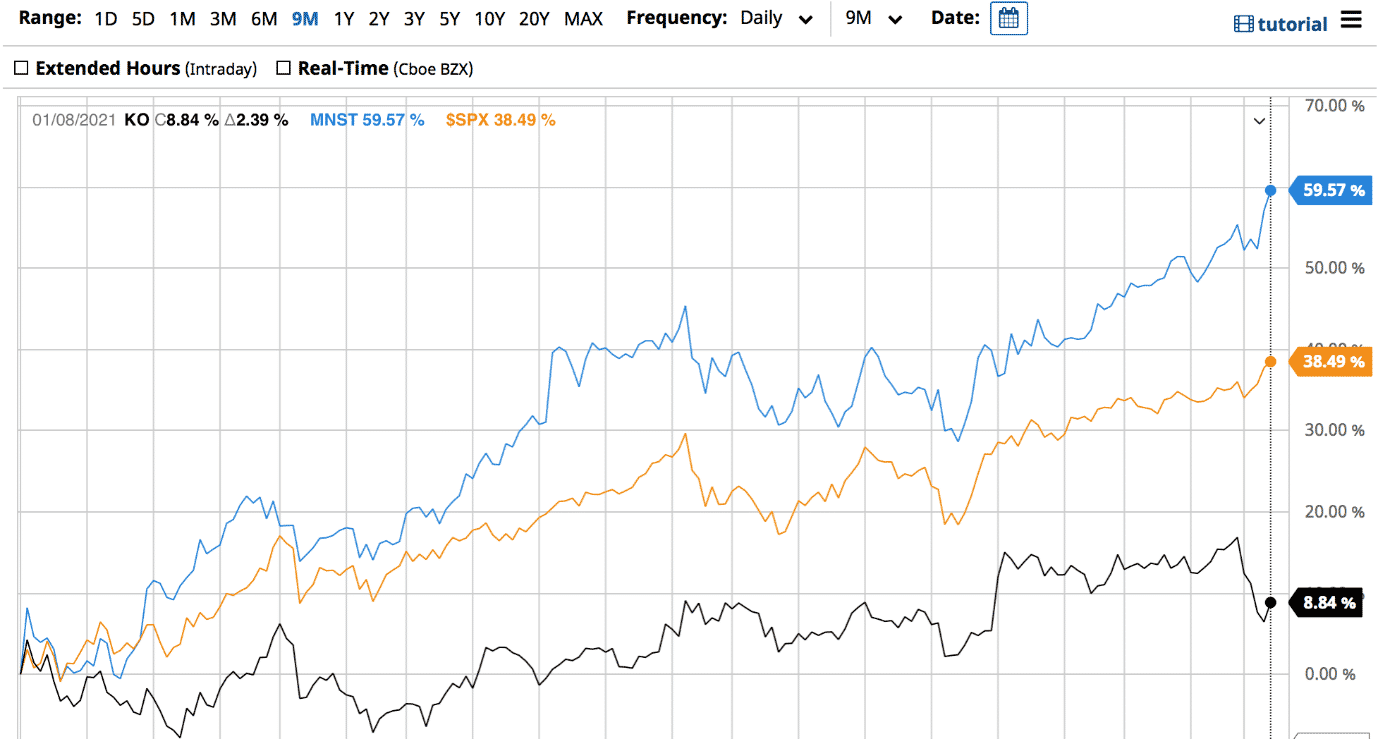
Didn’t know that Monster Beverage is a competitor of Coca Cola? That information can be found in the competitors section of Barchart.
Mobile Friendly
Barchart is mobile friendly.
I can view the chart on my phone in landscape or portrait, and can even use the chart drawing tools.
Indicators Galore
I can add a whole array of indicators to my charts, which they call studies.
There are of course the usual ones:
- simple, exponential, and hull moving averages
- RSI
- MACD
- Bollinger bands, band width, and Bollinger %B
- Accumulation/Distribution
- Chaikin Money Flow
- Average True Range
Plus some lesser used ones:
- Volatility Stops
- ADX
- Donchian and Keltner Channel
- Parabolic SAR
And there are the more esoteric ones:
- Force Index
- Ichimoku Clouds
- William’s Percent R
There is Barchart’s own computerized trend analysis study known as the TrendSpotter.
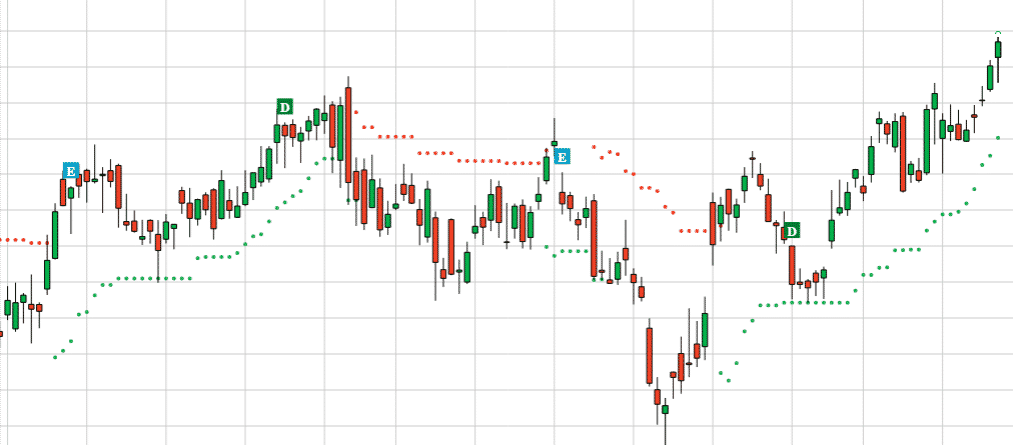
One green dot below candle indicates support in a bullish trend.
One red dot above candle indicates resistance in a bearish trend.
Candles with both green and red dot indicates neutral trend bounded by both support and resistance.
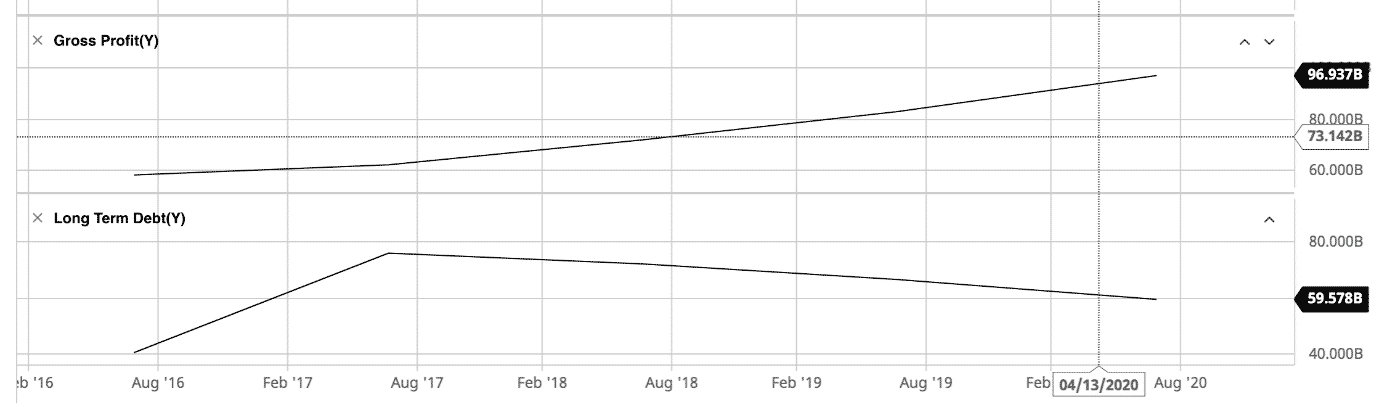
There are also fundamentals indicators (or studies).
Here it is showing that gross profits are rising and long-term debt decreasing over the years.
Now, that’s a company that I would like to own a part of.
Many more indicators are available. See full list.
Sector Analysis
I can monitor sector rotation and see if money is flowing into defensive sectors or into growth sectors.
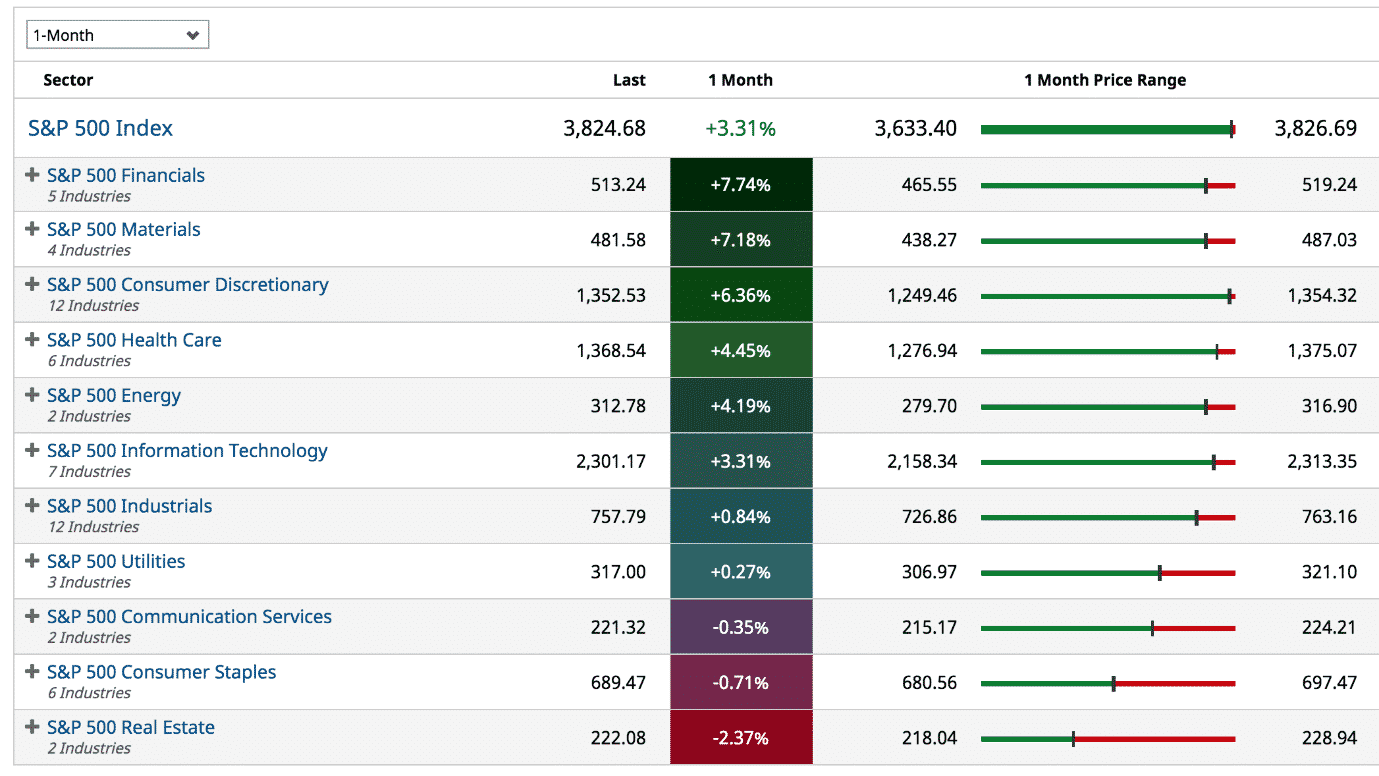
Here, I see that for the past month, the financials are doing well and real estate is not.
I can go to ETF by Asset Class to find a financial ETF.
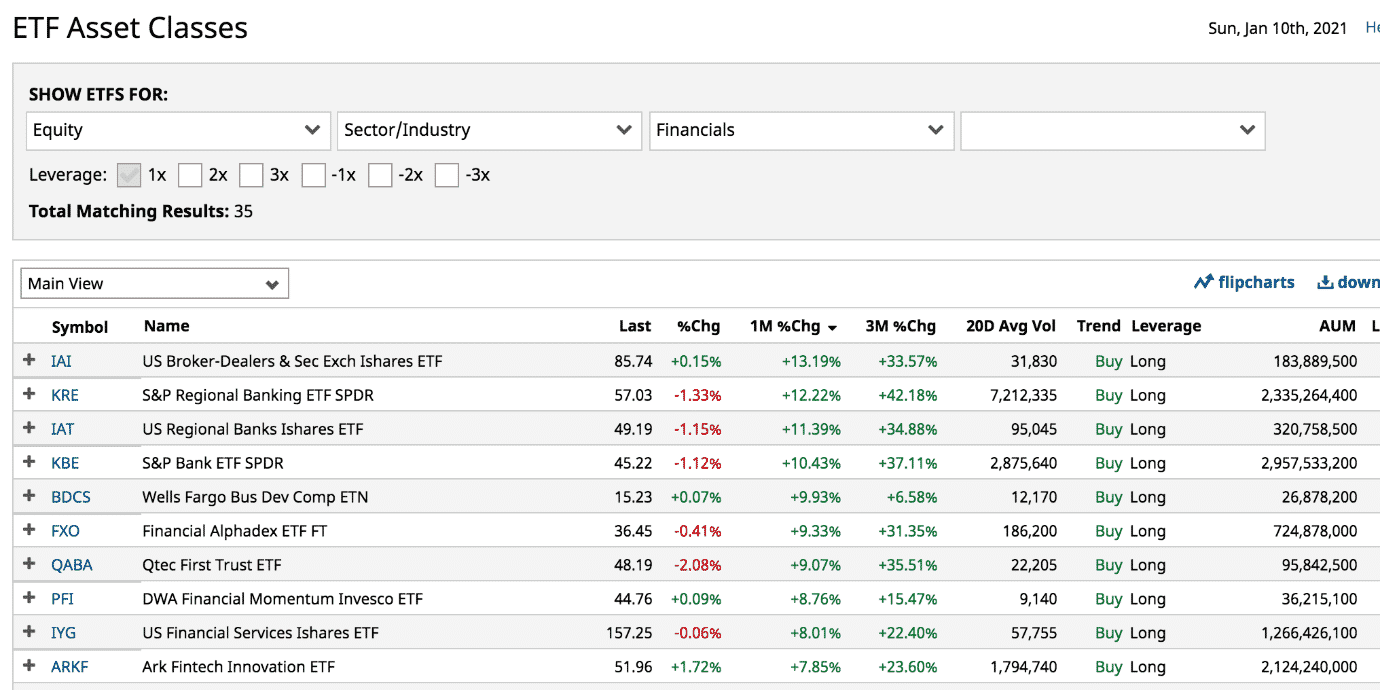
I unchecked the leverage checkboxes because I didn’t want 2x and 3x leverage ETFs.
However, I don’t mind using the -1x checkbox to find an inverse ETF for Real Estate.
Industry Heat Map
Here I can see which industries are leading and lagging.
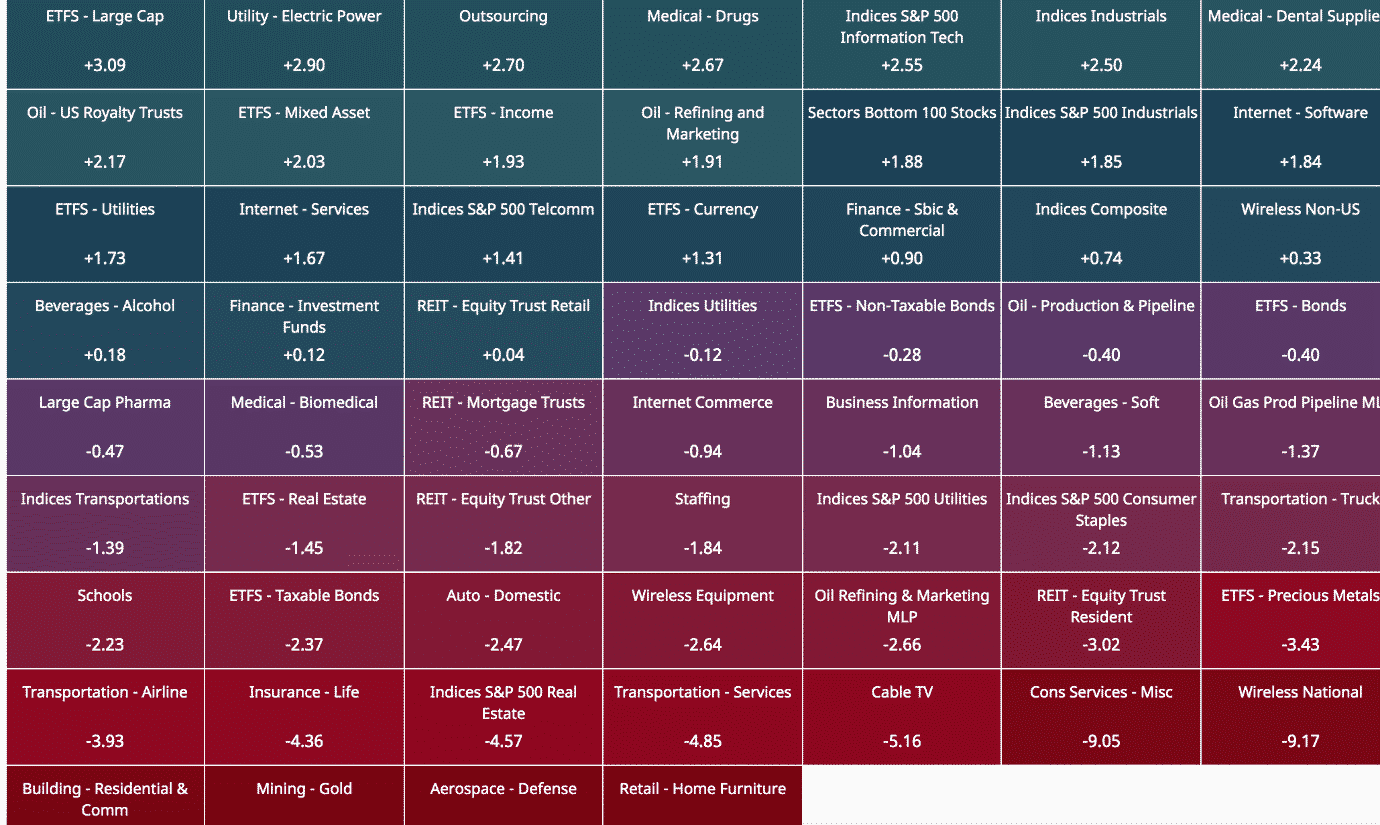
Clicking on a box will give me some stocks in that industry.
Stock Screener for Fundamental Investors
To find company with good fundamentals, I’m using Barchart stock screener to filter for medium to large size companies with stock price greater then $20 and have high growth rates.
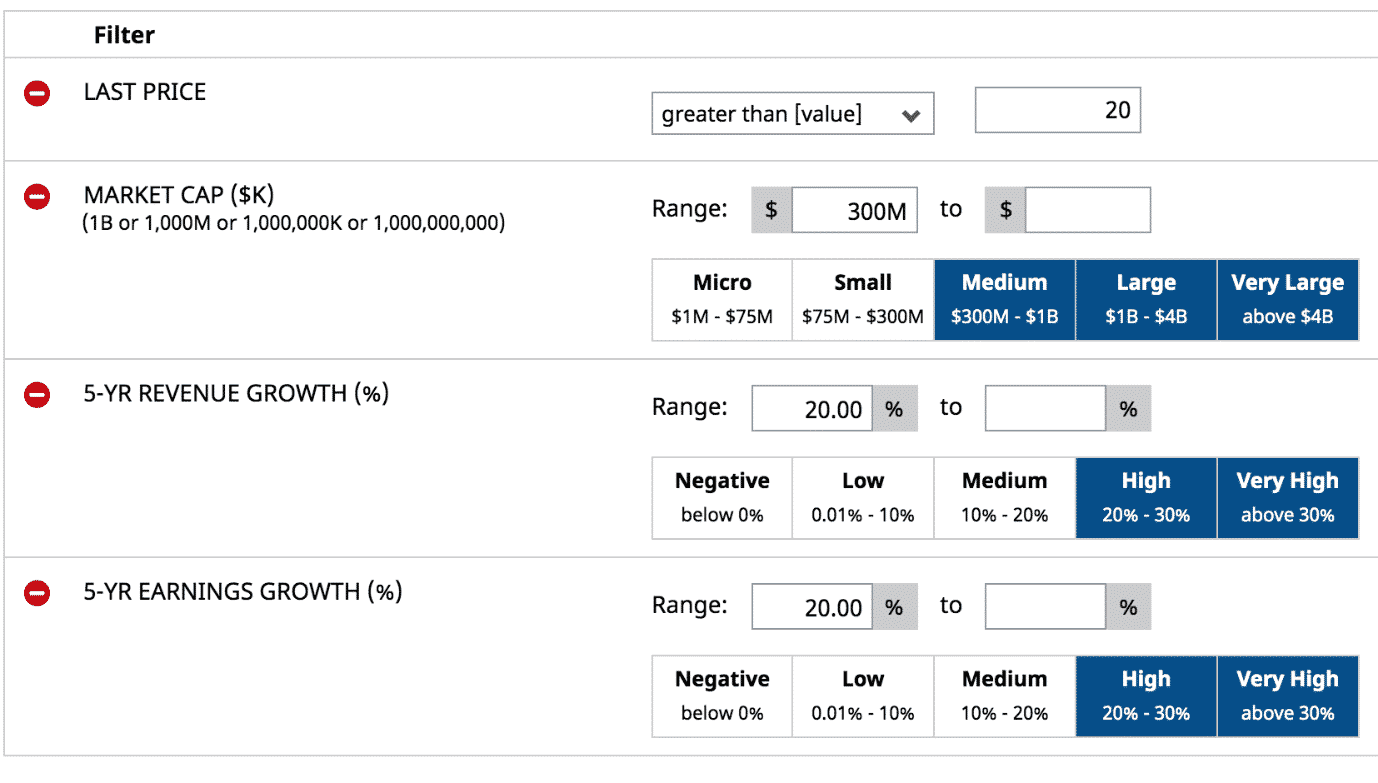
If I don’t like the default columns of the results, I can set up my own custom view with a variety of metrics and apply that to the result listing.
Below, I’ve created a custom view in order to see metrics of interest to the value investor.
The results can be sorted by any column.
Stock Screener for Technical Analysts
For investors that care more about technicals, there are screeners for that too.
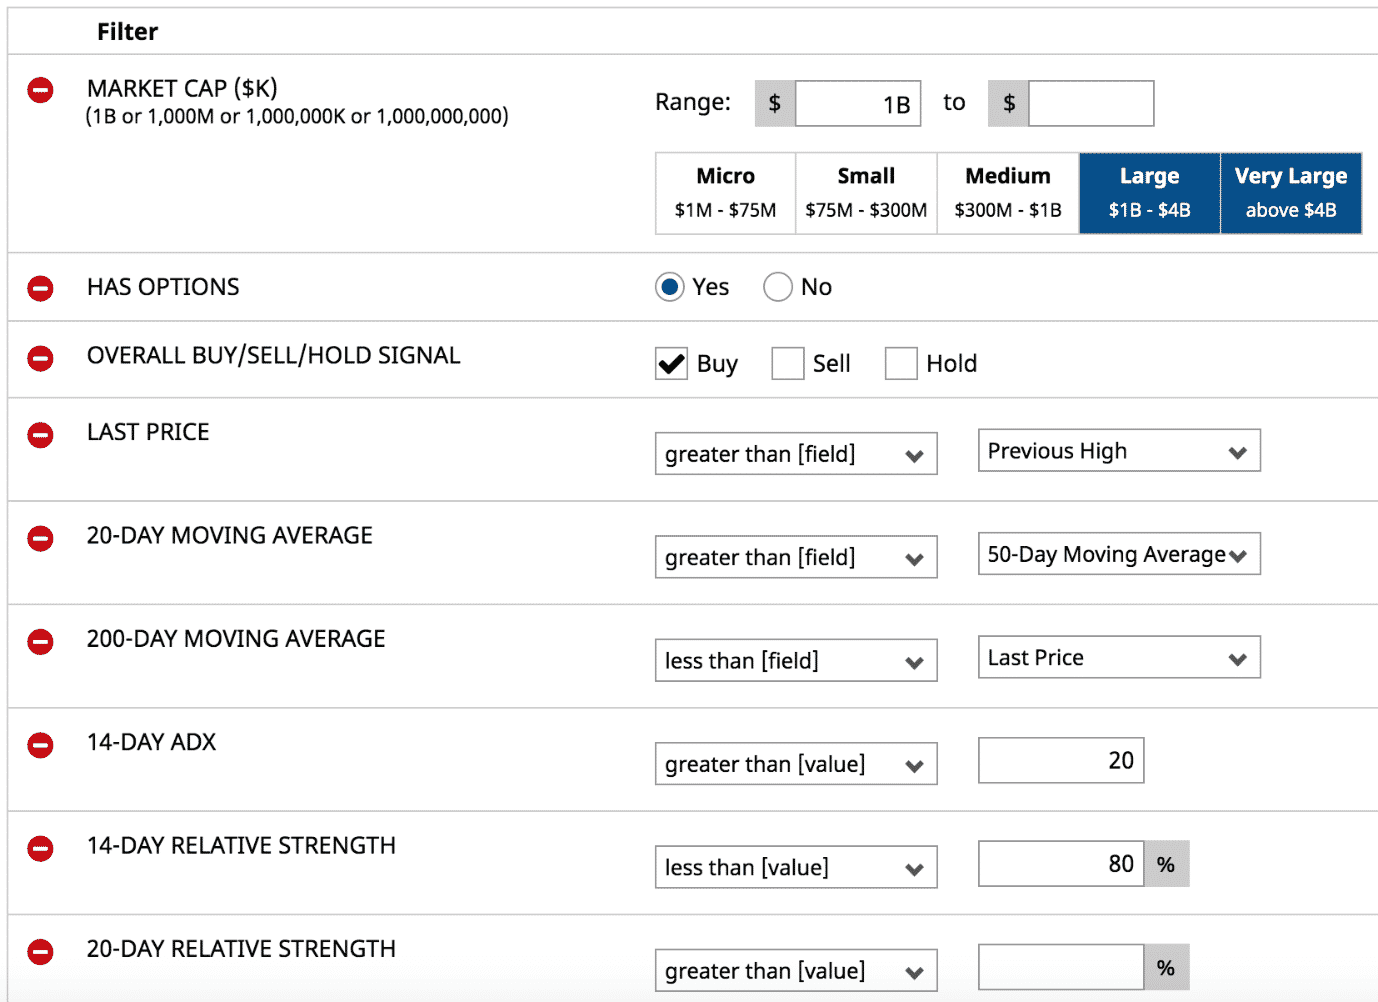
Here, I am searching for bullish large cap stocks that Barchart Opinion had rated as a Buy and that has options available.
Barchart Opinion is an algorithm that looks at technical indicators to give buy or sell ratings.
In the screener, I’m filtering for stocks whose:
- price is higher than yesterday’s candle
- short term 20-day moving average above the longer term 50 moving average
- price has to be above the 200-day moving average (to avoid bearish stocks)
- 14-day ADX indicator above 20 to show that stock is in a trend
- and 14-day RSI below 80 (not overbought and has room to move up)
I’ve intentionally left the 20-day RSI blank.
The screen is not going to filter on that.
It is already filtering on the 14-day RSI.
The reason I include the 20-day RSI is so that I can compare it with the 14-day RSI in the filtered view of the results…
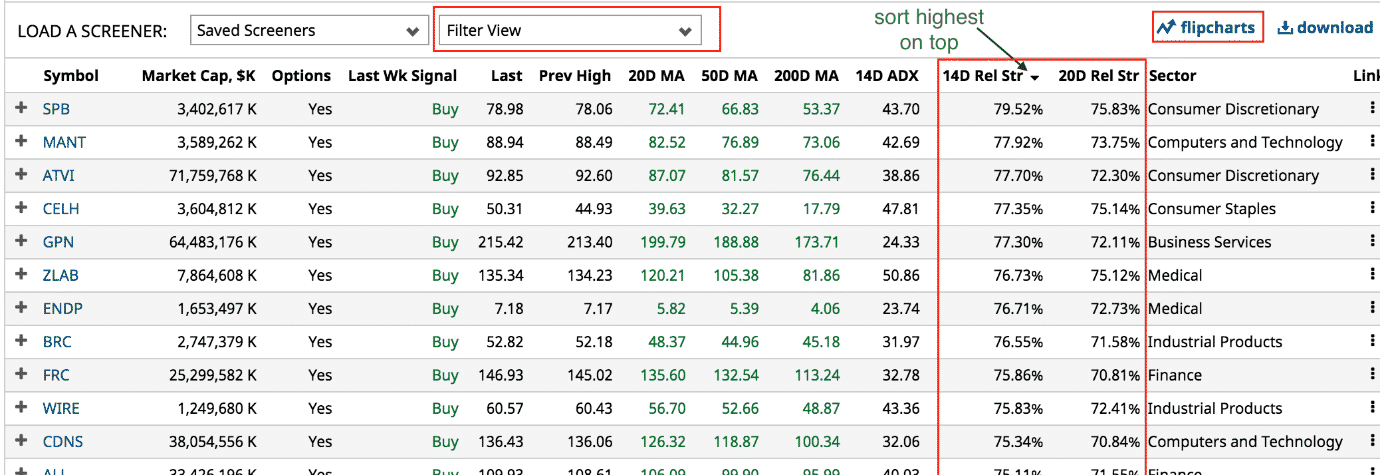
If the shorter-term RSI is higher than the longer-term RSI, then I know that RSI is trending up.
Clicking on flipcharts allows me to use arrow keys to flip through the results rendered in a chart template that I’ve previously saved:
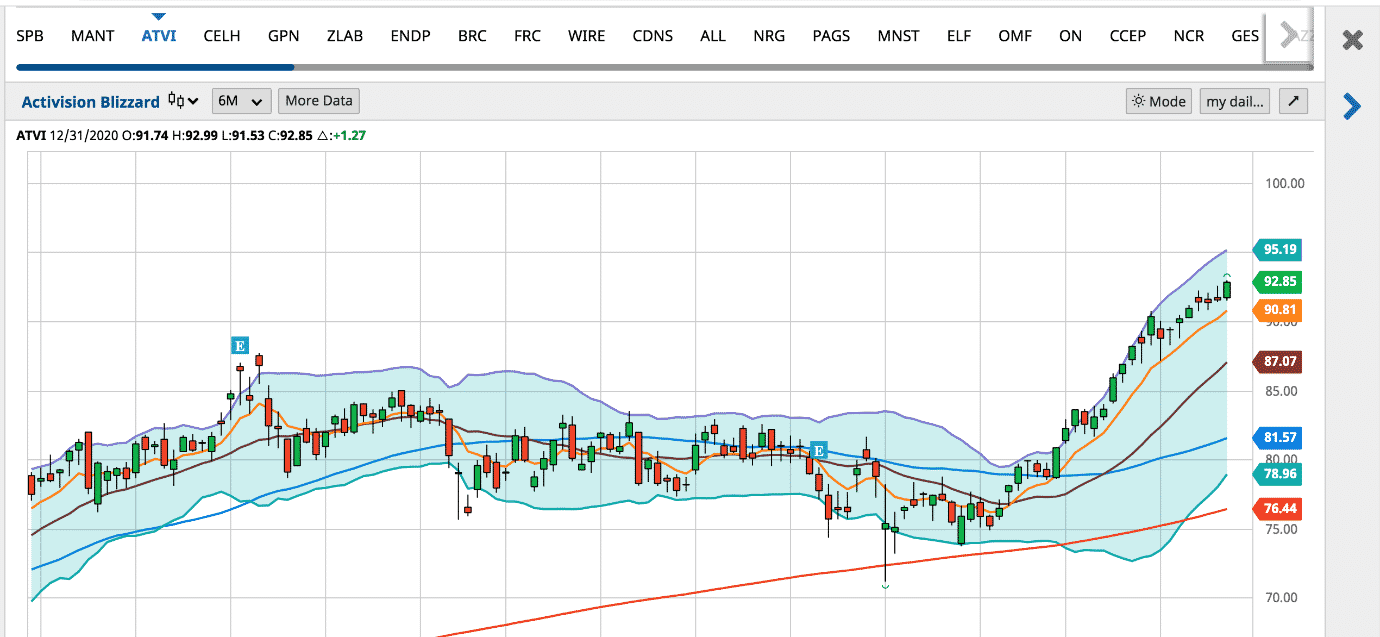
Or I can jump by clicking on the ticker symbol in the top ribbon.
Interestingly, the stock screen has ability to screen based on candlestick patterns.
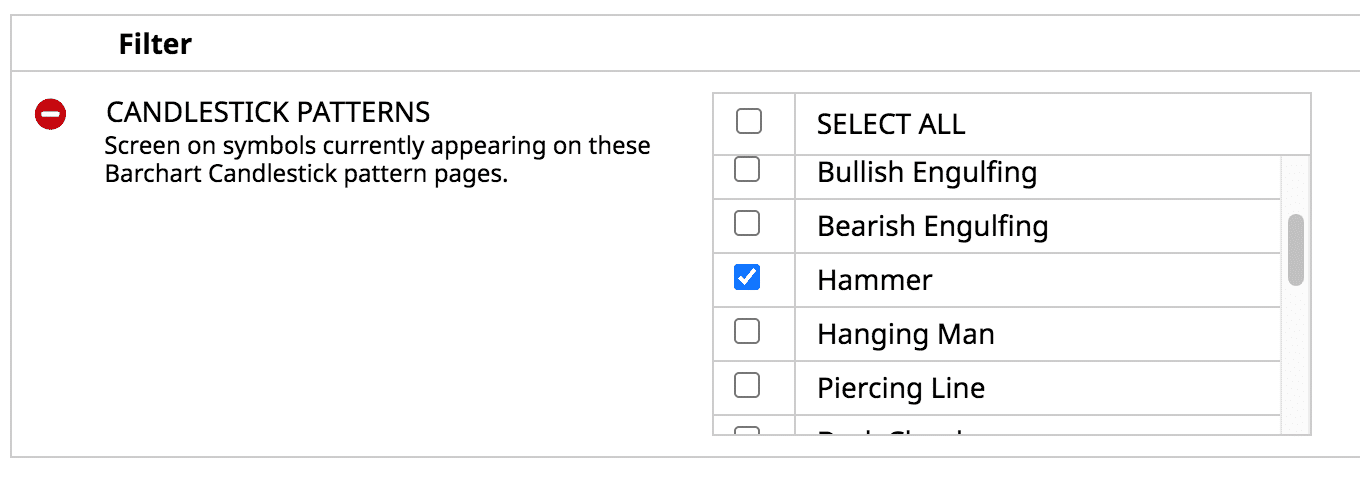
I can then save this as custom stock screener.
Barchart also has its own built-in screeners.
Lists
For quick trade ideas without screening, Barchart have the following lists available:
- Gap ups and downs
- Percent Change up and down
- 5 day gainers
- Earnings within 7 days
- and more
Portfolios
In Barchart, I’ve created a custom portfolio to paper trade the Dogs of the Dow strategy for year 2021.
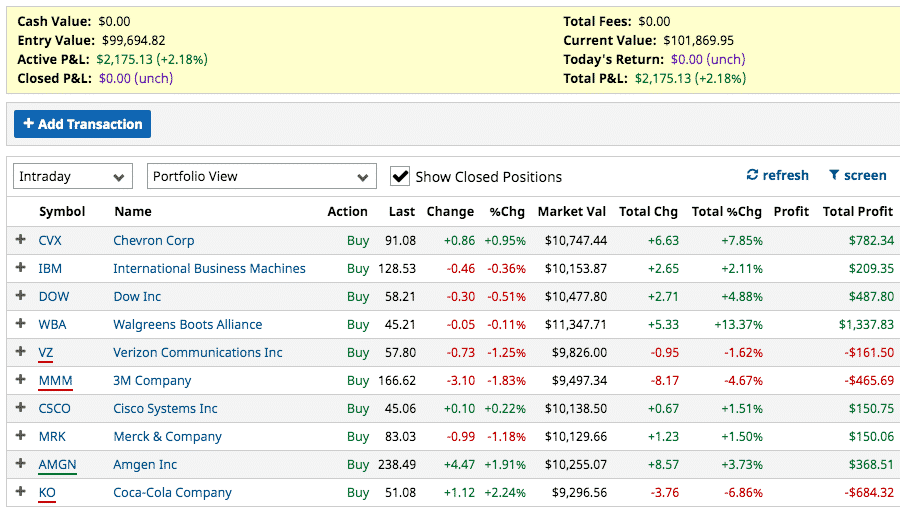
I can add transactions of entry and exit price after the fact.
It will show the Total P&L, including the active and closed positions.
Here I’ve set a low price flag of $170 on symbol MMM.
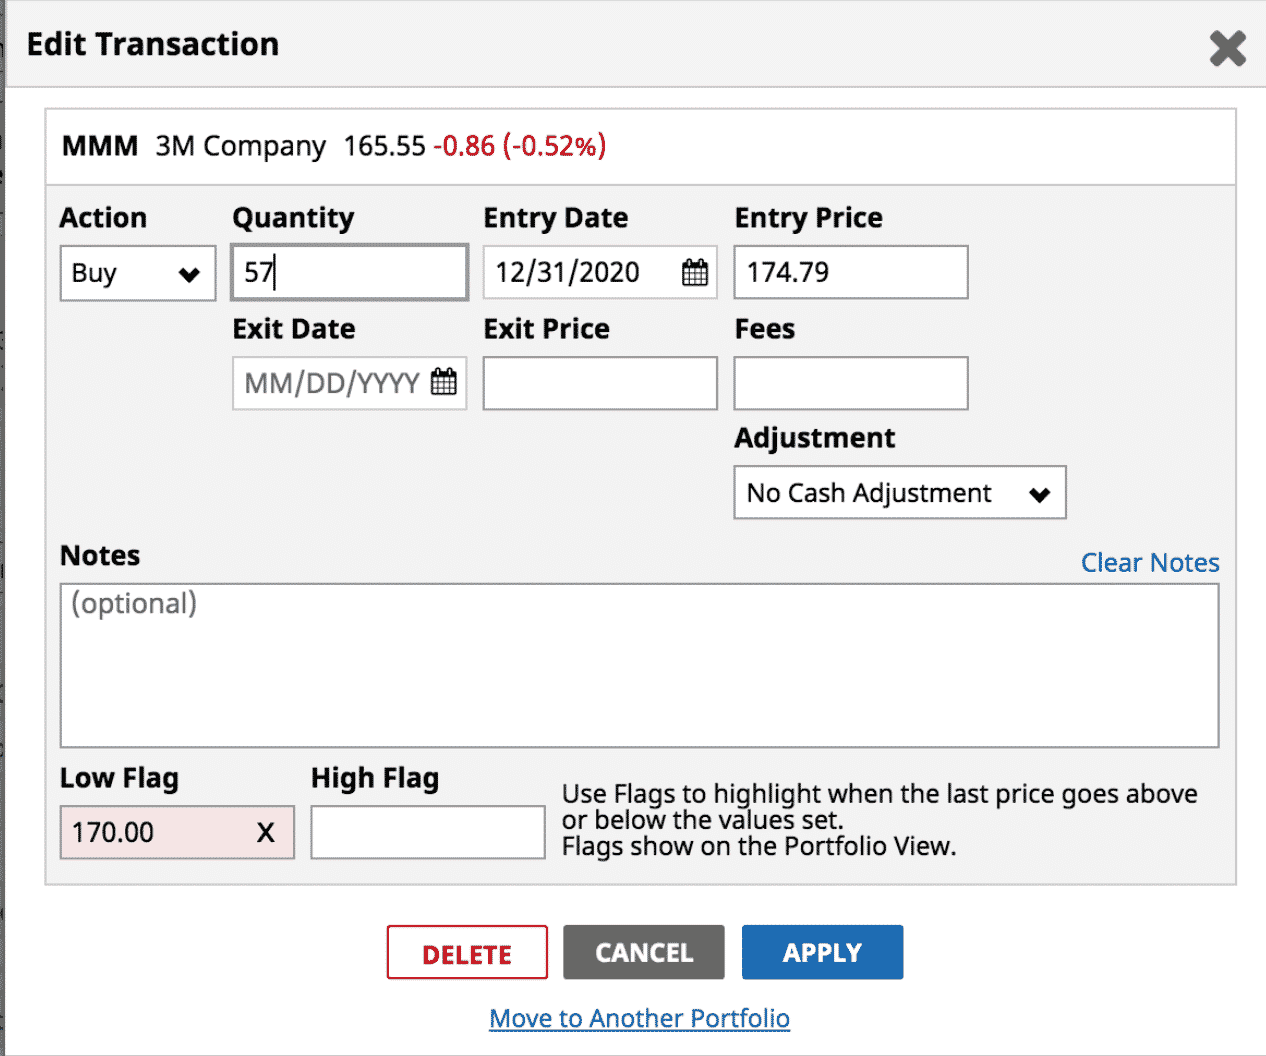
Since price is currently below $170, MMM is underlined in red to make it easier for me to spot.
I also noticed that VZ and KO had also dropped below the flag price that I’ve set for them.
AMGN is underlined in green because it is above the high price flag that I’ve set.
I need to check if it is time for me to take profit on it.
Alerts
Flags are only for portfolio.
If you want to be emailed whenever price exceed or drops below a certain price for a symbol, use Alerts.
With the free membership, you get only one price alert per symbol. That’s still pretty good though.
Premier Membership
Now we will look at the features that are available with paid Premier Membership subscription.
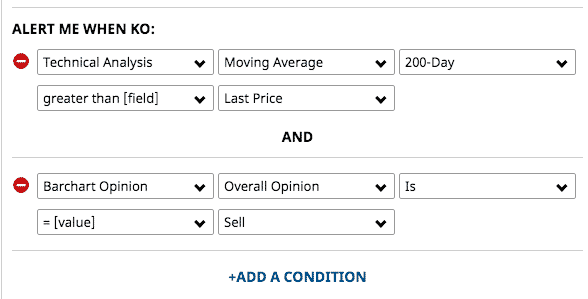
With Premier, you get multiple alerts per symbol, so that you can set a high price and a low price.
You get SMS text alerts as well as more sophisticated triggers.
For example, this alert will trigger if price drops below the 200-day moving average and when Barchart’s algorithmic opinion is a sell.
You’ve seen the number of metrics that you can use in the free screeners.
With Premier paid subscription membership, you get additional more powerful screening capabilities, plus that ability for Barchart to automatically run your custom screens and email them to you twice a day.
Option Screener From Barchart
While a basic option screener is available for free members, option investors will need the Premier screener in order for it to be of value.
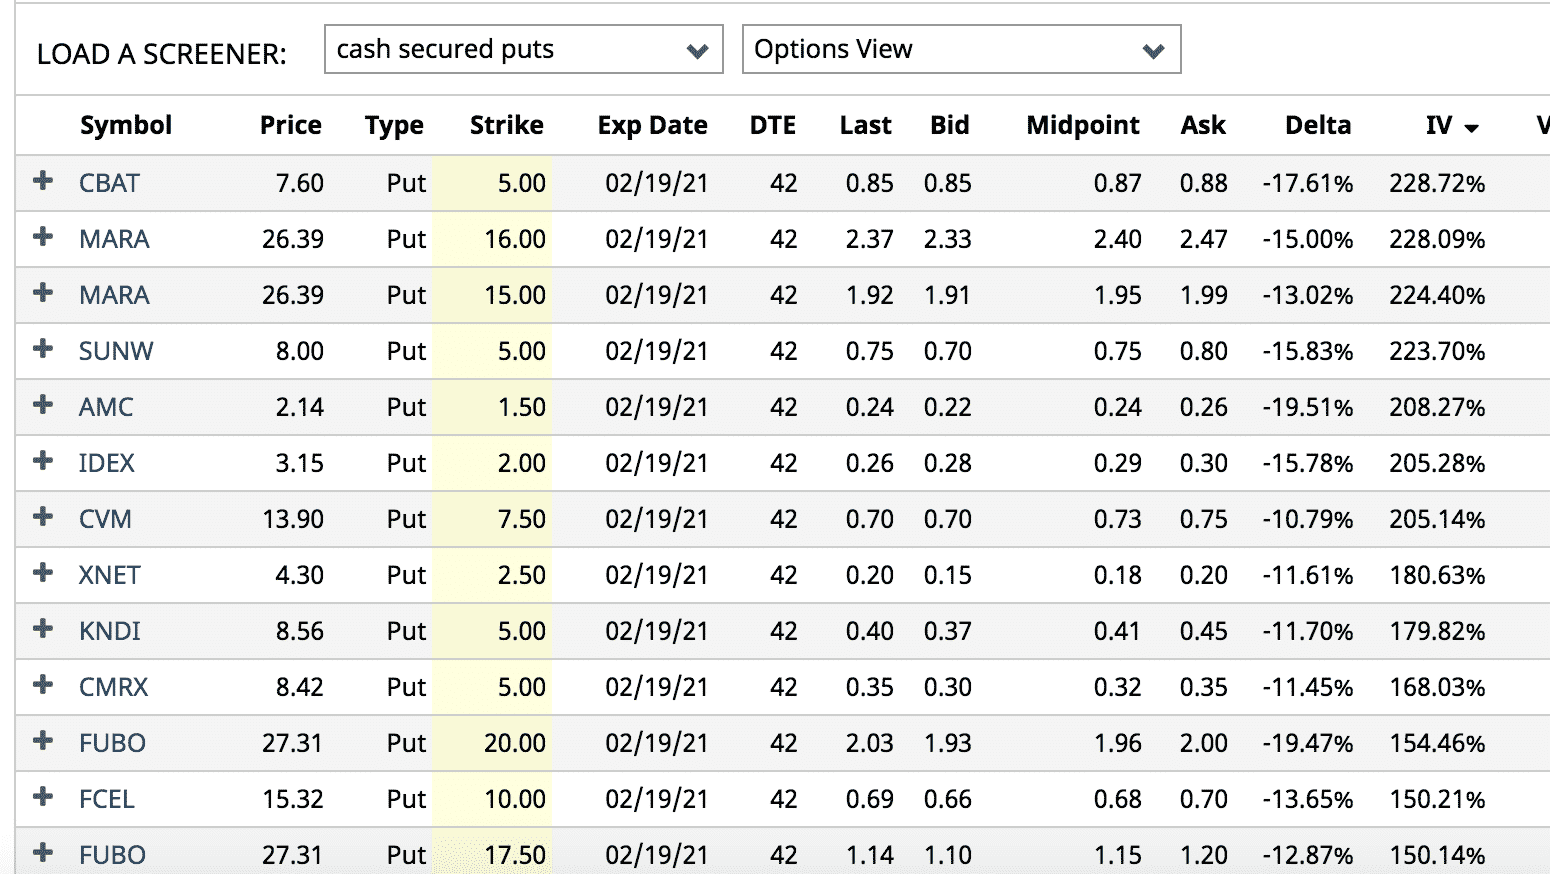
For example, here is a custom screen that I have set up on the Premier screener to look for monthly options with 30 to 60 days till expiry.
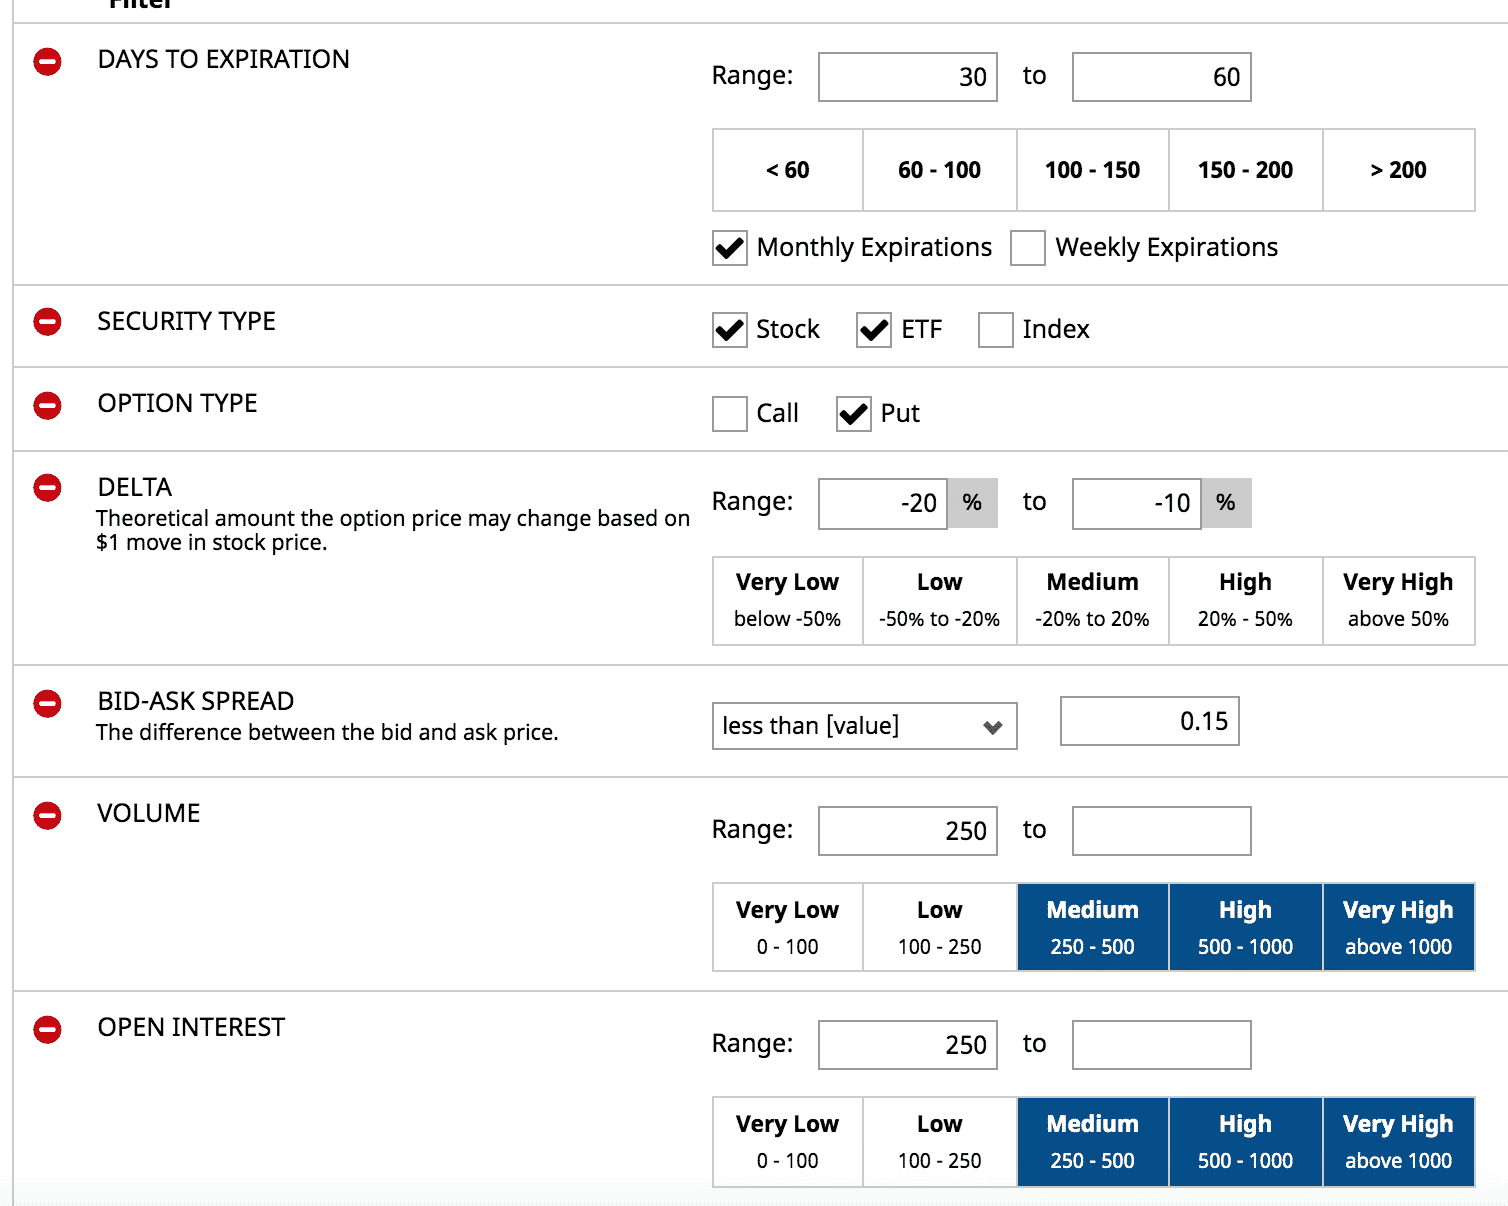
I’m looking for opportunities to sell an out-of-the-money cash-secured put on stocks or ETFs that is at the 10 to 15 delta.
I limit the results to liquid options by requiring that the bid/ask spread be less than $0.15.
Then I sort the results by implied volatility (IV).
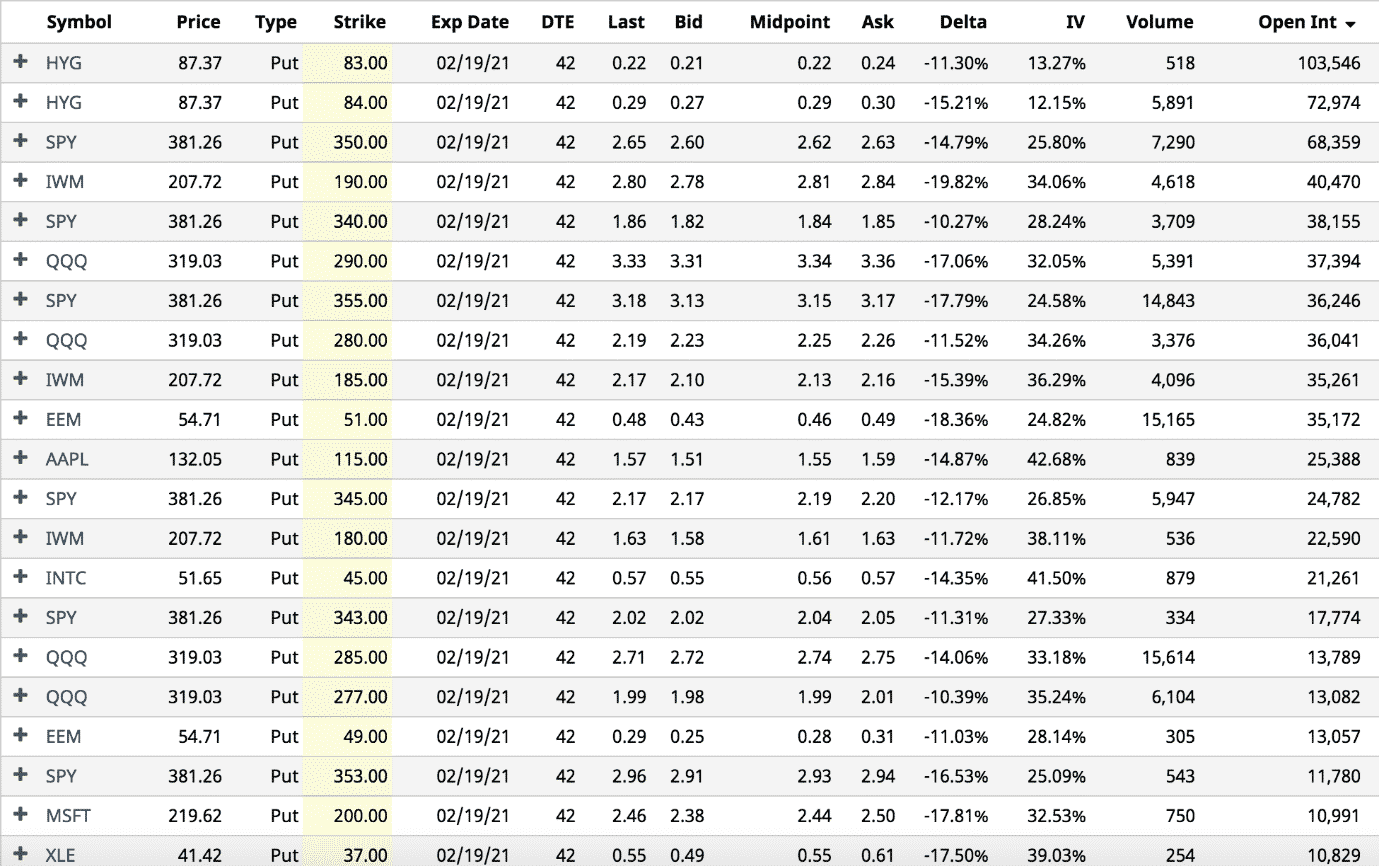
If I rather trade more recognizable symbols, then I can add the following filters to get larger companies that are currently bullish…

Re-sorting the results by Open Interest, I now get much more recognizable names:
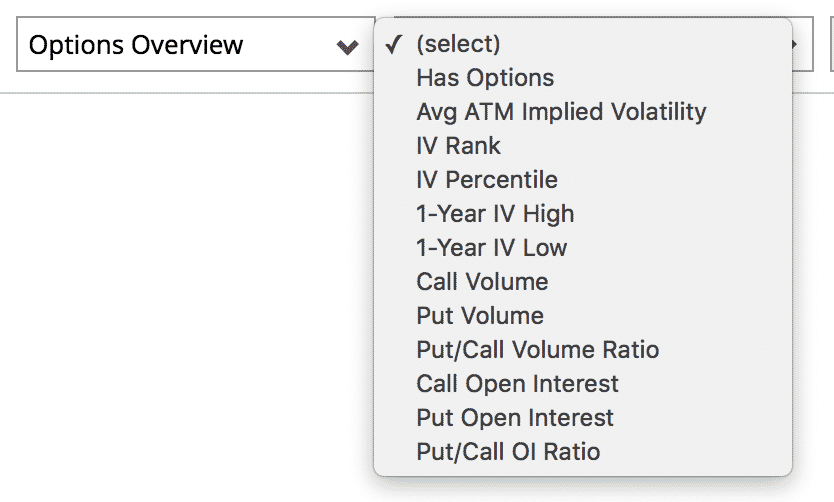
Interestingly, if I want to screen for high IV Rank, those filters are in the stock screener instead of the options screener.
After getting the results, I look at the chart of the underlying to see if it is bullish enough for me to sell that put.
Furthermore, I can see a daily price chart of the option itself.
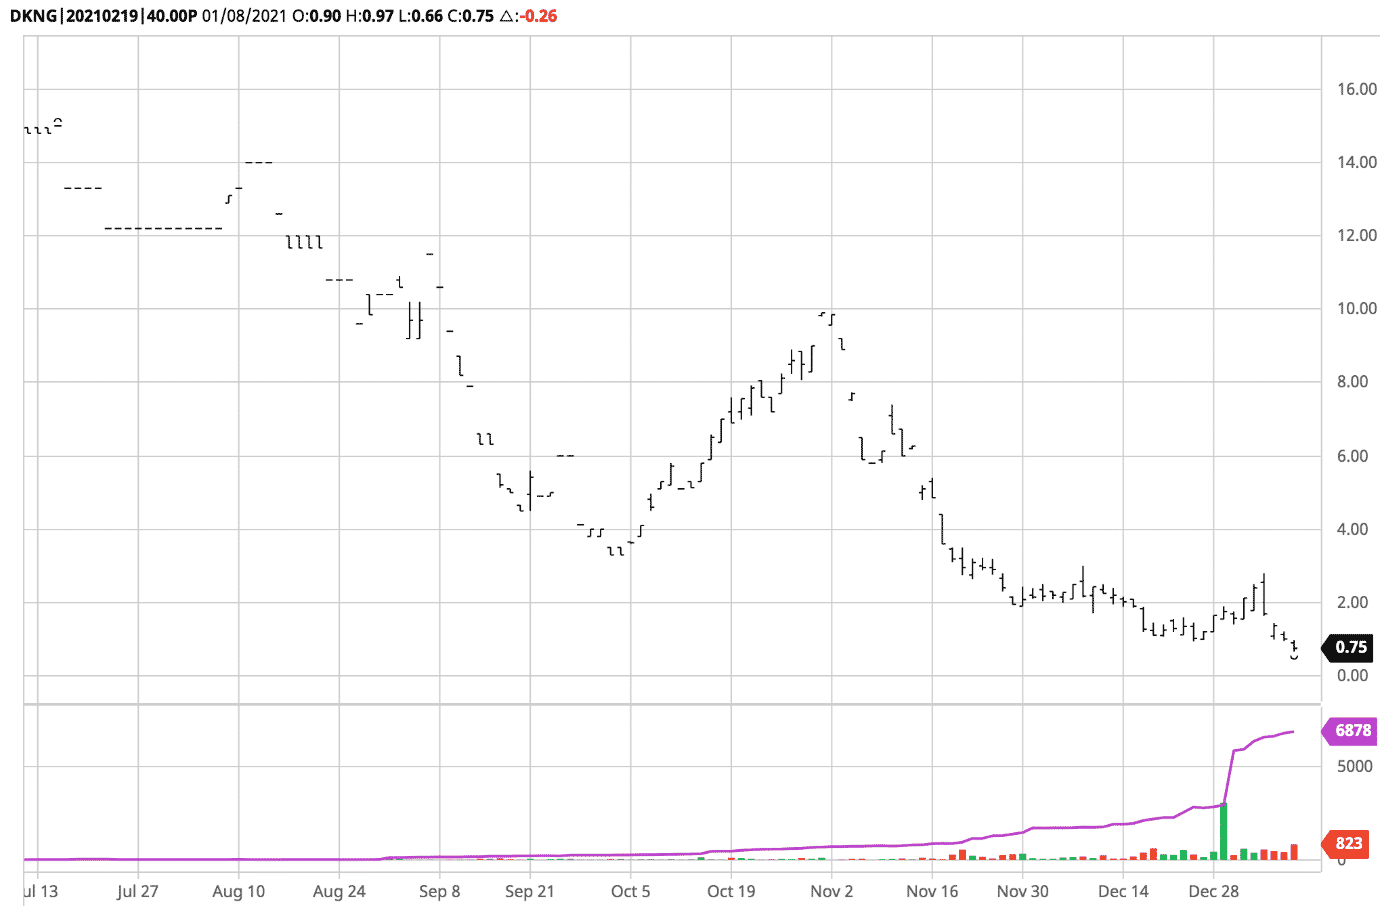
It includes volume information as well as open interest (which is the purple line).
From the results list, I pick out selected options to add to one of my watch lists.
Watch lists have Mini-Chart view for Premier members, which provides thumbnail charts as I hover over them:
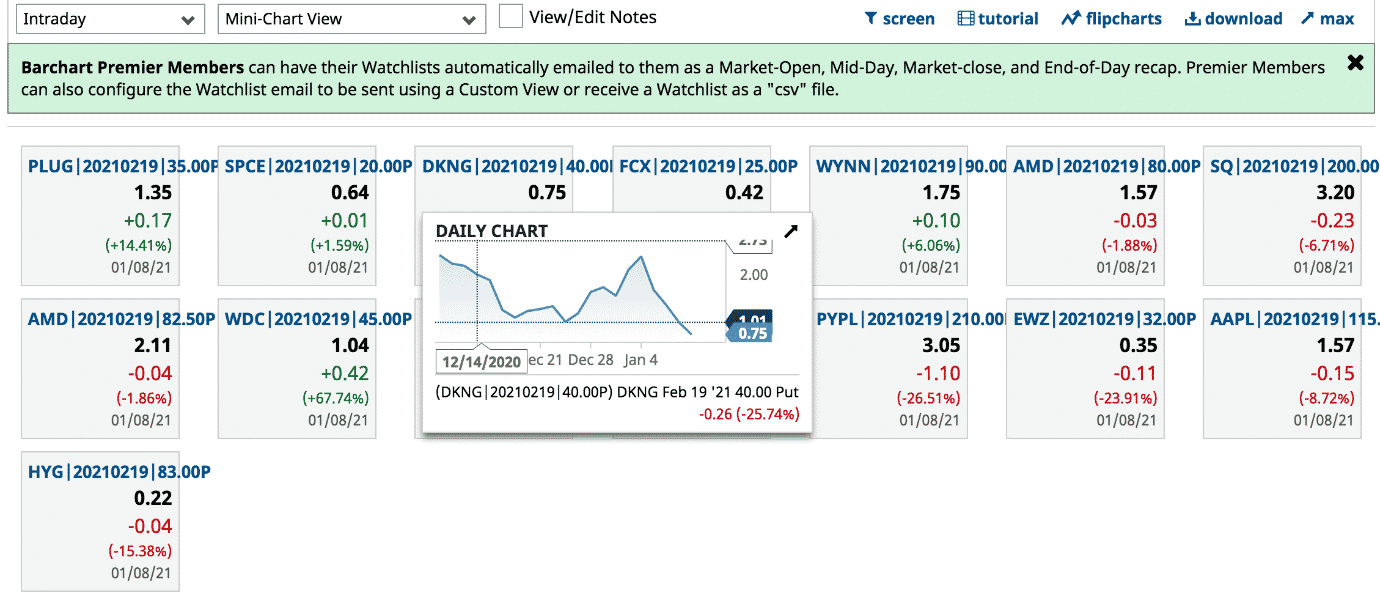
These option price charts tend to all look like they are going down because the price of an option decreases with time.
If I happen to see one where price went up, that might be a good candidate to investigate further.
Keep in mind that option data are delayed at least 15 minutes.
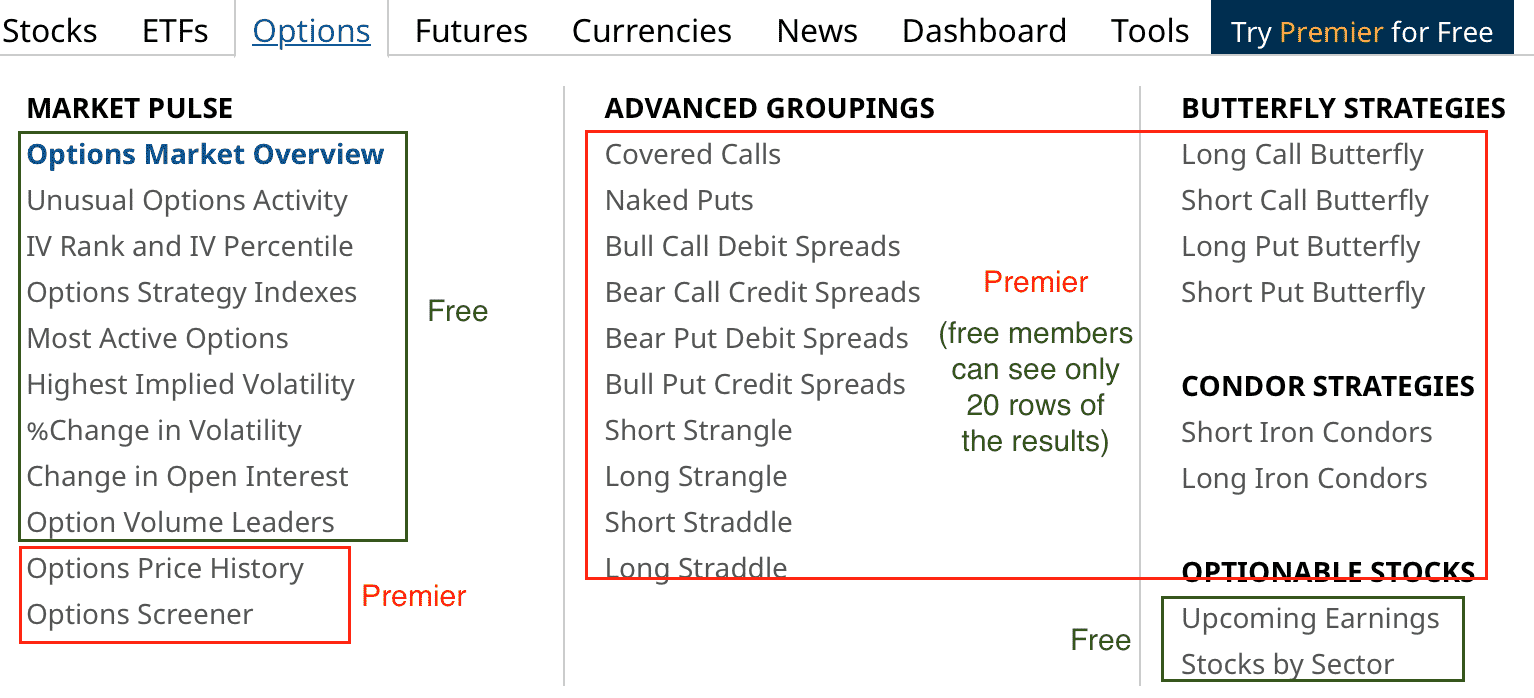
If I don’t want to configure a screener, I can use one of Barchart’s strategy lists (some of which are free):
Screening For The Best Option Trades On Barchart
Grid View
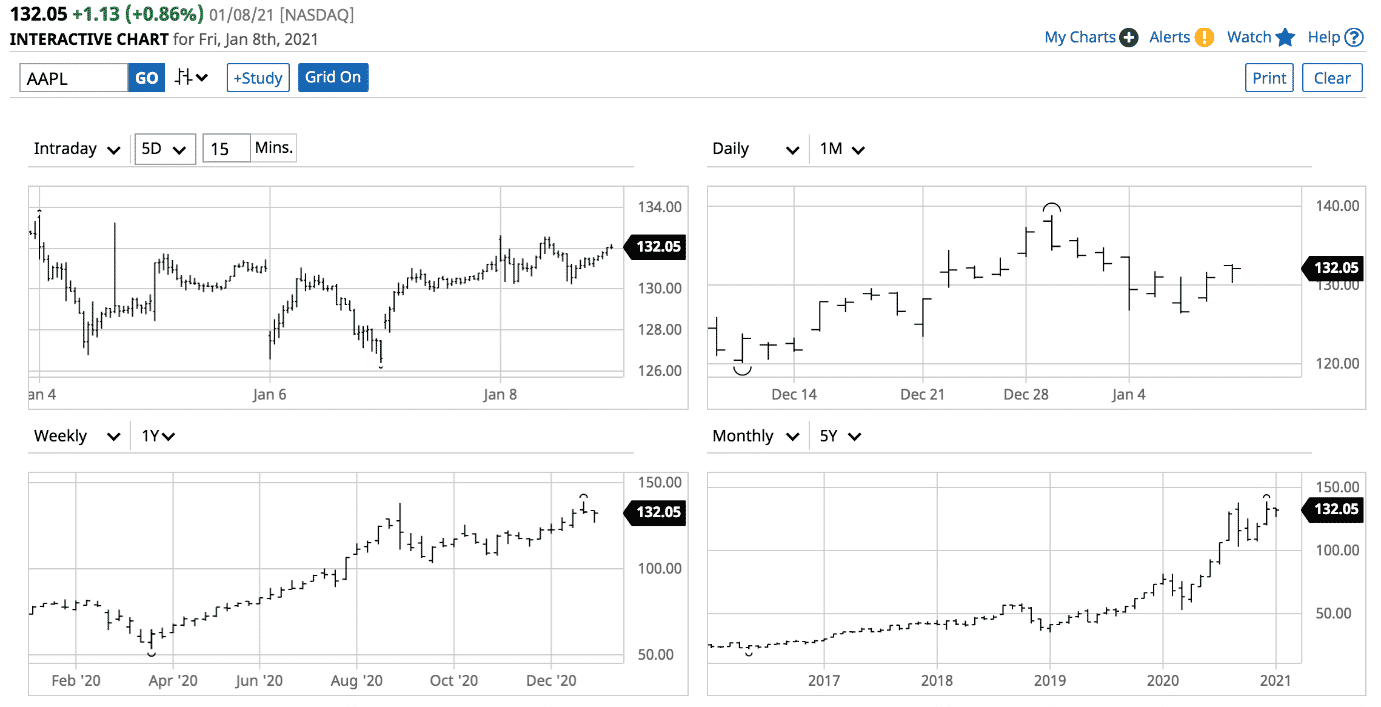
Another view available with Premier is the Grid View, where you can view an underlying in two or four different time-frames in a grid.
Top Picks
While free members have access to the list Top 100 stocks to buy and to sell, Premier members have access to the Today’s Top Stock Picks which is based on technical indicator signals being scanned on a daily basis.
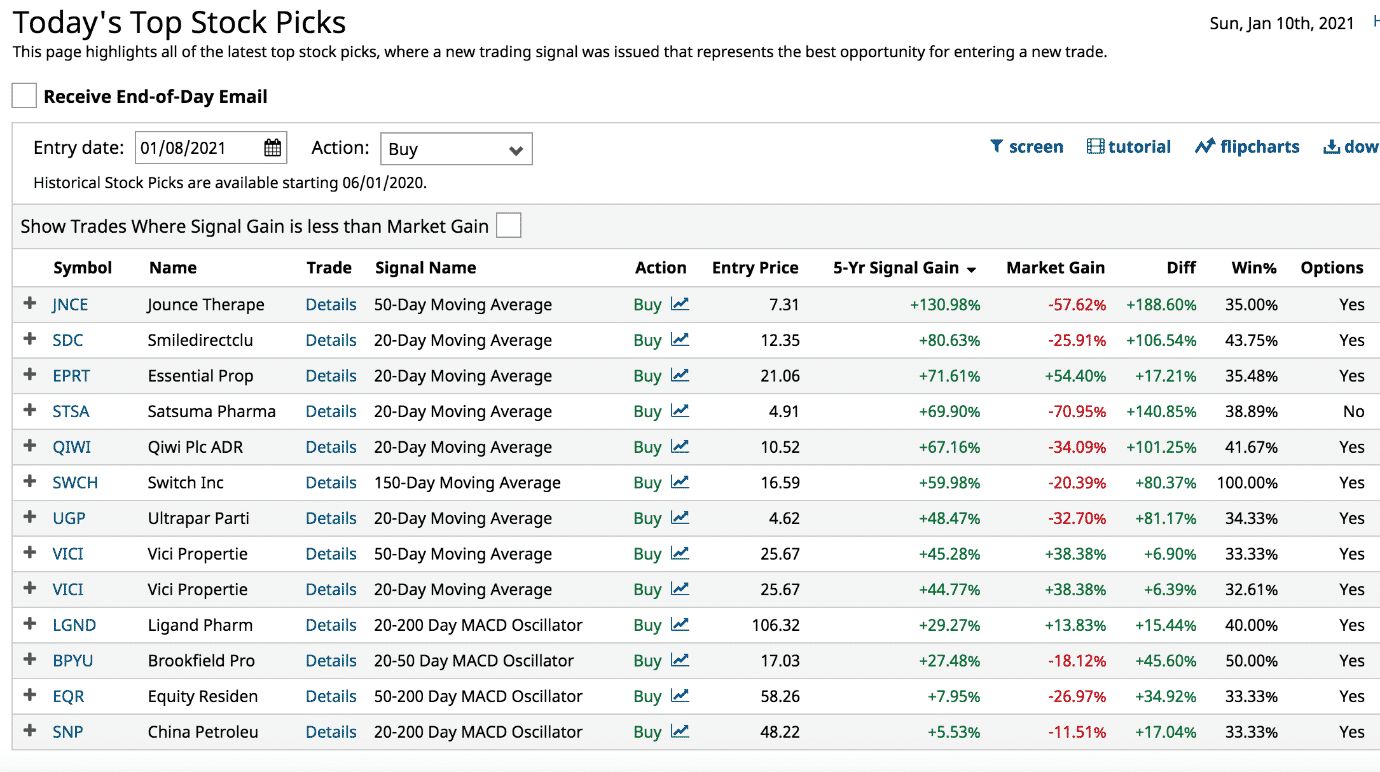
I can look at the picks from past dates as well.
Clicking on the details of the signal, it will explain why the signal was triggered.
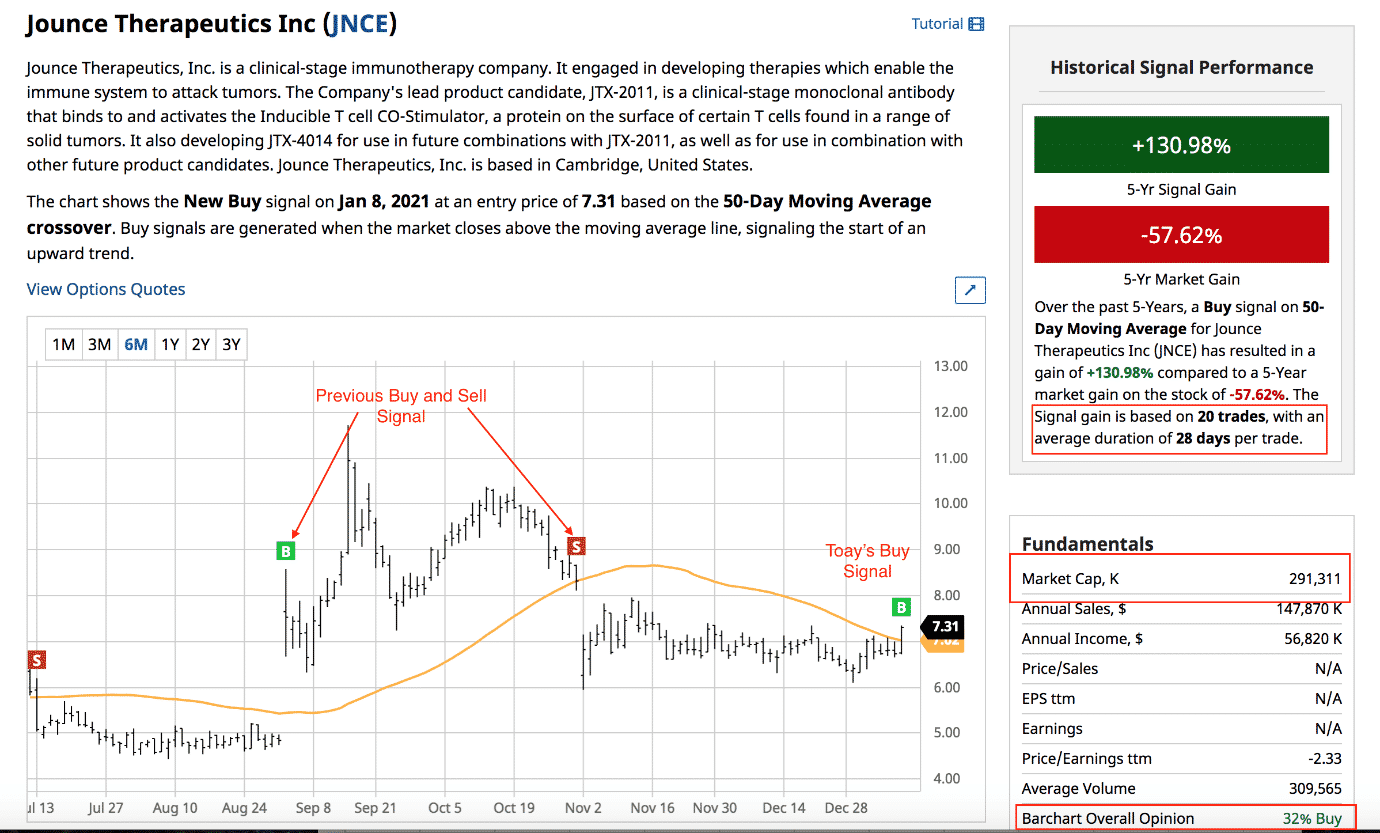
Here I see that it triggered because price closed above the 50-day moving average.
The percentages shown gives a rough idea of how much additional advantage following the signal would potentially give over the course of 5 years.
Over 5 years, this strategy type triggered 20 times for this stock with an average trade duration of 28 days.
Equivalent to about 4 times a year, this is somewhat of a rare signal.
As with any software generated signal, I should not just blindly buy on signals.
I have to do my own due diligence to decide if I want to trade this signal or not based on my own trading style.
Here, the 50-day moving average is sloping down. Am I okay going counter-trend for this setup?
Am I fine investing in a small market cap bio-tech stock priced under $10?
Is the average trade duration the right timeframe that I normally trade?
If the 50-day moving average is too slow and does not give enough trades, I can look at stocks crossing the 20-day moving average instead.
Or look for MACD cross-overs on the Trading Signals New Recommendations page.
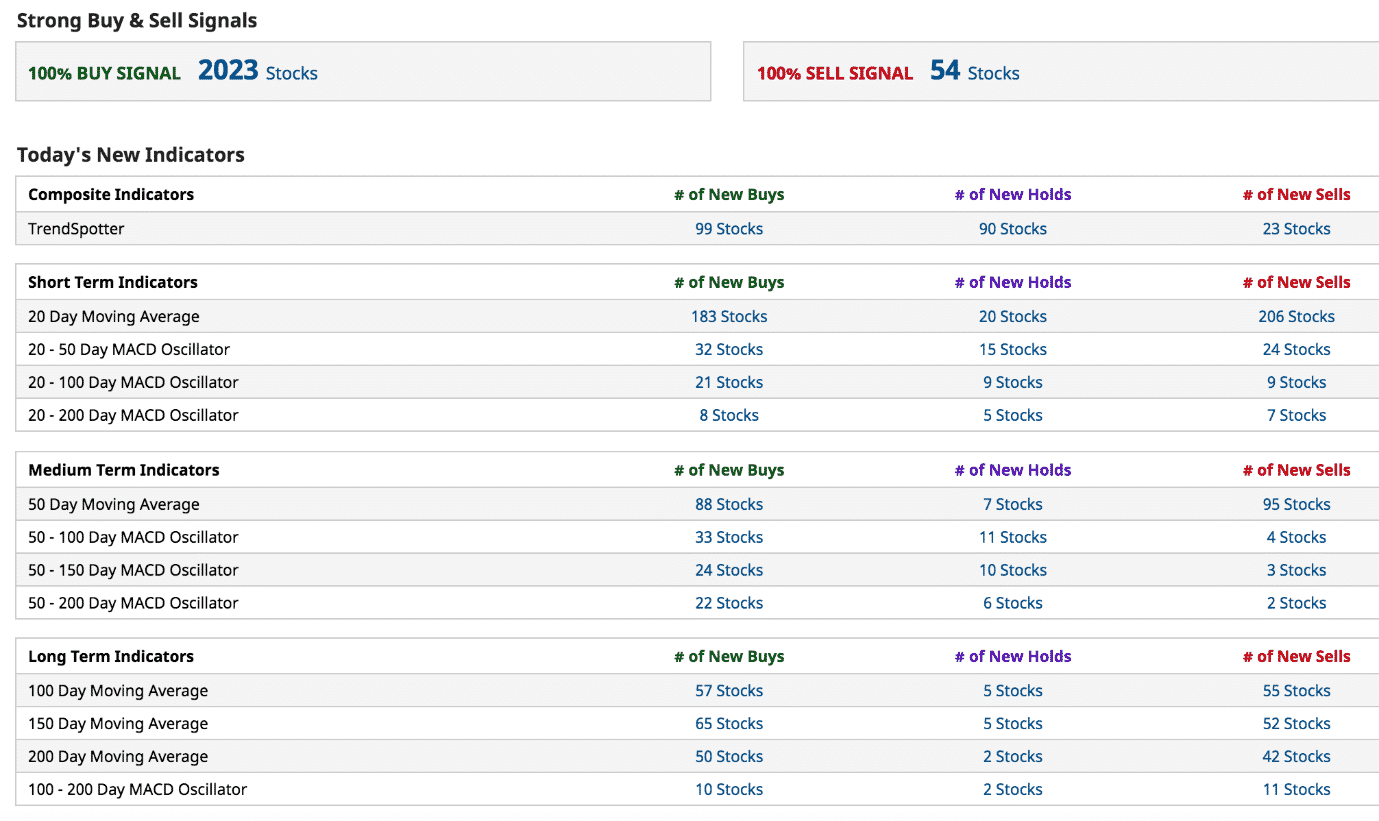
On this day, there were 2033 buy signals and 54 sell signals (appears to be a bullish market right now).
Never traded a 20-50 MACD Oscillator signal before?
Just create a new portfolio in Barchart and paper trade it until you have confidence in how the signal behaves before doing live trades.
Some Negatives of Barchart
This would not be an unbiased review if I did not point out some negatives.
- While I can see the S&P Index as $SPX on Barchart, the RUT index is not available. I asked Barchart support (which was quick in email response), and they said it was due to some licensing agreement. The same issue that StockCharts have probably. The NDX index is under $IUXX which is a bit unusual. The Dow Jones Index is $DOWI. Both $VIX and $VVIX are present as expected. The ETF equivalents are all found as expected: SPY, IWM, DIA, QQQ, VXX.
- The chart rendering going from one ticker to another is not as fast and snappy as I would have liked. This is true even when I’m using no custom chart templates and when doing a side-by-side comparison with another competitor web-based charting site.
Top Wish Features
The top features that Barchart does not yet have that I wish it did at the current time of this writing:
- Would be nice to have a keyboard quick-key to switch to another timeframe from daily to weekly chart for example. Also a keyboard quick-key to switch to another ticker symbol instead of clicking up to the input box. It’s true, you can flip through charts fast if they are in your watchlist. However, if you are reading a list of tickers from somewhere else, it might be nice to scan through the charts without your fingers leaving the keyboard.
- If I’m already on a chart, then it would be nice to see earnings when I pan the chart to look ahead. For example.
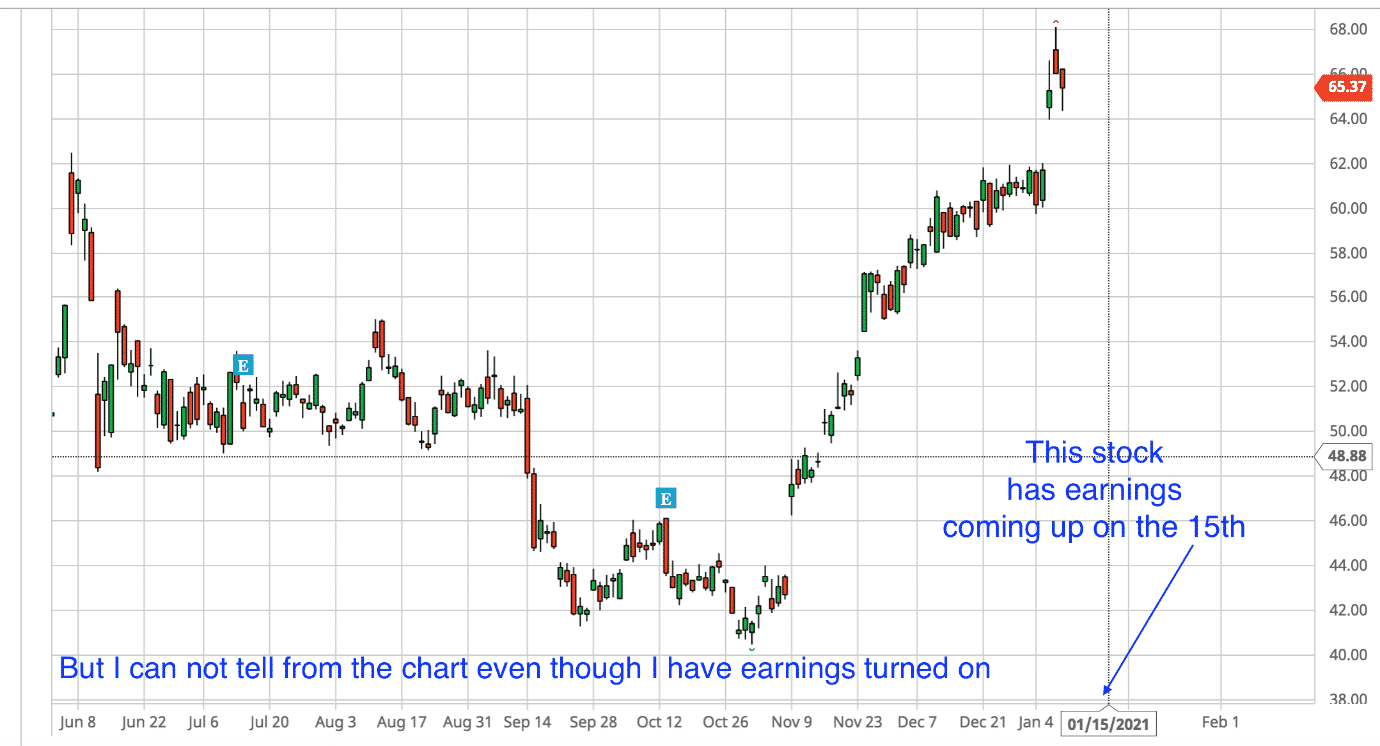
- Barchart’s next earnings date info does not indicate whether it is before-market-open or after-market-close.
- Chart drawing tools should include ability to draw arrows.
- While there are implied volatilities shown in the option chain and in table form, it would be nice to show IV of equities as a studies panel underneath the chart itself. That way I can see if the IV is sloping up or down as well as correlate the price chart with IV change.
Conclusion
There are a lot more features available in Barchart that I didn’t have time to talk about (didn’t want to turn this into a book).
Learn more from the Tools –> Free Webinars at Barchart.com or search “barchart” on YouTube.
Barchart is an excellent tool that is able to generate many quality trade ideas.
Its stock and options screeners are among the best I’ve seen.
Barchart saves an investor time with the Daily Top Stock Picks, for which the investor can look at the chart using any number of indicators to decide if the trade is right or not.
Because it is up to investor (not the software) to decide on a trade.
Trade safe!
Disclaimer: The information above is for educational purposes only and should not be treated as investment advice. The strategy presented would not be suitable for investors who are not familiar with exchange traded options. Any readers interested in this strategy should do their own research and seek advice from a licensed financial adviser.


Does Barchart.com replace StockCharts.com as a recommended website?
Both are good. I prefer the charts on Stockcharts and Barchart has good screeners and other tools.
Hi Gavin,
Thanks for your impressive review. I will certainly take a look.
Funny Barchart has the same issue with RUT.
Yeah I think it’s a data subscription issue. Seems like they don’t have access to the data anymore.
If you had to pick one product to subscribe to, which one would you choose for screening?
Probably Barchart to be honest with you. I still really like Finviz, but Barchart is a clear leader now.
Thank you