


Today, we are looking at how to paper trade options and will discuss four different ways to do it. Let’s get started.
Contents
- Introduction
- Using A Spreadsheet
- OptionStrat
- Back-Trading With Historical Data
- ThinkOrSwim Paper Trading Simulator
- Paper Trading Is Not The Same As Live Trading
- Conclusion
Introduction
Perhaps you are just starting out with options and want to paper trade first.
Great idea.
But what is the best way to paper trade, and how?
We will discuss four ways of paper trading options, starting with the most basic way, which is to track your trades in a spreadsheet.
And we’ll end the discussion on trading simulators.
Using A Spreadsheet
A simple way to paper trade is just using a spreadsheet to track trades.
No complicated software is needed.
Anyone with a Gmail account would have access to Google Sheets.
Suppose it was August 10, 2022, and I wanted to sell a bull put spread on the ARKK ETF, which is currently trading at $49.74.
I want to sell the $45 strike and buy it at the $40 strike.
I want to sell ten contracts of the $45 put option expiring on September 2.
In my brokerage software I see that the price of that option is $1.07 per share.
Since one contract is 100 shares and I’m selling ten contracts, I would receive $1070 from this sale.
I want to buy ten contracts of the $40 put option with the same expiration.
The price of that option is $0.30 per share.
I want ten contracts (equivalent to 1000 shares). So this is going to cost me $300.
If I were to place this trade live, I would receive a net $770 credit.
But since I’m paper trading, I just note it in my spreadsheet like this:
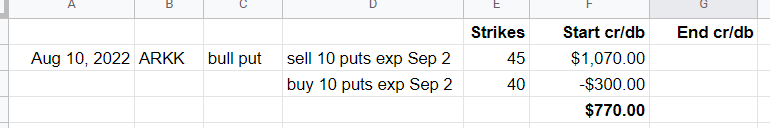
It shows that I took in $1070 from selling the $45 puts.
The negative before the $300 shows that my account decreased by $300 from buying the $40 puts.
One Week Later
On August 18, the price of ARKK dropped to $46.96, which was not good for the trade.
To close the trade at this time would mean I buy back the $45 puts and sell the $40 puts.
After checking the price of the options, we have that the $45 put is at $1.35 per share.
The $40 put is at $0.28.
It would cost me $1350 to buy back all ten contracts of the $45 puts.
I can get $280 back from selling the $40 puts.
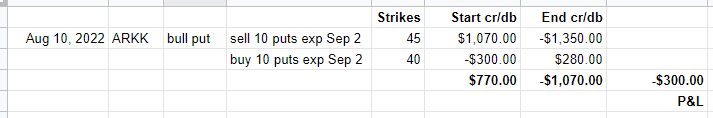
Doing the math in the spreadsheet cost a net debit of $1070 to buy back the spread.
Sold at $770 and buying back at $1070, my P&L (profit and loss) if I closed the trade now would be a loss of $300.
Suppose I didn’t want to exit the trade.
I want to roll down the short $45 puts to the $43 strike to get more distance from the current price and decrease the overall risk.
I would buy back the $45 puts and sell the $43 puts.
Then my spreadsheet would look like this:
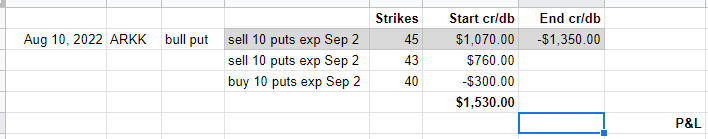
The greyed-out line indicates that I bought back ten contracts of the $45 puts to close it.
It costs $1350 at the time to buy those back.
And I added a new line to indicate that I sold the $43 puts and took in a credit of $760
Let’s say that on August 25, I want to close the trade.
I see that the $43 puts are priced at 0.81. I buy all ten back at $810.
The $40 puts were priced at $0.23.
So I was able to get $230 back from the sale of the ten contracts.
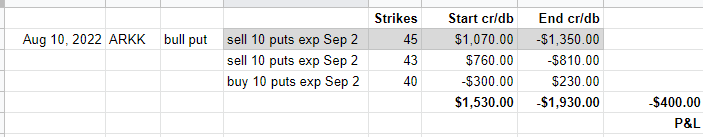
So the net loss on the trade is $400.
OptionStrat
Using a spreadsheet involves a lot of manual work and thinking just to keep track of the P&L.
Is there a better way?
You can give OptionStrat a try. Here I have set up an iron condor on SPX.
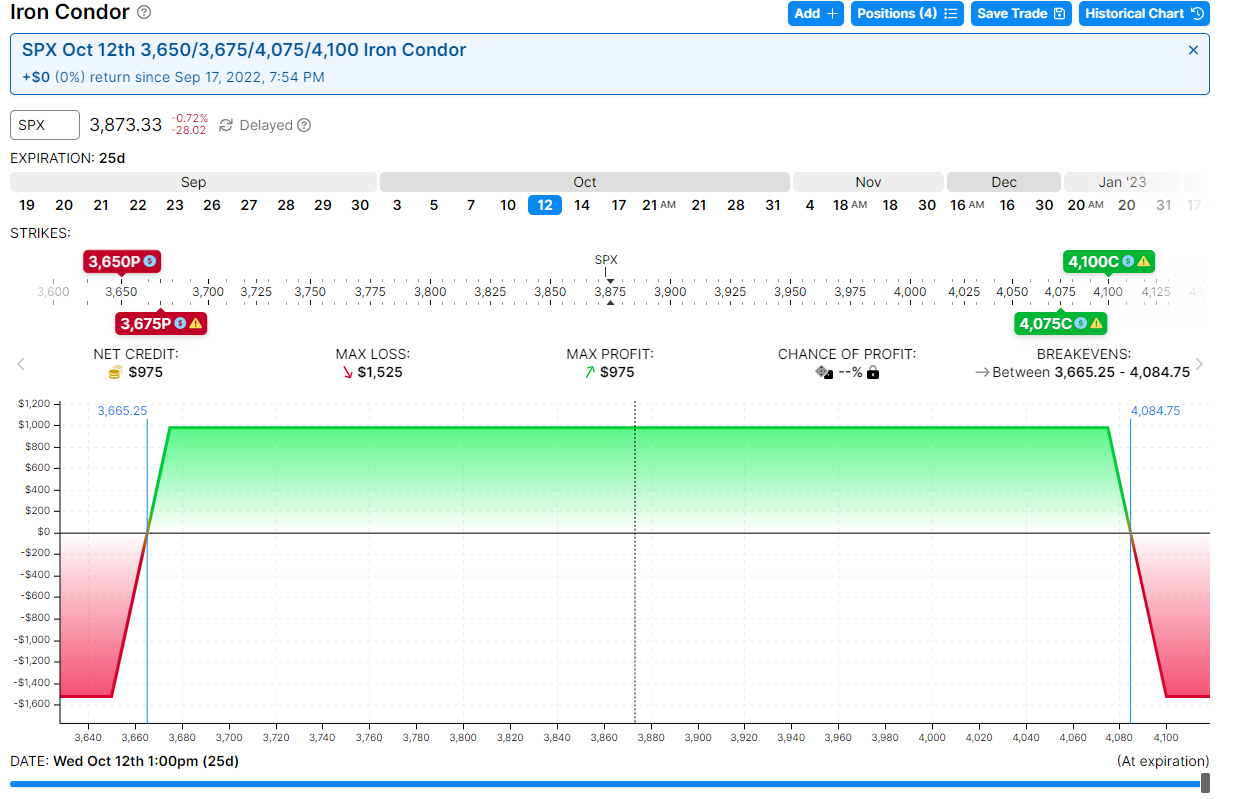
source: OptionStrat.com
For each of the four option legs, you can set the “cost basis.”
That is the cost of that option, as shown in your brokerage platform at the time you would hypothetically place the trade.
Then save that trade in your OptionStrat account.
You can bring up the trade at any time in the future, and OptionStrat will show you the current P&L in the upper left corner.
(It is currently showing $0 and 0% because I just hypothetically placed the trade just now.)
Back-Trading With Historical Data
The issue with paper trading using a spreadsheet or with software similar to OptionStrat is that you don’t have access to historical data.
You are basically trading the market hypothetical with hypothetical money on a day-to-day basis.
If you were to paper trade a monthly cover call strategy, such as selling an out-of-the-money call on stocks you own, it would still take a month for the trade to play out.
If you were to paper trade monthly iron condors, it would still take about a year to get 20 iron condor trades to go to resolution.
In order to paper trade more trades in a shorter amount of time, you would need to use software with historical option prices.
That way, you don’t have to wait a whole day to see what the next day’s prices are.
OptionNet Explorer
Two such software are OptionNet Explorer and OptionVue.
You can start a trade on any day in the past.
Then you would enter your hypothetical trade into the software.
The trade would be priced using historical pricing data so that it would simulate what the trade would have cost had you placed it on that day, and perhaps even at a particular time during that day if it had intraday pricing.
OptionNet Explorer has data for every 5 minutes of the day.
Below is OptionNet Explorer with a 590/580 bull put spread that was hypothetically placed on Telsa (TSLA) on a date in the past (June 21, 2022, at one hour after the market opens).
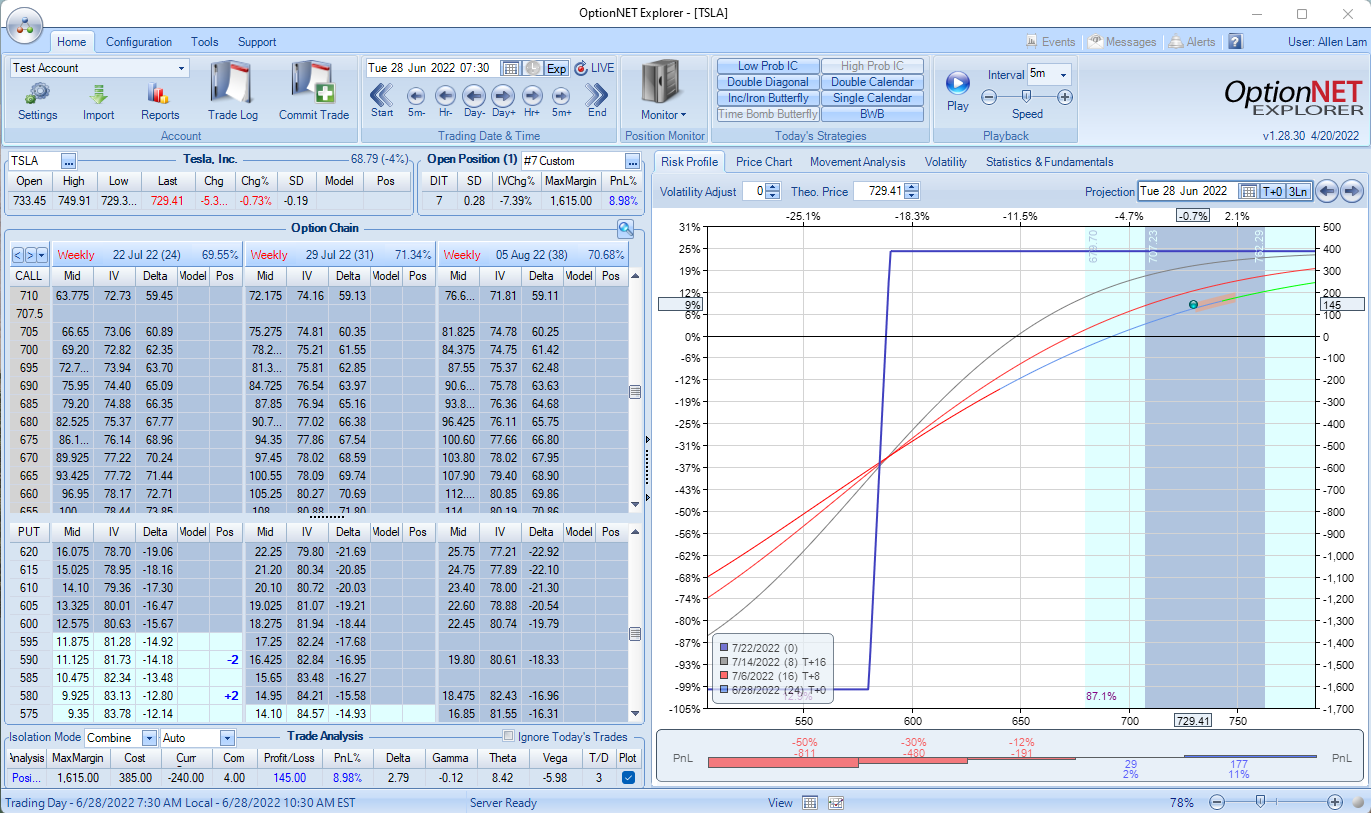
The screenshot shows what the trade would have looked like one week into the trade on June 28.
You can make trade adjustments during the trade, and the software will keep track of your P&L.
The trade is now up 9%, with a hypothetical profit of $145.
It shows the Greeks of your position, the payoff expiration graph, the T+0, and projection lines as the trade evolves.
You see buttons at the top, allowing you to advance the trade day-by-day, hour-by-hour, or at 5-minute intervals.
Now you can go through a month-long trade in a matter of minutes.
This can be a great learning tool because now you are back-trading with paper money.
You can test out new strategies.
Do you want to know if it is better to sell monthly or weekly covered calls?
Well, you can back-trade it both ways, going back in time and trading under the same market conditions.
It lets you practice trading just like pilots practice flying by using a flight simulator.
ThinkOrSwim Paper Trading Simulator
Speaking of simulators, ThinkOrSwim has a paper trading simulator.
Below is a screenshot from the ThinkOrSwim application set to “Paper Trading.”
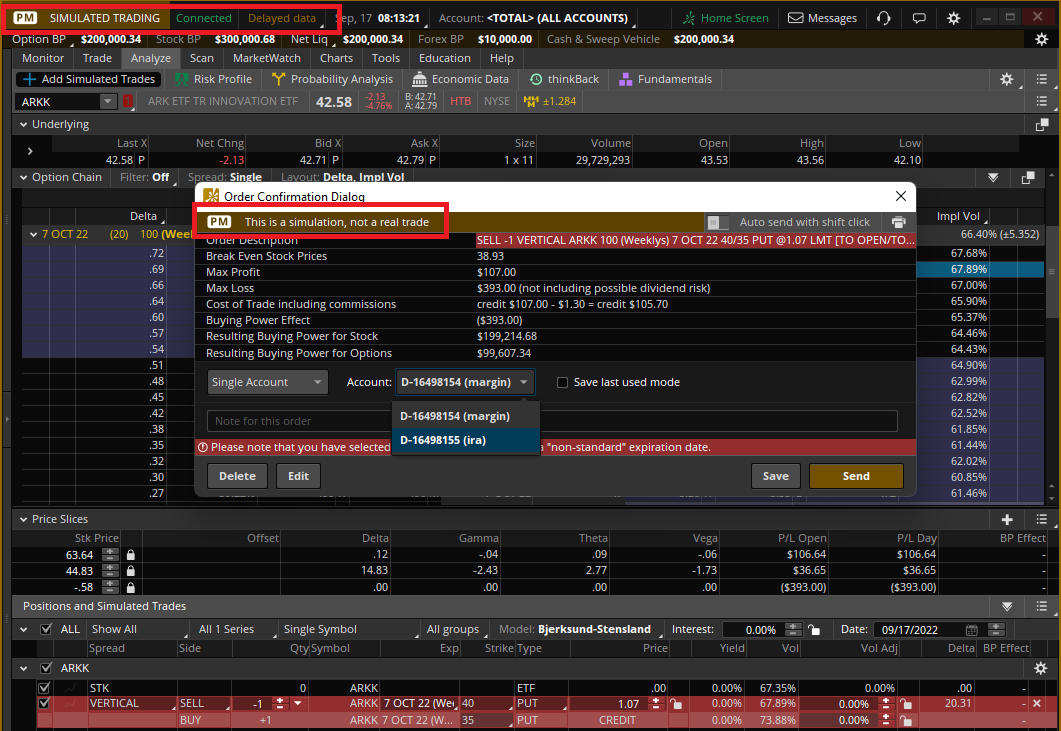
source: ThinkOrSwim application
The interface is the same as what you would use for live trading, except it makes notes at various places to remind users that this is a simulation and not a real trade.
You see the options chain and can select the strikes and expirations of your options.
The prices do change. But it uses delayed data (about 15 minutes).
The option buying power and portfolio balance are hypothetical, which you can reset to any amount at any time.
It is best to reset the balance to an amount that you actually will be using when you transition to live trading.
That way, you get used to the correct size of gains and drawdowns.
You can paper trade in a margin or an IRA account (which has greater limitations on the type of option strategies you can use).
The account numbers are fake (that’s why they start with the letter D for “demo”).
Paper Trading Is Not The Same As Live Trading
While a trading simulator such as ThinkOrSwim is quite close to the feel of live trading, it is not exactly the same.
There is the psychological difference of knowing that this is not real money, which can cause one to trade slightly differently or make different unconscious decisions.
Beyond this psychological aspect is the fact that the data used is not live data.
Therefore, if you decide to sell a bull put spread on a stock that you see going up on a live chart, when you place the order in the paper simulator, the prices of the options are what they were 15 minutes ago.
This gives you an advantage because it is as if you were placing the trade when you know what would have happened 15 minutes in the future.
Paper trading with delayed data gives you a 15 minutes head start on every trade.
There are also anecdotal reports that there are subtle differences in the order fills.
Such as, it is easier to get filled at good prices in paper trading.
In live trading, the bid/ask spread changes dynamically, and the mid-price can jump around quite erratically in certain market conditions that are difficult for the simulator to simulate, although these effects may not make too much of a difference if you are a longer timeframe trader where options don’t expire until 50 days out.
And finally, there is something that many people do not realize.
As options get close to expiry, it is possible to be early assigned on a short option in live trading.
This does not happen in the ThinkOrSwim paper simulator.
Remember to check if the paper trading software is taking into account fees and commissions.
Conclusion
With all these effects combined (with psychology being the primary effect), the net result is that it is easier to make money in paper trading than in live trading.
This is to say; if you can not make money with paper trading, then it is even more difficult to make money in live trading.
Paper trading is a great learning and practice tool.
Paper trading will let you know whether you are ready for live trading.
Now you have some ways to get started with paper trading.
We hope you enjoyed this article on how to paper trade options. If you have any questions, please send an email or leave a comment below.
Trade safe!
Disclaimer: The information above is for educational purposes only and should not be treated as investment advice. The strategy presented would not be suitable for investors who are not familiar with exchange traded options. Any readers interested in this strategy should do their own research and seek advice from a licensed financial adviser.


