


Contents
- Relationship Between Win Rate and Risk-to-Reward
- Lower Probability Trades
- No Holy Grail
- Unprofitable Strategies
- It Is A Spectrum
- Iron Condor Example
- Determining The Minimum Win To Be Profitable
- Derivation
- Conclusion
There is a natural relationship between the win rate of options strategies and the risk reward ratio of the strategy.
Knowing the win rate of a strategy is not sufficient for you to determine if one strategy is better than another.
A strategy that wins 85% of the time is not any good if the average win is $1 and the average loss is $10.
This strategy is a losing proposition.
How do we know?
Plug that into the equation at the bottom of the article.
We will determine our win rate needs to be consistently profitable on a particular strategy based on our average winning amounts versus average losses.
Relationship Between Win Rate and Risk-to-Reward
But first, let have an intuitive understanding between win rate and risk-to-reward.
Options strategies that have a high win rate will naturally have a higher risk-to-reward ratio.
Those strategies with low risk relative to their reward will naturally have a lower win rate.
All options strategies will fall somewhere in on this grid:
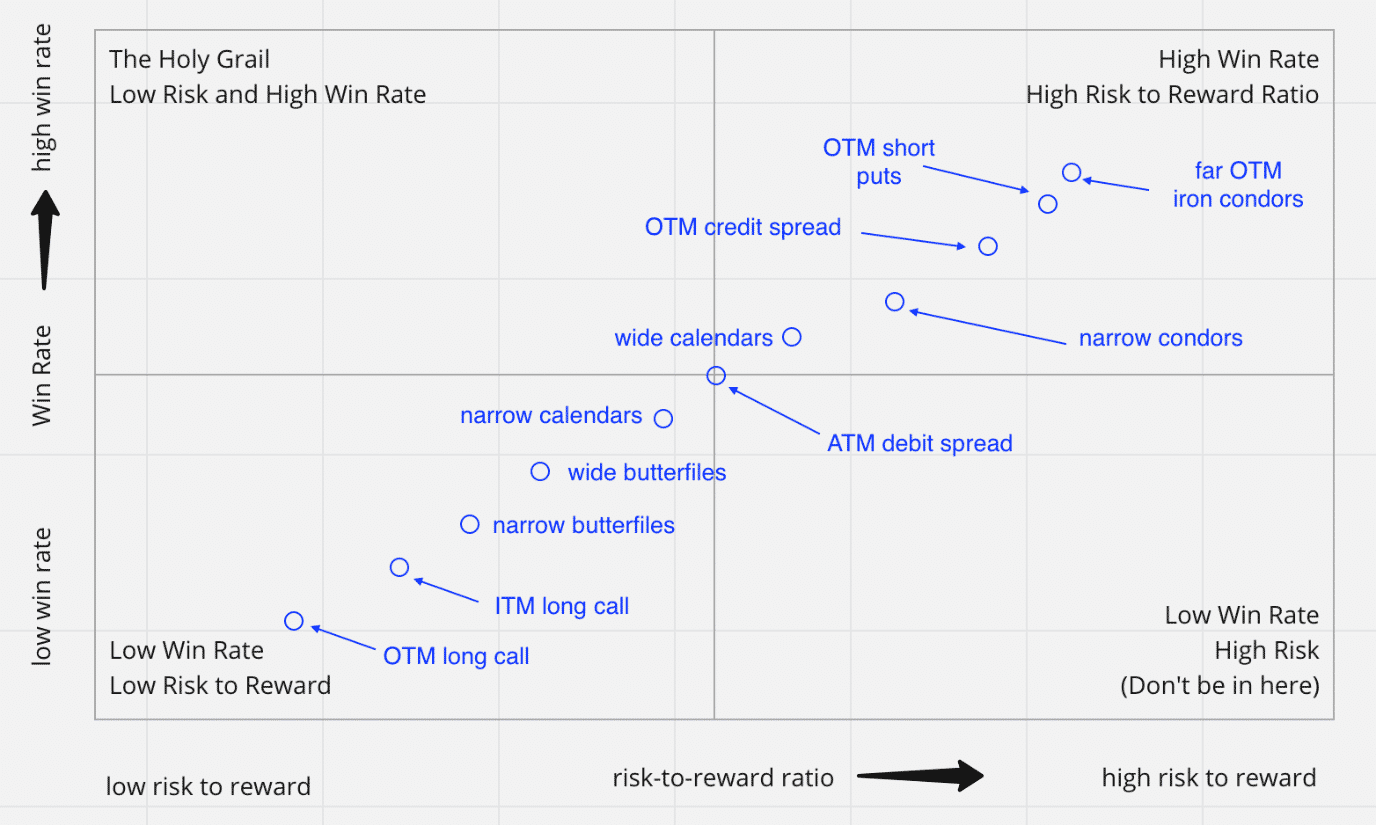
Iron condors fall into the upper right quadrant.
They are high probability trades where the win rate is high.
But the risk-to-reward is not that great.
If you have traded iron condors, you will realize that while they win much more often than they lose, the losses are usually larger than the wins.
Lower Probability Trades
Butterflies are the opposite.
They are lower probability trades.
In typical constructions, their max risk is lower than their max reward.
They live in the lower-left quadrant of the grid.
Similarly, the out-of-the-money long call has a low probability win rate.
But it can win big compared to its loss if and when the out-of-the-money long call does win.
It can theoretically have unlimited gains while the max loss is limited to the debit paid.
The lottery ticket falls in this same lower-left quadrant.
The ticket costs $1, but I have the potential to win a million dollars, however unlikely that may be.
This quadrant is also where the far out-of-the-money long put lives. It has a low cost (which is the max that you can lose).
It is insurance that pays off big in a large market crash. But most of the time, the market is not crashing.
No Holy Grail
The upper left quadrant of the grid are strategies that have a high win rate and low risk.
At the very upper left corner edge of the quadrant, where the win rate is 99%, and the risk is extremely low, this is where the Holy Grail strategy resides.
I’ve heard from a few veteran traders that this strategy does not exist.
But if you know of such a strategy, please let me know.
Unprofitable Strategies
The lower right quadrant of the grid represents strategies with a high probability of failure and a low win rate.
These typically are losing strategies, and you want to avoid them.
This quadrant contains unprofitable strategies, just as the top left quadrant contains profitable strategies.
There are unprofitable strategies in this quadrant, just like there are profitable strategies.
However, no strategies fall in the extreme lower-right corner edge of this quadrant, where the risk is extremely high, and the win rate is extremely low.
Because if they did exist, then a trader could trade the other side of these and would have found the Holy Grail.
It Is A Spectrum
For illustrative purposes, the dots placed on the grid only represents one particular construction of the strategy.
Each particular strategy covers a wide range on the grid.
Some traders feel more comfortable in the upper right quadrant because they enjoy the high win rate.
Other traders feel more comfortable in the lower left quadrant because they like the low risk-to-reward ratio.
Depending on how the option strategy is set up, it can end up in either quadrant.
For the calendar spread, this depends on the length of time between the front-month and the back-month.
To be in the upper-right quadrant, you can make the calendar very wide by having a lot of time between the short front-month option and the long back-month option.
The back month option may even be six months out in time; while selling the weekly option.
Because the risk of a calendar is the debit you paid, this higher-priced calendar will have a higher risk-to-reward ratio.
Because of its wide break-even points, it will have a better probability of profit — in other words, a higher win rate.
A more narrow calendar in the lower-left quadrant can have a reward twice as much as its risk.
It is constructed when the short and long options are very close together (perhaps only one week apart).
The short option pays for the majority of the cost of the long option.
This low-priced calendar has little risk.
The most you can lose is what you paid for it.
Because of its low risk, it also has a lower win rate.
Iron Condor Example
Looking at the iron condor payoff diagram for Goldman Sachs (GS)
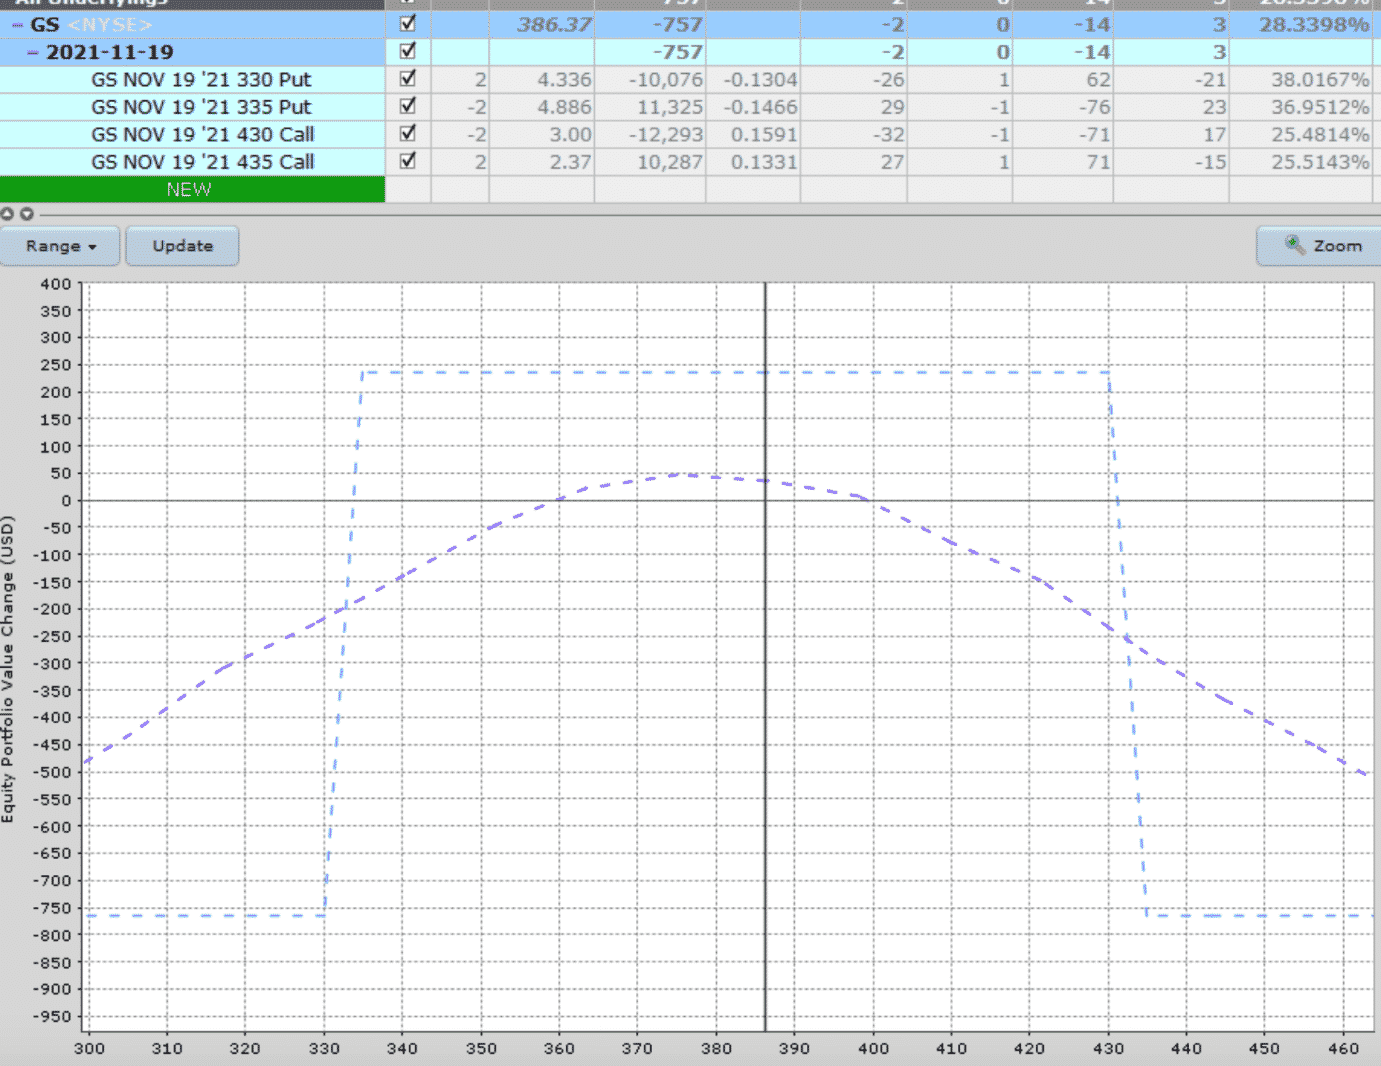
We see that our max loss is $750. Our max reward is our premium of $250.
That is a risk-to-reward ratio of 3, assuming we hold the trade until it expires.
Based on our iron condor rules, we rarely hold the condor to expiration.
Since we don’t ever want to take the max loss on an iron condor, we have set rules to exit the trade if we lose two times the premium.
In this case, a stop loss of $500.
By doing so, our risk-to-reward ratio will decrease.
But at the same time, it also decreases the win rate.
We have an additional take profit rule of taking profits at 50% of max profit if we achieve it in less than 50% of the duration.
By taking profits early at $125, we are increasing our win rate.
The side effect is that it decreases our winning reward amount, which affects our risk-to-reward ratio.
If we take profit at $125 and stop-loss at $500, you would think that our new risk-to-reward ratio has increased to 4, which implies that our win rate would have increased as well.
This might be a good approximation.
It would be true, except that if our stop loss and take profit are not hit, we continue the trade and exit one week before expiration regardless of what P&L it is at the time.
Any adjustments we make to the condor mid-trade will further alter the win rate and risk-to-reward ratio in ways that are difficult to calculate.
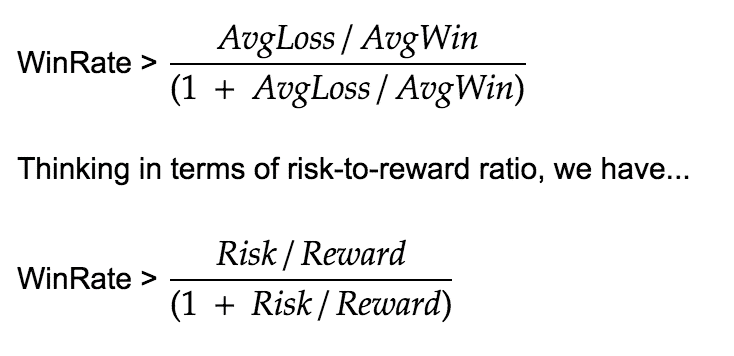
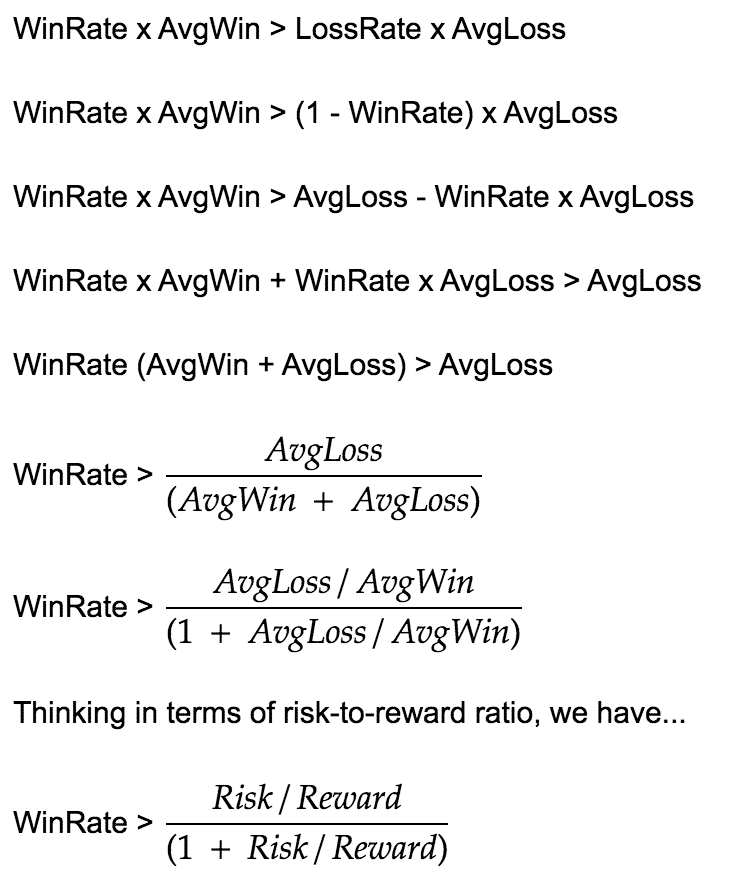
Determining The Minimum Win To Be Profitable
The best way to determine the minimum win rate we need to be profitable in a particular option strategy is to look in our trading logs to determine our average loss and our average win.
Assuming we each trade is approximately the same size, the minimum win rate needed to be profitable is…
Graphing the equation out,
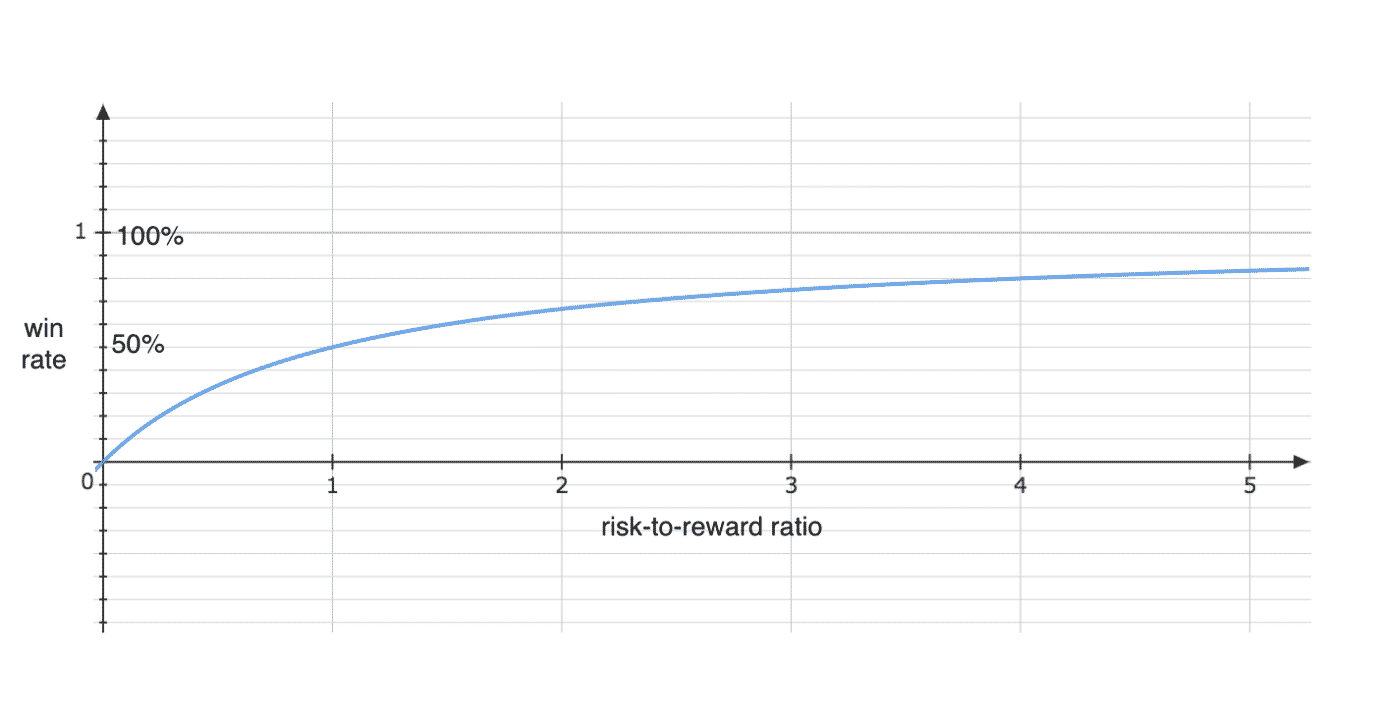
we see that if our average loss is about equal to our average win (risk-to-reward ratio of 1), we need to win at least 50% of the time to be profitable.
At-the-money debit spreads have this characteristic.
When constructed such that the maximum potential profit is about equal to the debit paid, we need to pick the direction correct in more than half the time to be profitable.
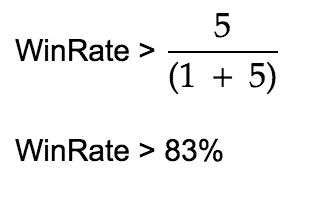
If you are trading iron condors and your trading logs shows that your average loss is five times greater than your average win, you can still be profitable as long as you win much more than you lose.
In this case, you need to win at least 83% of the time.
Derivation
The minimum win rate formula is derived directly from the Trader’s Equation which says that to be profitable, your win rate times your average win must be greater than your loss rate times your average loss
Conclusion
The goal of any trader is to find slight edges in the market where they can decrease their risk and increase their win rate and head closer and closer to the upper-left corner of the grid.
Trade safe!
Disclaimer: The information above is for educational purposes only and should not be treated as investment advice. The strategy presented would not be suitable for investors who are not familiar with exchange traded options. Any readers interested in this strategy should do their own research and seek advice from a licensed financial adviser.


