


Today, we will be talking about selling weekly put options for income.
This is slightly different from the longer-term put selling that would have expirations that are 30 to 45 days out in time.
Weekly put options have about 4 to 10 days to expiration (DTE).
Because of this short time frame, price movements will have a larger effect on the profit-and-loss of the put option.
Hence this option strategy is more suitable for short-term traders who are making directional bets that the stock price will be going up in the next couple of days based on chart technical analysis.
If there is no pattern, then there is no trade.
Contents
- Introduction
- Morning Star Reversal Pattern
- Hammer On The 20-Day Moving Average
- 50-Day Moving Average And 50-RSI Rule
- Moving Average Cross-Over
- Smaller Premiums For Lower Price Stocks
- Cash Secured Puts Versus Naked Puts
- Weekly Bull Put Spreads
- Stop Loss At 2X
- Roll When Short Strike Tested
- Optional Filters
- Short-term Moving Averages
- Beware of Trader Euphoria
- Implied Volatility (IV)
- Problem With High Probably Trades
- Back Tests For You To Try
- Selling Weekly Puts Mechanically On The Indices
- Conclusion
Introduction
Selling weekly put options for income is suitable for taking advantage of candlestick patterns because these are short-term patterns that are only valid for the next couple of candles.
The chart needs to be consulted at least daily. Unlike the longer-term trades, there is less time for adjusting and hedging.
Hence the rules for adjustment and for taking profits and stop-loss may be slightly different from those of the longer-term trades.
While each trader will need to develop his or her own rules that match their trading style, we will look at one set of rules that can be used as a starting point for you coming up with your own rules.
The strategy is more for income generation, rather than for stock acquisition.
To back test the strategy, we picked a random date for each of the 30 Dow Jones Index stocks.
Half of the dates were from the year 2020 (a bullish year) and half of the dates were from the year 2018 (a bearish year).
From that date forward, we scan the stock for the first occurrence that meets one of the three technical bullish patterns:
- The 8 and 20 moving average crossover
- Hammer on 20-day moving average
- Morning Star Reversal Pattern
The moving average crossover pattern is the one with the most occurrences and is the most important. It is more complex and will require a bit of discussion.
So, we will start with simpler concepts first and work our way up.
Morning Star Reversal Pattern
The morning star is a candlestick pattern consisting of three candles.
Like most candlestick patterns, it is a reversal pattern that comes at the bottom of a downtrend or pullback.
So, for this pattern to be valid, the price must be coming down into that pattern.
Here is a classic example seen on Honeywell (HON) where the middle candle is an indecision doji.
You can see the price reversed right there.
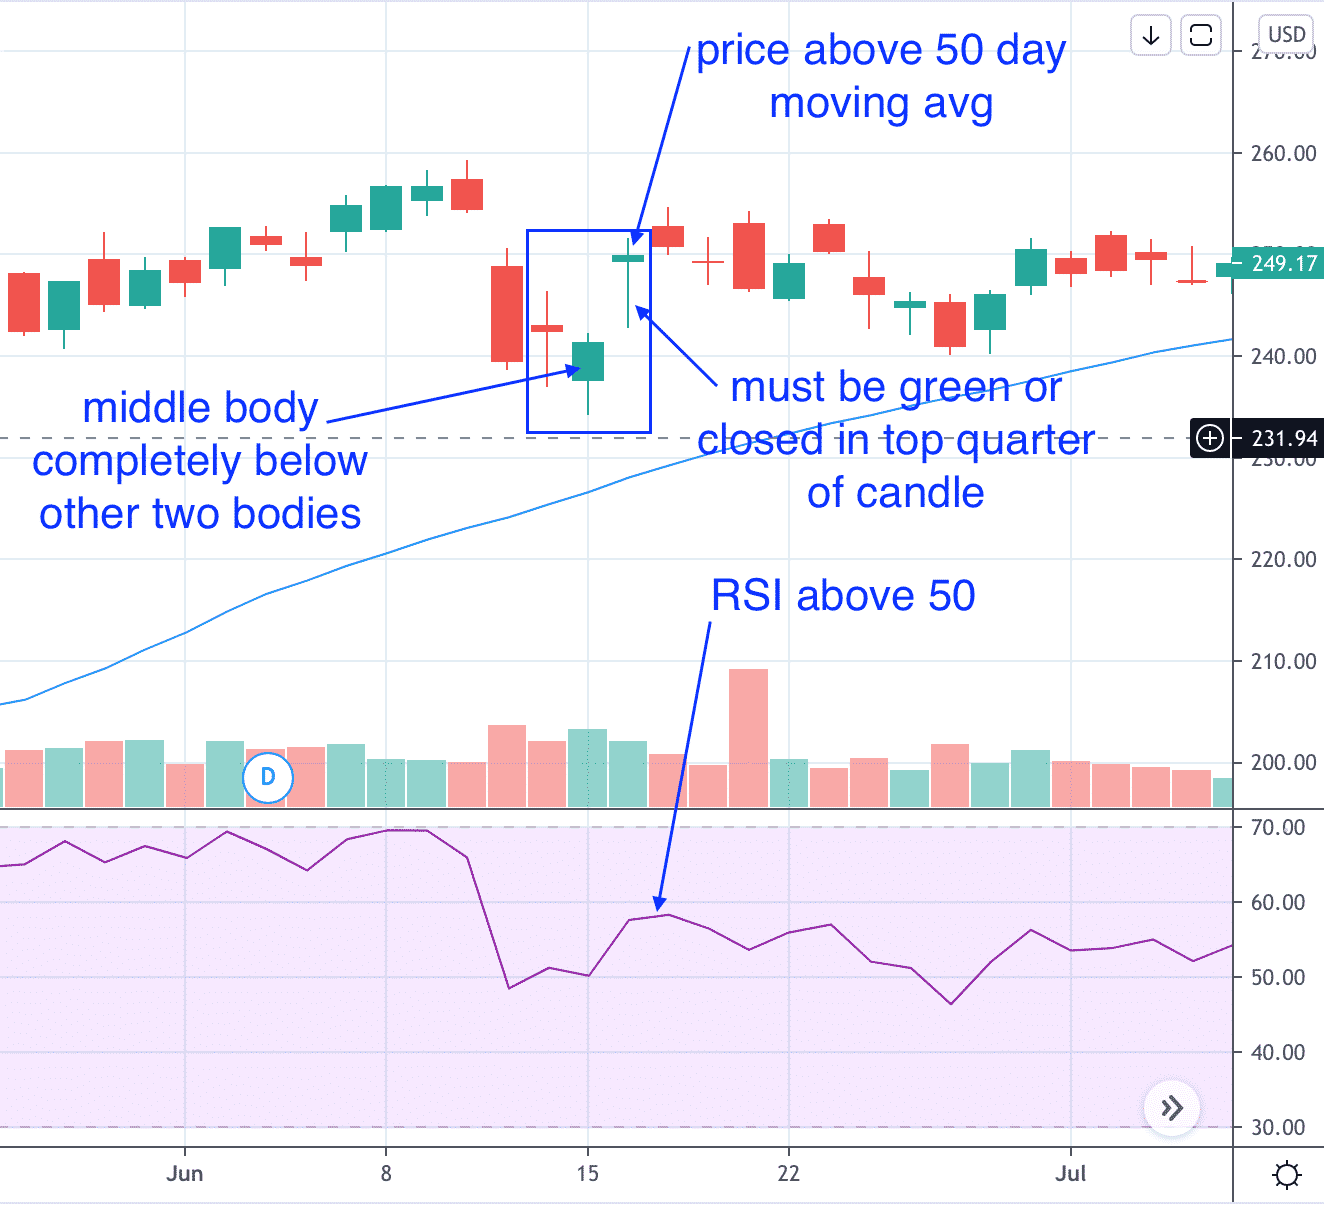
While there are variations on the definition of the morning star pattern; for the purpose of this back test, we define the pattern by the body of the middle candle being completely below the bodies of the other two candles.
The “body” of the candle is the part excluding the upper and lower wicks.
The body of the middle candle cannot overlap the body of the other two candles.
Here is a morning star pattern on Home Depot (HD).
We do not require that the morning star be sitting on a moving average.
The third candle needs to be an up day where the close is higher than its open.
In other words, a green candle.
However, a red candle is allowed if it is a pin bar or hammer candle where the close is in the top quarter of the candle’s length.
The candle’s length is the full length of the candle including both wicks.
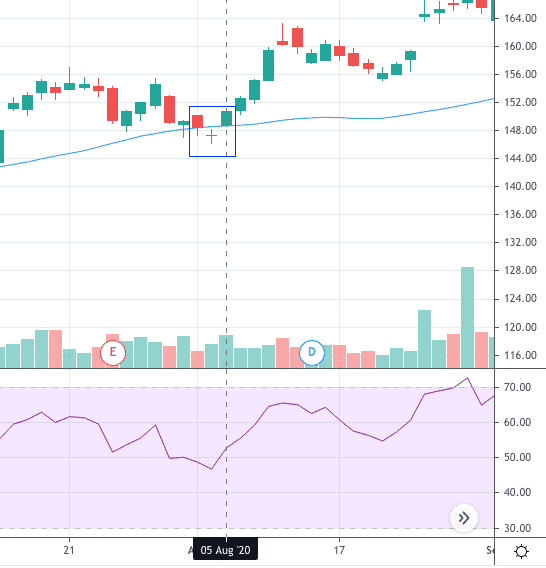
For selling weekly puts based on this pattern, we make two additional filter criteria.
The price of the third candle needs to be above the 50-day simple moving average.
And the RSI of the third candle must be above 50.
We sell enough put contracts to receive an initial premium of $200 to $300.
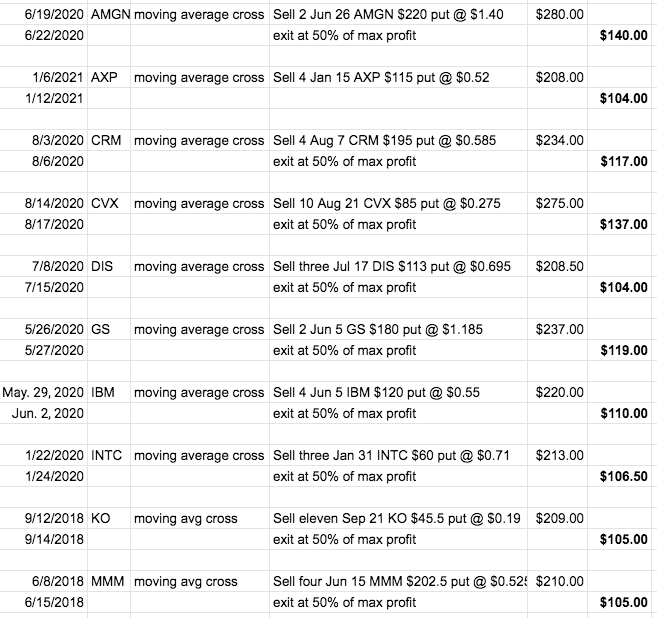
Backtest Results
Here are the back test results including the ones for HON and HD:
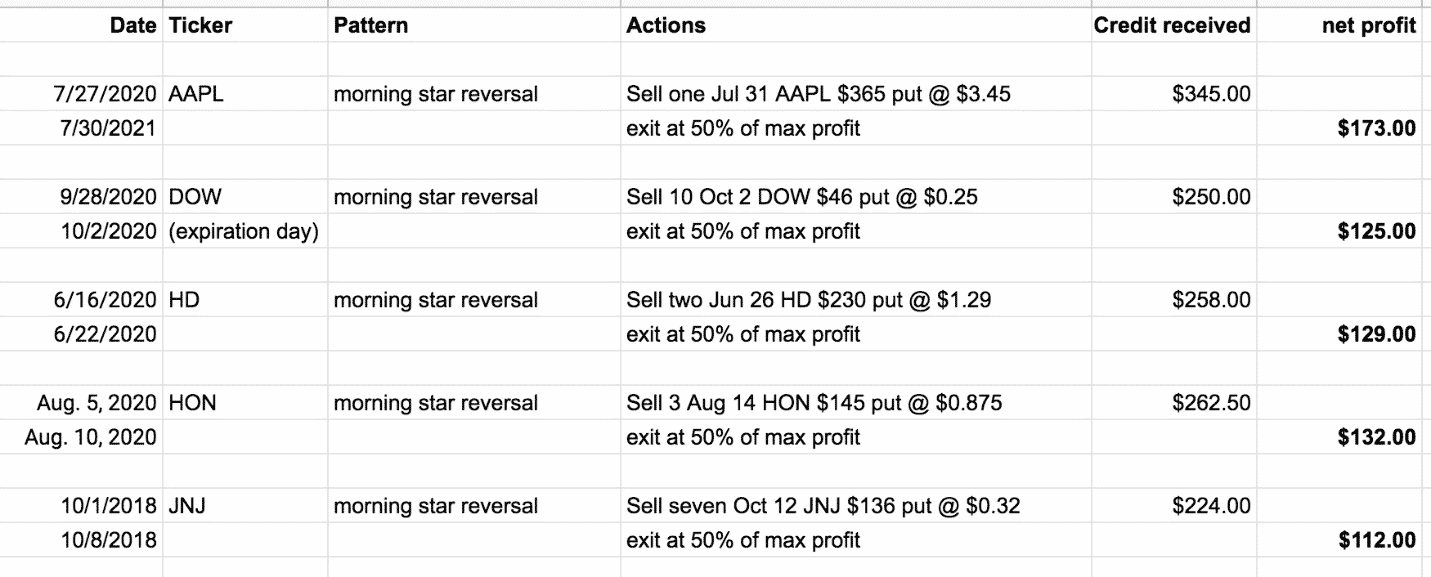
We took profit at 50% of max profit.
We would have exited the trade if the morning star pattern is violated — meaning that if there is close below the bottom of the middle candle.
So far, so good.
Hammer on the 20-day Moving Average
For the hammer pattern, we do require that the candle be touching the 20-day moving average.
Since the hammer is also a reversal pattern, we sold weekly puts only when the price is coming down into the hammer.
Here is a bullish hammer seen on McDonalds (MCD) sitting on the 20-day moving average and the price reverses up from there.
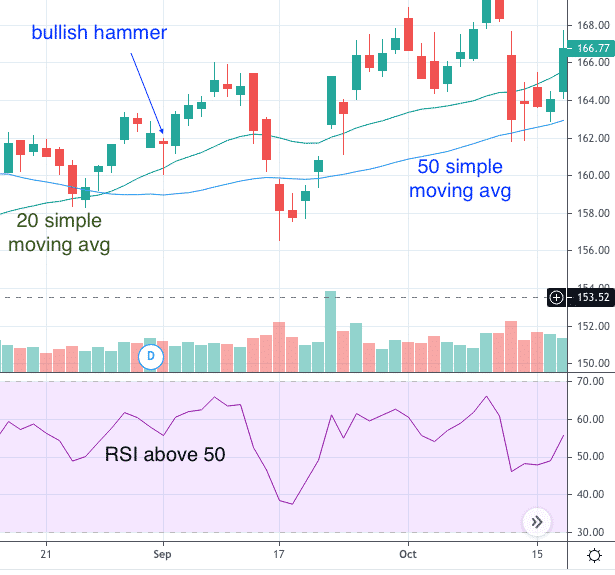
The hammer candle does not need to be green.
It just needs to have a long bottom wick and the close be within the top quarter of the candle.
The bottom wick indicates that the market participants are rejecting the prices at that level and that they think the price of MCD is valued more at the price of the close.
As before, we take these patterns only if the price is above the 50-day moving average and RSI is above 50.
And these are the results…
We would have exited the position at whatever profit and loss as soon as the price closes below the tail of the candle.
That is our stop level.
50-Day Moving Average And 50-RSI Rule
To ensure that we are getting into only bullish trades, we are using the criteria of price needing to be above the 50-day simple moving average and that its RSI be above 50.
In our randomly generated dates, the back test told us to look for signals in Boeing (BA) starting on Feb 24, 2020, right before the coronavirus selloff.
The RSI was below 50 during that time and did not come above 50 until May 21st.
Price was below the 50-day moving average during that time and did not come above it until May 21st.
This criterion prevented us from taking trades on Boeing between Feb 23 and May 20, even if patterns occurred.
That was a good thing because the chart looked very bearish.
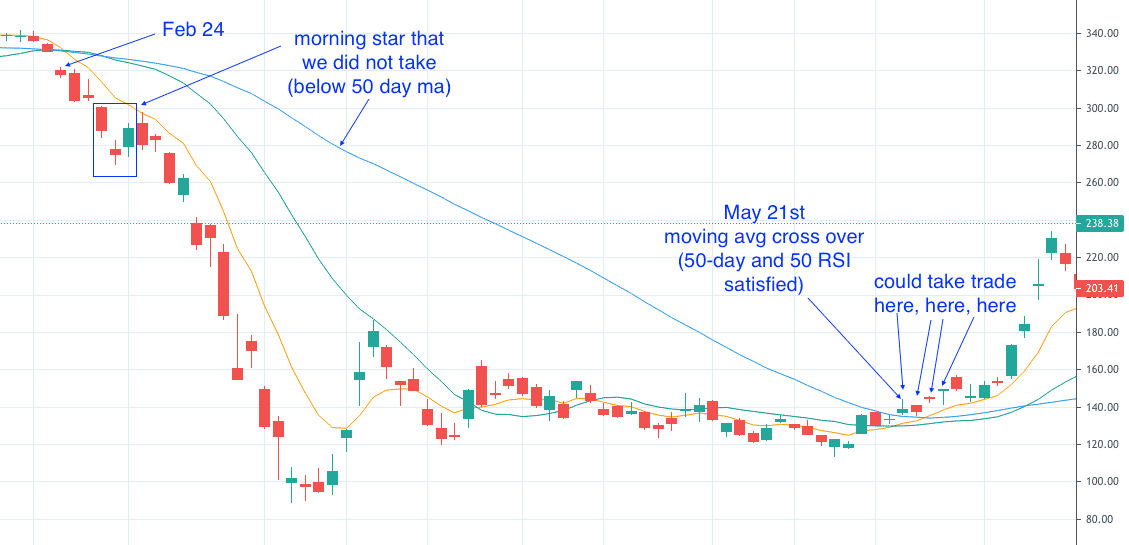
Moving Average Cross-Over
On May 21st, Boeing’s 8-day exponential moving average (orange line) crossed above its 20-day simple moving average (green line).
This is our last and most important technical signal that we look for in this back test.
On that day, the conditions are satisfied that price is above the 50-day moving average and RSI is above 50.
We also have the additional requirement that price be above the 8 exponential moving average.
Some traders may take the trade as soon as the cross over happens on the 21st.
Some may wait a day or two for further confirmation.
Other traders may wait for a bullish candle to appear as on the 27th.
All those are valid tactical moves, and it would have worked out either way.

Smaller premiums for lower price stocks.
Smaller Premiums For Lower Price Stocks
We are trying to get an initial credit in the range of $200 to $300 when selling weekly puts.
For Boeing being a higher-priced stock (around $130), we only had to sell one put.
But for Cisco (CSCO) whose price is around $40, we need to sell 10 puts to get an initial credit of $240 when we saw the moving average cross over post-earnings on November 13, 2020.
We took profit at half that at $120 on the next trading day.
Cash Secured Puts Versus Naked Puts
On margin accounts, selling 10 CSCO puts would require margin of $7,380.
On IRA cash-secured accounts, selling 10 CSCO puts would require reserving enough cash to purchase all 1000 shares of CSCO if assignment occurs at the $40.50 strike price.
That would be a cash reserve of $40,500.
When short puts are covered by available cash in the account, this is known as cash-secured puts. When it is not, it is called naked short puts.
Always be mindful when selling multiple contracts.
If we forget to check on the trade, we could end up being assigned 1000 shares of CSCO at expiration.
That is $40,500 spent.
That is more than Boeing, which only costs $13,000 if assigned.
Weekly Bull Put Spreads
If an investor does not have that amount of margin or cash on reserve, the investor can sell a bull put spread instead.
Date: Nov 13, 2020
Price: CSCO @ $41.40
Sell ten Nov 20 CSCO $40.5 put @ $0.24
Buy ten Nov 20 CSCO $38.5 put @ $0.03
Credit: $215
Max Loss: $1785
With spreads, we have a defined risk trade with a max loss of $1785.
That is the maximum margin required in a margin account.
And that is the cash needed to be on reserve in a cash-secured account.
The number is much less than that of the naked put.
The spread trade also worked out when we took a profit of $108 on the next trading day.
Stop Loss At 2X
Now we will look at JP Morgan (JPM) trade which did not work out too well.
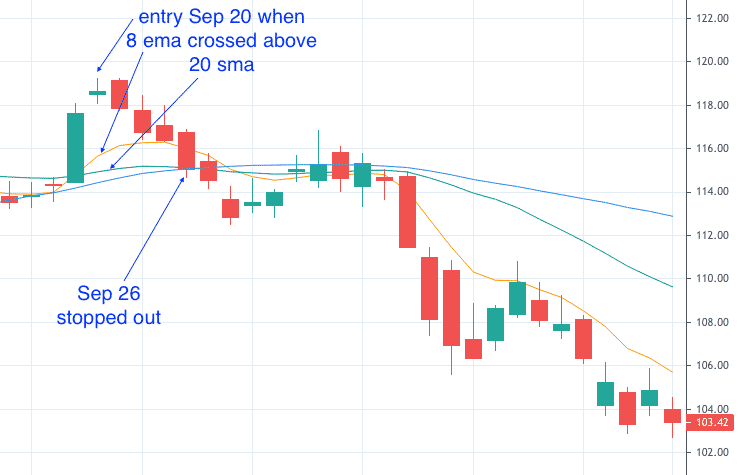
Date: Sep 20
Price: JPM @ $118.63
Sell five Sep 28 JPM $117 puts @ $0.49
Credit received: $245
Delta Dollars: $16593
Take profit level: $123
Stop loss level: $490
We are trying to get $200 to $300 in the initial credit received.
Because of the short DTE, the premium amount is small.
We had to sell 5 contracts to get a decent credit.
Selling more contracts increases our Delta Dollars exposure to $16593.
To protect capital, we need to put exit rules in place that applies to all the short-term sold put trades (not just for the moving average cross-over trades).
We will exit the trade if we get a profit of 50% of the max profit.
An automatic buy limit order is placed as soon as the order is filled.
We will exit the trade if the technical pattern is violated.
For example, if the price closes below both the 8 exponential moving average and the 20 simple moving average.
We will exit the trade if our losses exceed twice the premium amount received (some refer to this as 2X loss).
You can put in an automatic buy stop limit order to buy back the short put if the value of the option exceeds a certain amount.
However, sometimes random price and/or volatility fluctuations can trigger this and exit our position prematurely.
Or you can have a mental stop and check the P&L daily.
For this back test, we chose the latter.
Roll When Short Strike Tested
On Sep 24, JPM closed at $116.72 which is below our short strike of $117.
If the technical pattern has violated, then we would have exited the trade at this point.
In this case, our technical pattern is still intact.
The price is still above the 8, 20, and 50 moving averages.
The RSI is still above 50.
If we can do it for a credit, we will roll the short put out in time by one week and to a lower strike that is just out-of-the-money.
We can, and we do so for a net credit of $157.50:
Trade Details:
Buy to close five Sep 28 JPM $117 put @ $1.01
Sell to open five Oct 5 JPM $116 put @ $1.32
Credit: $157.50
If we cannot perform this roll for credit, then we roll to the same strike but further out in time, or we roll out two weeks in time.
We do not roll if it cost a debit, because that would mean adding money to a losing trade.
We also do not roll up to a higher strike.
If we cannot roll for a credit, and the technical pattern is intact, and our stop loss level not reached, then we do nothing.
If the short strike is still in the money the next day, we check again to see if we can roll for credit.
Whenever the price closes below the short strike, we re-adjust our take profit buy limit order to take profit at any profit (even just a penny).
Getting a losing trade to break even is considered a win.
Trade Result
Unfortunately, JPM never put in a green candle.
On September 26, JPM was dropping most of the day and our P&L shows a loss greater than $490.
We exited this back test trade at the end of the day with a total loss of $707.50.
Buy to close five Oct 5 JPM $116 put @ $2.22

It costs $1110 to buy back the 5 short-put contracts.
Optional Filters
Upon hindsight, we see that the JPM trade was entered on a doji (or spinning top) indecision candle.
While it is still within our rules, some traders might be inclined to add another filter rule to say that for moving average momentum signals, enter only on bullish candles that close (or about to close) at the top quarter of the candle.
Adding such a rule would prevent the JPM loss, but it would have prevented the wins of CAT and WBA trades which had not satisfied that rule:
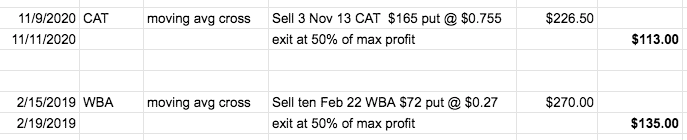
Short-term Moving Averages
Here are more back test results of selling short-term puts triggered by moving average crossovers.
Because these are short-term trades, we need a short-term moving average like the 8-day moving average.
Some traders like to use exponential moving averages for the shorter-term moving averages.
Others do not believe in them.
Some will use the 21-day exponential instead of the 20-day simple moving average.
And it is a valid point to not mix the 8 exponential with the 20-day simple. And so on.
The truth is that the lines drawn will not be that different from each other.
So, you can use whatever moving average you feel comfortable with.
Beware of Trader Euphoria
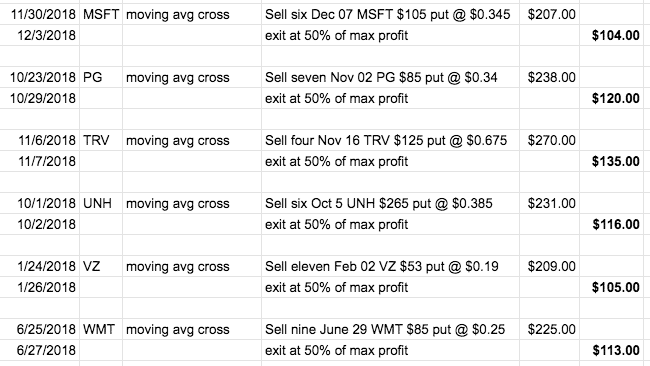
The moving average cross-over gives the most signals.
And it seems like most of those signals turn out to be winners.
Here are more results:
Do you think you have found the holy grail?
Are you getting excited yet?
Do not be.
Trader euphoria can cause a trader to increase their size too much, to take greater risk, and to become less vigilant.
And that is when the market decides to give you this trade…
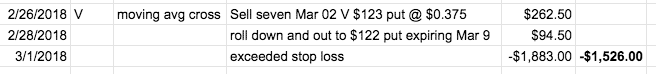
which wipes out the gains of your last 14 winning trades.
Date: Feb 26, 2018
Price: V @ $124.59
Sell seven Mar 02 V $123 put @ $0.38
Credit: $262.50
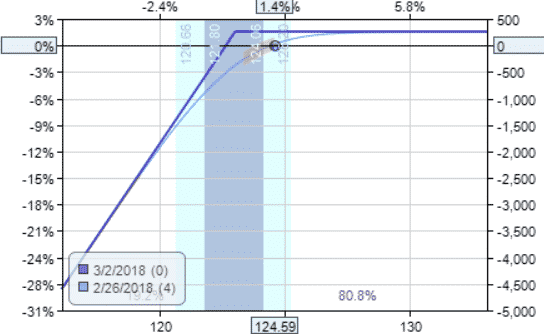
Delta Dollars: 164.87 x $124.59 = $20,541
Selling weekly put options can be risky.
You have a Delta of 165 and a Gamma of -95. It is quite directional with Delta Dollars more than $20,000 in directional exposure.
The risk graph looks like this with unlimited risk:
The chart on Visa (V) looks choppy:
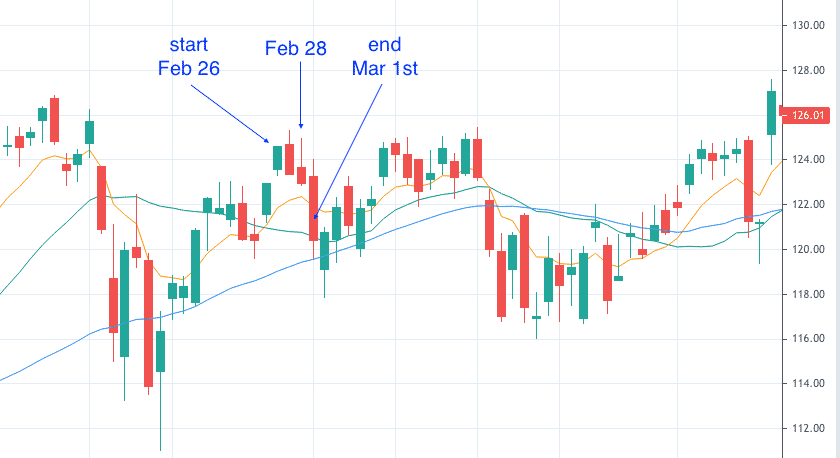
On February 28, V closed at $122.94 which is below our strike price of $123.
The technical pattern is still intact, so we roll down and out for a credit of $94.50.
Trade Details:
Buy to close seven Mar 02 V $123 put @ $0.555
Sell to open seven Mar 09 V $122 put @ $0.69
The next trading day March 1st starts with our P&L around –$475 and has not yet reached our stop loss.
But by the end of the day, our loss balloons to –$1526 and it costs a lot to buy to exit the 7 contracts.
But that is what we must do to honor our pre-determined stop loss.
Date: March 01, 2018
Price: $120.40
Buy to close seven Mar 09 V $122 put @ $2.69
Debit: $1883
The stock did not make a drastic of a move (down 2% that day). Yet the P&L can change by a thousand dollars per day.
This is not unusual for a Delta Dollars this large — because we are selling 7 contracts.
An investor who owns 700 shares of Visa would have lost $2000 that day.
And would have lost almost $3000 from where Visa started on February 26.
Implied Volatility (IV)
At the start of the trade, the implied volatility (IV) of the Visa $123 strike put was at 19 and the option is selling for $0.38 per share.
This is low.
Because on November 5 of that same year, a put with the same 4 days-to-expiration at about the same 25 Delta has an IV of 32 and is selling for $0.77.
We would only need to sell 3 puts (instead of 7) to receive an initial credit in the $200 to $300 range.
This brings our Delta Dollars exposure way down to $10,672 instead of $20,541.
And for an IRA account, we need to tie up about $42,000 in cash rather than $87,000.
This is one of the advantages of selling options when IV is high.
Some traders will not sell options if IV is below a certain level. Although we did not implement this rule in our back test.
Because each stock has different levels of IV, we tend to use IV Rank percentage that ranges from 0% to 100%.
This tells us where the stock’s IV is in relation to its IV range within the past year.
Problem with High Probably Trades
We are selling puts anywhere between 10 Delta to 30 Delta using discretion based on how much credit we can get and if there are any technical support or resistance behind the strike, and so on.
A put sold at the 20 Delta has an 80% chance of being out-of-the-money at expiration.
Statistically, our trades should be winning 80% of the time.
So, the string of wins that you saw is not unexpected.
This is a high probability strategy, just like selling far out-of-the-money credit spread and iron condors are high probability strategies.
In our back test of 30 stocks, we had 28 wins and 2 losses. That is a win rate of 93%.
This is better than what the Delta statistics would predict because option probability statistics do not know technical analysis.
We had used technical patterns to select out trades that have a higher chance of going in our direction.
While the win rate is great, the problem with high probability strategies is that the wins are smaller than the losses.
The risk to reward ratio is poor.
Our average win was $119. Our average loss was $1117.
This is a risk to reward ratio of about 9.
Plugging our resulting numbers into “Trader’s Equation” …
(Percent Winner x Avg Win) = (Percent losers x Avg Loss)
93 x 119 > 7 x 1117
11,067 > 7,819
The resultant value that comes out of the equation is not relevant.
What is important is that the left-hand side is greater than the right-hand side.
This is a positive expectancy.
This means that according to this back test, the strategy should be a winning strategy if it is run with enough occurrences.
And indeed, our back test of 30 trades gave us a net profit of $1101.
Back Tests For You To Try
We are not saying that these are the only bullish technical signals that work, nor are we saying that these are the best.
These are the ones we happen to be using for this back test.
You should back test using your own favorite indicators and technical patterns.
Try out different moving average crossovers.
Or try doing the back test with taking profit at 75% of the max profit instead of our 50% that we used.
Or what about if you see a bullish engulfing pattern at the 20-day moving average.
Is that as good as seeing a hammer?
Run the back test and see.
To keep our back test simple, we are only selling naked puts.
You can and should certainly do the same back test for spreads.
Selling Weekly Puts Mechanically on the Indices
Don’t want to worry about earnings and assignments?
Sell puts on the cash-settled indices instead: SPX, RUT, and NDX.
Do not want to look for technical patterns?
Run the back test to see what happens if you sell puts mechanically every Monday and holding to expiration that Friday.
Does it make a difference if you sell every Friday and hold to expiration next Friday (capturing the time decay over the weekend)?
It probably will turn out good if the market is in an uptrend.
But what happens if the market is in a downtrend?
Not so good right?
In that case, what indicator can tell you best whether the market is in an uptrend or not?
The 8 and 20 cross-over perhaps?
Maybe the popular MACD? Or the less obvious ADX?
Or can it be as simple as if stock is over or below the 50-day simple moving average?
If you find such an indicator, you can sell puts only during bullish times.
These are questions that you cannot easily find on Google.
And if you do find them, how much are you going to believe them?
To have confidence in your belief you must back test them yourself.
Otherwise, it can be expensive if you experiment with real money in the live market.
We were using OptionNet Explorer to get our historic option prices.
But you can get the same using the ThinkBack feature of ThinkOrSwim.
Conclusion
We hope you enjoyed this article on selling weekly put options for income.
Hopefully it has given you something to think about before you go ahead and blindly start selling puts.
Be aware of the risks with any strategy and as always, trade safe!
Disclaimer: The information above is for educational purposes only and should not be treated as investment advice. The strategy presented would not be suitable for investors who are not familiar with exchange traded options. Any readers interested in this strategy should do their own research and seek advice from a licensed financial adviser.


do you refer to daily timeframes?
In what capacity? I tend to focus on the daily timeframe, then you can drill down further to a 30min chart to find a good entry for short-term trades.
Dear Gav..
Do you think this criteria could apply to buying call insted of selling puts?
I think doing that reduce the risk because the maximum loss is the debit we paid, But I dont know it will work due time decay