


Today, we’re looking a the high wave candlestick pattern.
It is an indecision candle an can signal a lack of directional bias after a considerable trend.
Periods of indecision in price action are a common phenomenon while trading financial instruments.
Amid the oscillations that come into play, consolidations do occur, resulting in price moving without any clear direction.
The High Wave Candlestick pattern does manifest itself whenever price moves to a support or resistance level.
Contents
- What is A High Wave Candlestick Pattern?
- Continuation Pattern
- Reversal Sign
- High Wave Reversal Pattern Confirmation
- Bottom Line
What is A High Wave Candlestick Pattern?
A high wave candlestick pattern is an indecision pattern that shows the market is neither bullish nor bearish.
It mostly occurs at support and resistance levels.
This is where bears and bulls battle each other in the effort of trying to push the price in a given direction.
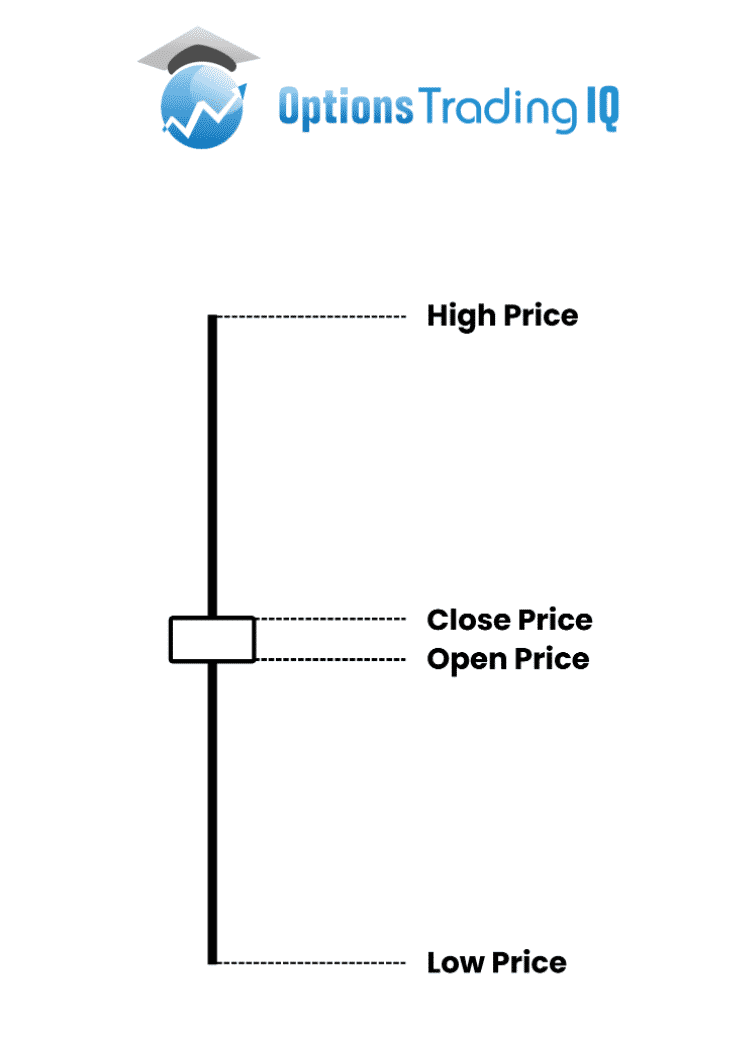
Candlesticks depict the pattern with long lower shadows and long upper wicks.
Likewise, they have small bodies.
The long wicks signal there was a large amount of price movement during the given period.
However, the price ultimately ended up closing near the opening price.
In most cases, buyers try to push prices higher but face strong resistance.
Likewise, sellers try to send prices lower but face strong opposition.
Neither succeeds in driving price in a given direction, resulting in the candlestick closing near where it opened.
Continuation and Reversal Efficiency
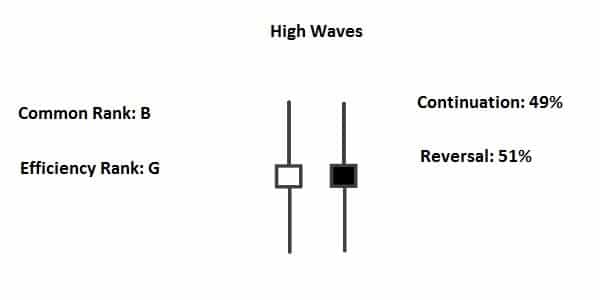
Source: Feedroll.com
Whenever the candlestick appears after the price has moved significantly in a given direction, it could signal a lack of momentum.
For instance, if a stock was trending upwards, but hitting resistance and the candlestick pattern emerges.
This could be a warning sign that bulls are losing momentum.
Source: Tradeciety.comThe candlestick pattern signals a sudden expansion in volatility that is followed by contraction.
Once the pattern emerges, contraction occurs, resulting in a trading range.
In this case, bulls would struggle to push the price above a previous high.
Consequently, the high wave candlestick pattern can signal an end to the current trend.
Continuation Pattern
A high wave candlestick pattern can occur anywhere on the stock or currency pair price chart.
Were the pattern to appear in the middle of a move, upwards or downwards, it might be interpreted as part of a continuation pattern.
For instance, a consolidation could come into play if a stock is trending up and the high wave candlestick pattern occurs.
After a few swings, high and lows in a range price could break out of the range and continue moving up.
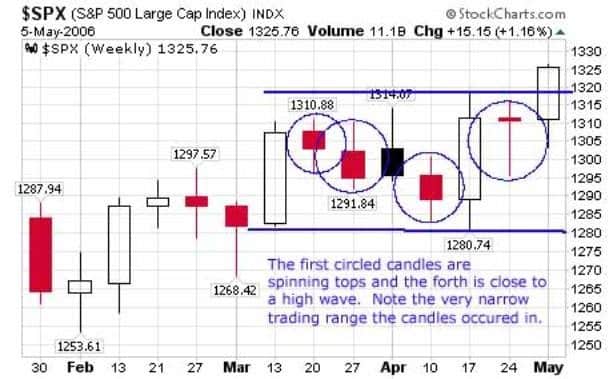
Source: Investinganswers.com
In the chart above, the S&P 500 was trending up; however, after rising to the 1315 level, it hit resistance and started pulling back.
The first three circled candlesticks indicate price moving lower.
On the fourth day, a high wave candlestick emerged.
Afterwards, the price reversed from the downtrend and started moving up in the continuation of the long-term uptrend.
Similarly, were the high wave candlesticks to occur in a stock trending lower, a range may come into play, resulting in sideways action.
Once the consolidation comes to an end, the price could break out and continue moving lower in continuation of the long-term downtrend.
Reversal Sign
Additionally, candlesticks with long wicks and small bodies after a strong trend will often signal a potential reversal from the underlying trend.
If the price were trending lower, the pattern could signal price rejection at current lows resulting in a bounce-back.
Likewise, if the price were trending up and the high wave pattern occurred, it could signal that the upward momentum is losing steam.
The long wick at the top of the candle could signal price rejection resulting in price consolidating in a range before it pulls lower.
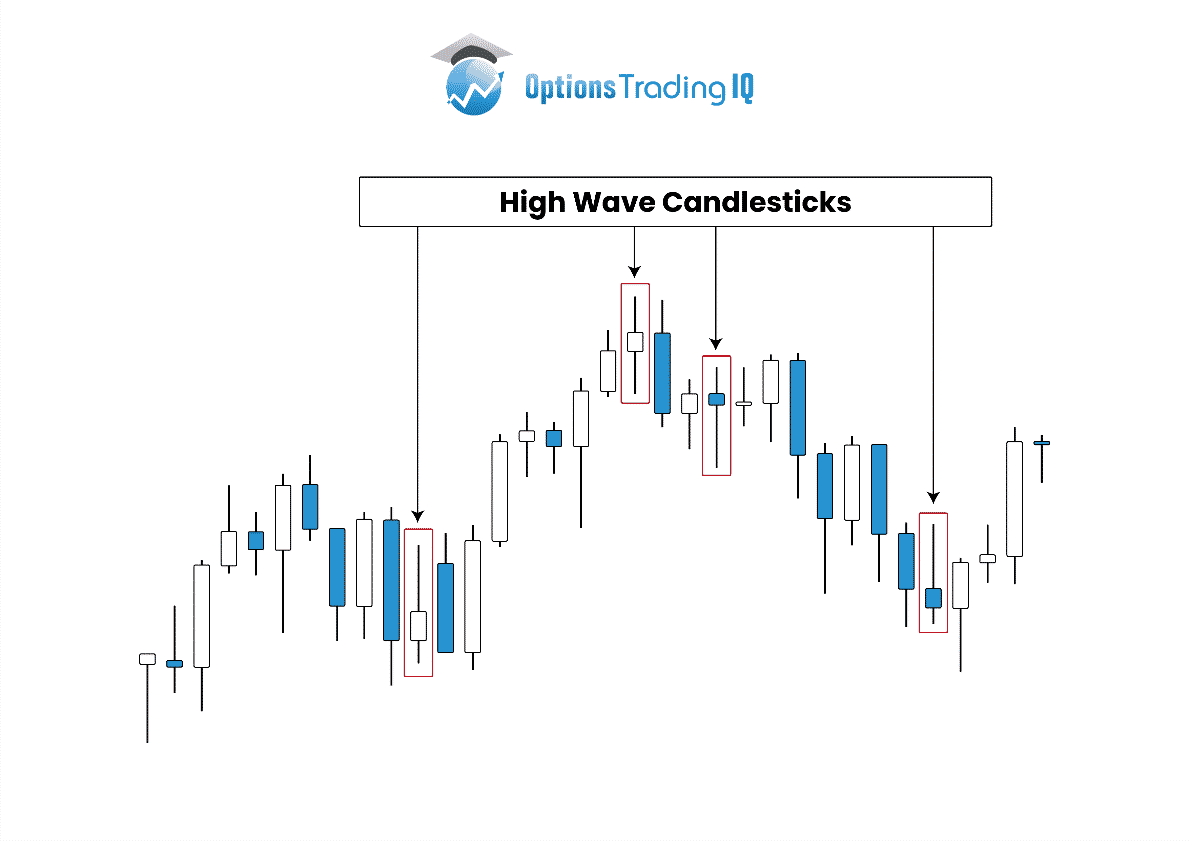
The chart above shows that whenever the high wave candlestick emerged, the price ended up reversing and started moving in the opposite direction.
If the price was moving up and the high wave candlestick emerged, a sell-off came into play, and the price started edging lower. Similarly, when the price is moving lower, and it occurred, a reversal occurred afterward, resulting in upward swings.
While not a reliable pattern for predicting price reversals, it is documented that the occurrence of the high wave candlestick pattern often results in price reversals 51% of the time.
Therefore, it cannot be relied upon on its own to predict a reversal.
High Wave Reversal Pattern Confirmation
While the high wave candlestick is not a reliable candlestick pattern for predicting price reversal or continuation, it is important to wait for confirmation before entering a trade in either direction.
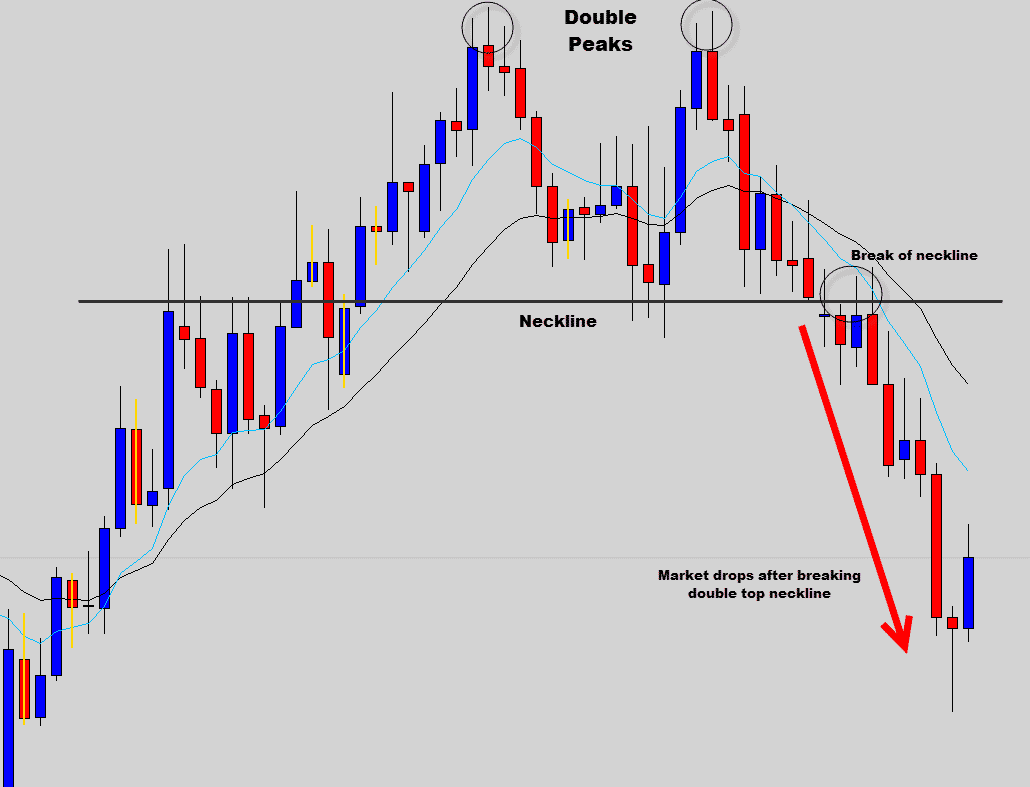
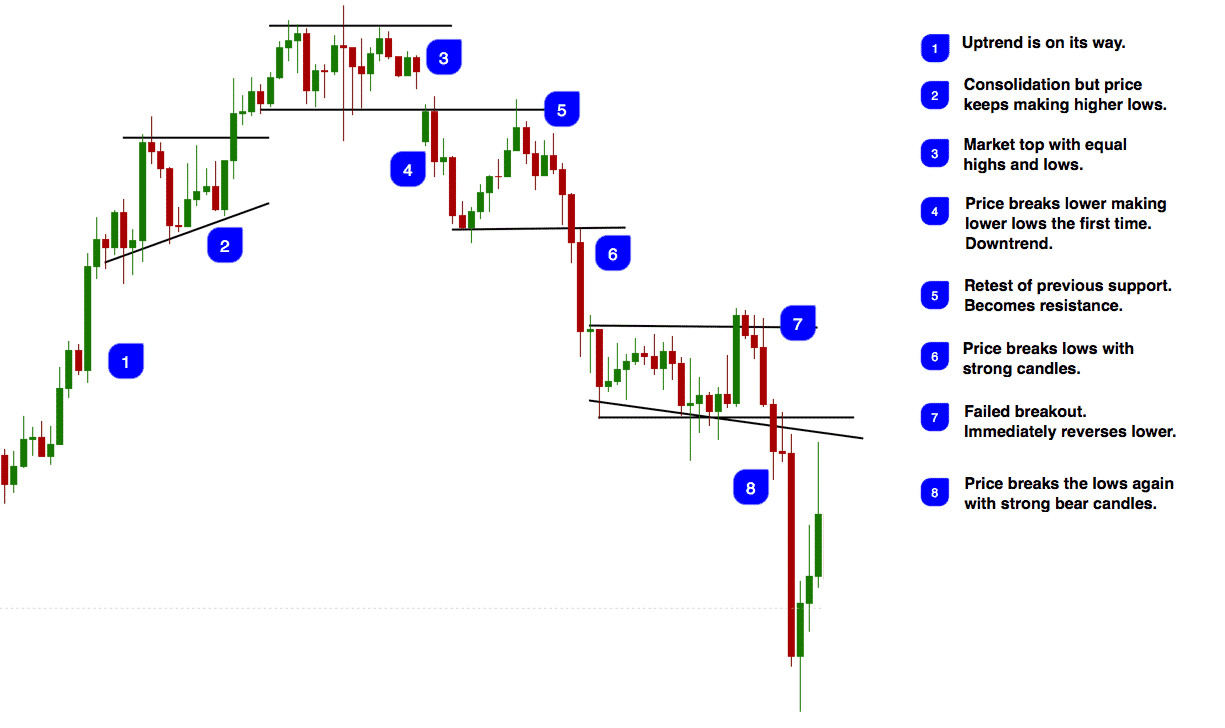
Source: Theforexguy.com
A closer look at the chart above, it is clear that the price was trending up.
Upon the emergence of a high wave candle, a trader might be tempted to enter a short position at the top.
However, we can see that the price dropped to the neckline and then started edging higher.
A confirmation that a reversal was in play was when the price was rejected near the top resulting in a double top immediately followed by ferocious sell-off.
Bottom line
A high wave candlestick pattern occurs whenever the market struggles to reach a consensus on the price of the underlying asset.
It signals uncertainty and indecision on the direction that the price should move.
If the price was moving up or down and the pattern occurs, a tight trading range often comes into play as bears and bulls jostle to push the price in either direction.
After consolidation, the price might move in the direction of the prevailing trend on breaking support or resistance level.
In some cases, the high wave pattern often results in price reversals once the consolidation phase ends.
If the indecision candlestick were to occur in high volume, the same could affirm general confusion about the direction process is headed.
Trade safe!
Disclaimer: The information above is for educational purposes only and should not be treated as investment advice. The strategy presented would not be suitable for investors who are not familiar with exchange traded options. Any readers interested in this strategy should do their own research and seek advice from a licensed financial adviser.


