
Contents
What Is The Anchored VWAP?
The anchored VWAP (volume-weighted average price) is an indicator that provides a dynamic look at where the volume-weighted average stock price is.
It works very similarly to the regular VWAP but anchors it to a specific price point to start its calculation.
The standard VWAP indicator averages a stock’s price based on volume and time over a given period.
The anchored VWAP allows traders to set a starting point or “anchor” at a price they consider significant.

The indicator then calculates a new VWAP line from the anchor point using the typical volume/time-weighted formula.
As the price moves away from the anchor, a new VWAP level is plotted that better reflects the current volume-weighted price.
The key benefit of anchored VWAP over the regular VWAP is that the anchor point can be manually moved over time to account for changes in a stock’s trend and volatility.
This allows traders to continually update where the calculation starts to keep it relevant to current market conditions.
Below is a quick explanation of how it is calculated.
How to Calculate Anchored VWAP
Anchored VWAP = Cumulative [(Volume x (Close)) / Cumulative Volume]
Where:
Volume = The volume traded at each candle
Close = The closing price at each candle
Why Use Anchored VWAP?
Now that you know what the Anchored VWAP is, let’s go over why you would use it:
1. It provides dynamic support and resistance levels. Based on the chosen anchor point, the anchored VWAP line acts as a dynamic support/resistance level. Price tends to react around these AVWAP levels, allowing traders to enter and exit positions based on this level.
2. It helps identify trends and reversals. When the price crosses above or below the anchored VWAP line, it can signal a potential reversal. Traders watch for these crosses to help gauge possible trend changes.
3. It gives a view of fair value – Technically, the Anchored VWAP gives you the fair value of the stock you are looking at since the anchor point. Because it takes volume into consideration, it is basically a moving-like way to show the most heavily transacted prices over time.
4. Customization – The Anchoring of the VWAP is what makes it customizable. You could Achor VWAPs to highs and lows on multiple timeframes to see multiple views of what the market is considering fair value. You could also set the Anchor points to the new day to show the fair value of that day. More on this below though
Choosing The Anchor Point
The anchor point is arguably the most important part of this indicator.
This is the starting price level where the calculation will begin, and if it is selected wrong, it could throw off how effective it is for you and your trading.
Here are some guidelines for selecting a good anchor point:
– Look for Recent Highs and Lows
– Look for the time-based anchor points (Every Day, Every 4hrs, Every Week)
– Daily or Weekly Pivot Points
– News/Event reference points (such as the high/low of a rapid move)
Remember, the anchor point is critically important.
It could throw off the rest of your analysis if it’s not at a good level, such as just the middle of a move.
Anchored VWAP Trading Strategies
Now that we have seen why it can be such an effective tool let’s look at some trading strategies we can use.
A pullback to Anchored VWAP
This is a very simple strategy and possibly the most commonly used one.
When the price trades either above or below the Anchored VWAP, you wait for it to pull back to the VWAP line.
Once there, you look to enter in the prevailing direction of the price.
That’s it; It works like any other Moving average bounce entry would work.
Trade management for this type of entry could look one of a few ways.
1. Trail the stop a few points above/below the Anchored VWAP. This allows you to maximize your chances of catching most of the potential move. If the trade works out, it also moves your stop into profit.
2. Fixed Stop Loss and Take Profit. This is just a standard bracket according to your normal trading rules.
3. Low to high/High to low trade management would be putting your stop loss and taking profit above/below the recent swing high/low, depending on if you are taking a trade long or short.
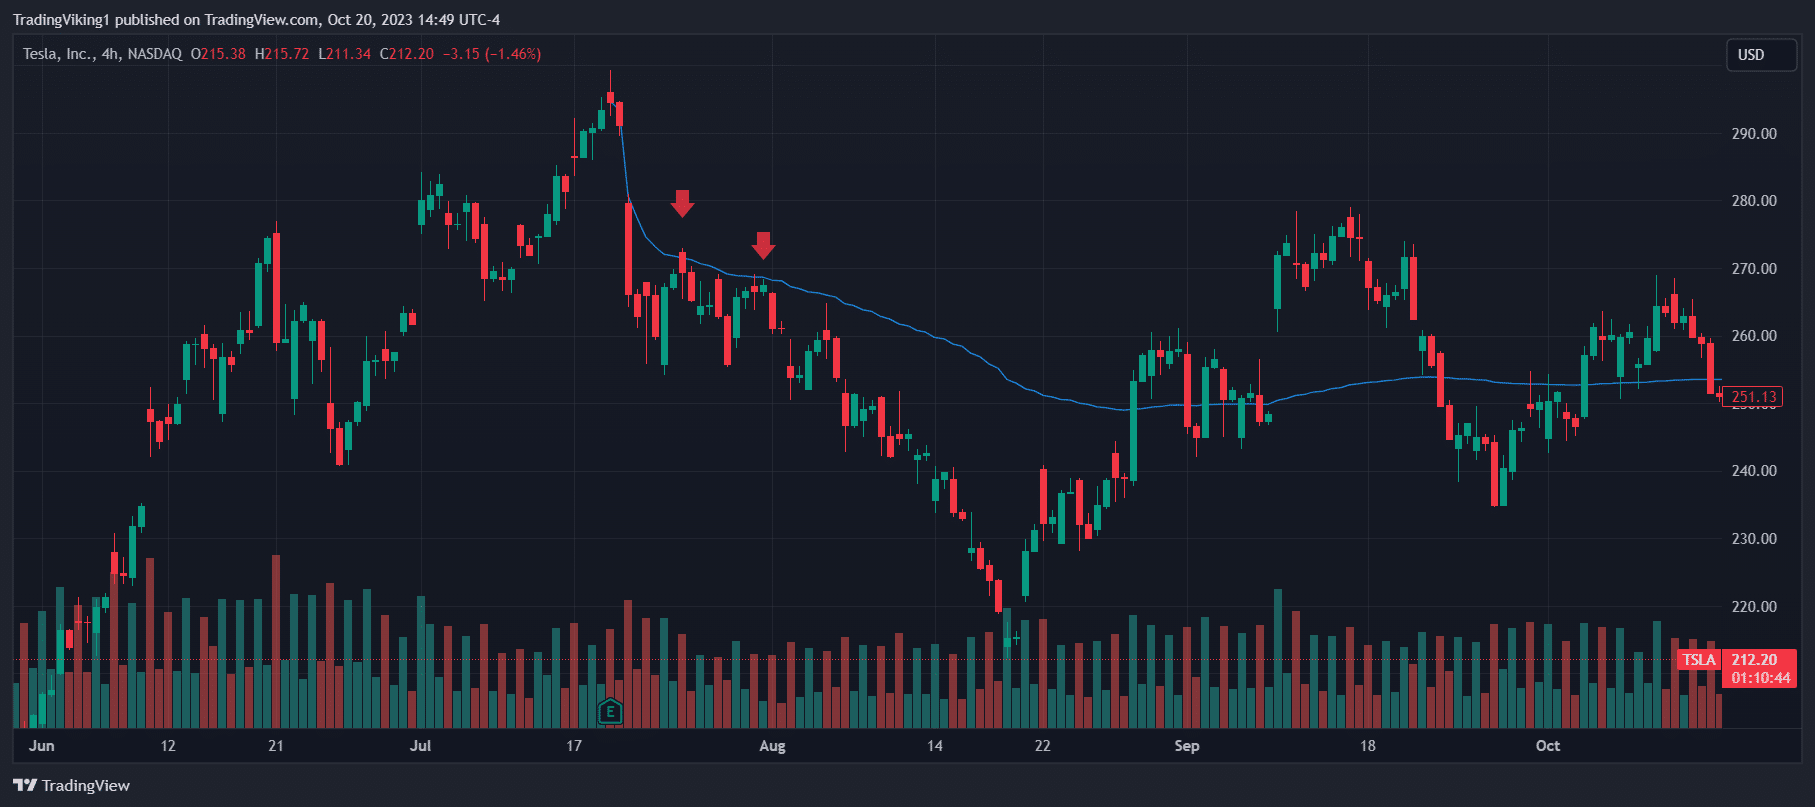
Below is a perfect example of a pullback trade that gave you a few separate entries without stopping you out.
Anchoring the VWAP to the swing high before the TSLA earnings in July would have given you a few opportunities to short (the red arrows above the blue line).
You could have trailed the stop loss along the Anchored VWAP and taken profit after the price gapped up near the bottom.

Continuation/Momentum Trade
The anchored VWAP can be used for time entries for uptrends and downtrends.
Below is an example of a short entry, but the same also holds true for the long side.
Draw the anchored VWAP from a recent swing high in a downtrend and wait for the price to retrace above the Anchored VWAP price.
Once the price starts pushing back below the Anchored VWAP, short the stock, place your stop above the local top, and take profit when momentum runs out.
When combined with other indicators, the Anchored VWAP can become an even more powerful trading tool.
They can be used to filter out bad entries, determine when to exit, or just confirm your trade.
The RSI, MACD, and Momentum Indicators are some of the more common indicators.
Anchored VWAP Settings And Timeframes
Since the Anchored VWAP is so customizable, there are no real one-size-fits-all solutions to settings and timeframe.
Because of that, be wary of any site that says to have found the best setting; with that said, below are some great baseline settings to start off using the Anchored VWAP.
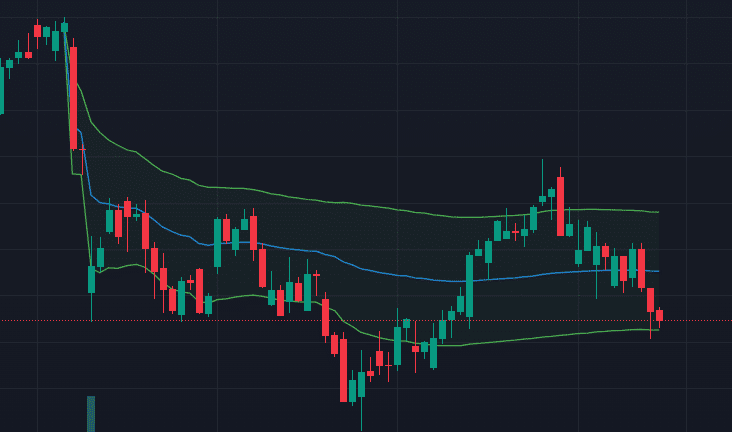
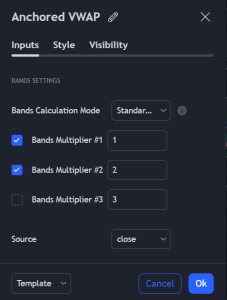
Standard Deviations – Some Anchored VWAPs can put standard deviation bands around the actual VWAP line. Like Bollinger Bands, the number of standard Deviations is how wide these bands will spread from the VWAP line.

Calculation Method – Almost all Anchored VWAP indicators will let you choose how to calculate the VWAP at each candle. A good starting point is to just use the close, but OHLC is also a solid starting point. Once you understand how Anchored VWAP works, playing around with the calculation method may make your trading more efficient.
Anchored VWAP can be used on any timeframe but works well on the following for each type of use.
Daily – Use for major trend and support/resistance analysis.
4-Hour – Good for swing trading and refining levels from the daily. It can be a powerful timeframe combined with options spreads or cash-secured puts.
Hourly – Good for intraday trades and finding opportunities within the daily trend.
5 to 15 Min – Use for scalping setups once a trend is established. You can either scalp around the higher timeframe Anchored VWAP or create a new one on your preferred trading chart for entries and exits.
Higher timeframes work extremely well for setting more powerful anchor points and provide some strong support and resistance levels between the actual Anchored VWAP and the Bands.
A really powerful way to use the higher timeframes is to Plot them on your trading chart so that you can execute them quickly when the price interacts with them.
Limitations Of Anchored VWAP
We have seen the Anchored VWAP, why you would choose it, and finally, how to trade it.
So, let’s look at the limitations of the Anchored VWAP.
1. Subjective Anchoring – Different traders will anchor to different points. This subjectivity can make it difficult to trade for some because there is complete freedom in picking your anchor point.
2. It requires active adjustment – Unlike other indicators like the RSI or MACD, where you can just put it on your chart and forget about it, the Anchored VWAP will require you to change the Anchor points as the market moves and conditions change.
3. Price Lag – Like all averages, the more data you pull into the calculation, the more it lags the price, so similar to the active adjustment above, the further back your anchor point, the more the Average Price will lag the actual price.
4. The trend is your Friend – Anchored VWAP tends to work best in trending conditions. When the price is ranging, it has a strong tendency to give false signals.
The Anchored VWAP offers a lot of positive potential when trading, but as you can see, it’s not without its limitations.
When used correctly, one can manage these limitations to provide actionable trade signals.
Fine Tuning And Wrapping It Up
The Anchored VWAP is an incredibly useful tool when used correctly.
It has some powerful potential, whether you use it as a stand-alone indicator or as part of a larger trading style.
The key with anchored VWAP is choosing an appropriate anchor point on which to base your calculations.
While beginning traders may stick with a single anchor for prolonged periods, more advanced traders may continually update their Anchor points as the price adjusts.
The best implementations of the Anchored VWAP balance adapting to new levels while still maintaining some of your higher-level anchor points.
As you become more proficient with the Anchored VWAP, you will see patterns emerge on which points need to be adjusted and which points should not.
When you hit this level in your trading, you will see the true power the Anchored VWAP can provide you.
We hope you enjoyed this article on anchored VWAP.
If you have any questions, please send an email or leave a comment below.
Trade safe!
Disclaimer: The information above is for educational purposes only and should not be treated as investment advice. The strategy presented would not be suitable for investors who are not familiar with exchange traded options. Any readers interested in this strategy should do their own research and seek advice from a licensed financial adviser.


