


The “long strangle squeeze” may conjure up a graphic image no one wants to be in.
But after seeing this trade example, many would have wanted to be in this trade.
Contents
Long Strangle Squeeze
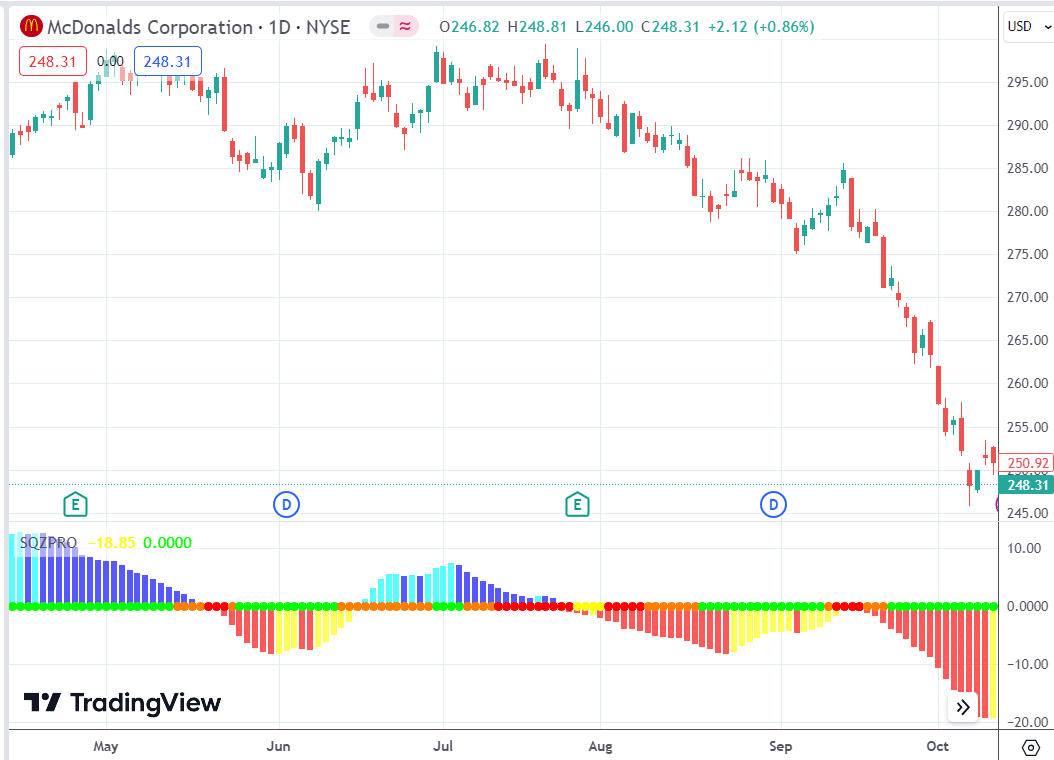
On September 18, 2023, we saw three red dots in the Squeeze Pro indicator on McDonald’s chart.
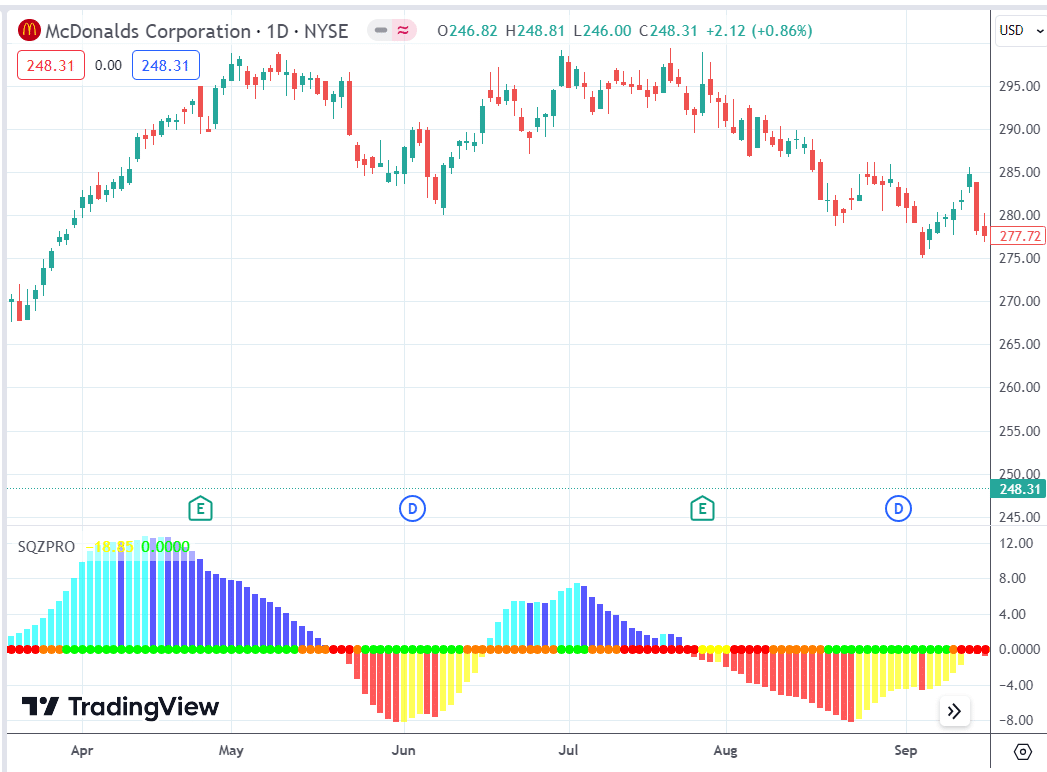
See the FAQ below for the exact indicator shown here in TradingView.
It is good to wait for at least two red dots before considering it a valid “squeeze.”
A squeeze means that the price is in consolidation.
After a consolidation, the price will typically expand, moving either up or down to a new price level to consolidate.
We want to capture this move.
When this move happens, we say the squeeze has fired, and the red dots turn green.
While some traders wait for the squeeze to fire before putting on the trade, others prefer to be in the trade before it fires.
This squeeze firing would suggest that McDonald’s will make a “greater than expected move.”
In general, if the stock makes an “expected move,” then a long call or a long put would either breakeven or not make much money because the option’s price is already priced in the expected move.
In addition, any profits from the long call or long put are being dragged down by the time value decay of the long options.
However, if the stock makes a greater than expected move, buying options can be profitable, especially if the trader buys the options with expiration right after an earnings announcement.
Although it was not confirmed then, McDonald’s shows an earnings announcement on October 26 before the market opens.
Therefore, the trader buys the call option and the put options, expiring on October 27 (after the earnings announcement), figuring that the options will hold their value better and not decay as fast.
Call options and puts options expiring right after an earnings date are in greater demand because investors want them for protection or speculation of the earning event price move.
Investors holding those options will not likely want to sell them until after the earnings announcement, when we would already be out of the trade.
We do not want to hold the trade through the earnings date.
So let’s buy a call and put option on September 18 with expirations on October 27.
This option structure is known as a strangle. It is known as a long strangle because we buy the options instead of selling them.
Date: September 18, 2023
Price: MCD @ $278
Buy one October 27 MCD $280 call @ $3.70
Buy one October 27 MCD $275 put @ $6.00
Net debit: -$970
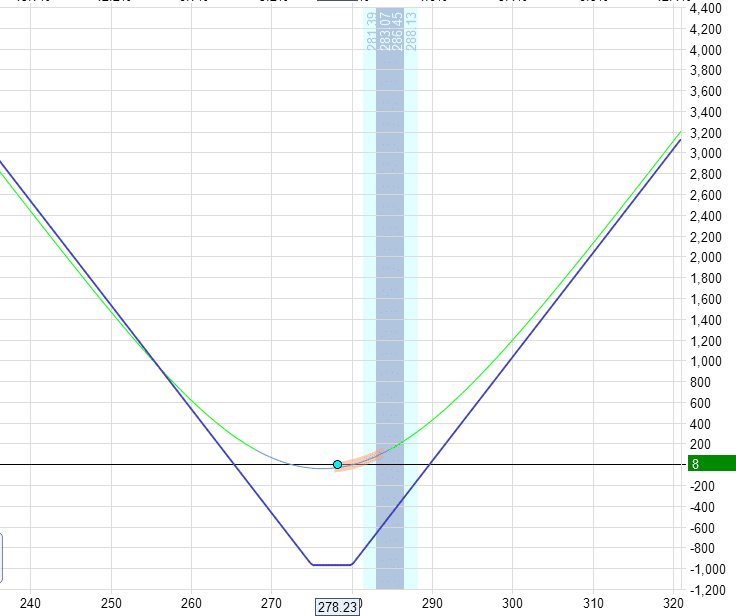
The max risk on this trade is the debit paid -$970.
We have a pre-determined mental stop loss of 25% of our investment.
So when we check in on our trade daily, if we see our P&L drop below -$240, we will exit the trade to cut our loss.
We plan to exit the trade on October 25 or before the earnings announcement.
Since this is not an earnings trade, we don’t want to hold the trade through the earnings announcement.
While it may seem good to hold the trade through earnings to see if the stock makes a large move that will benefit the trade.
The risk is that implied volatility drops right after the announcement, drastically decreasing the value of our long call and long put options.
This drop is known as a volatility crush and may impact our trade more negatively than the stock’s post-earnings move.
It is an easy choice if we have a positive P&L before the announcement.
Just exit the trade instead of risking the profits.
Otherwise, you can take the gamble on the earnings announcement.
Squeeze Fired
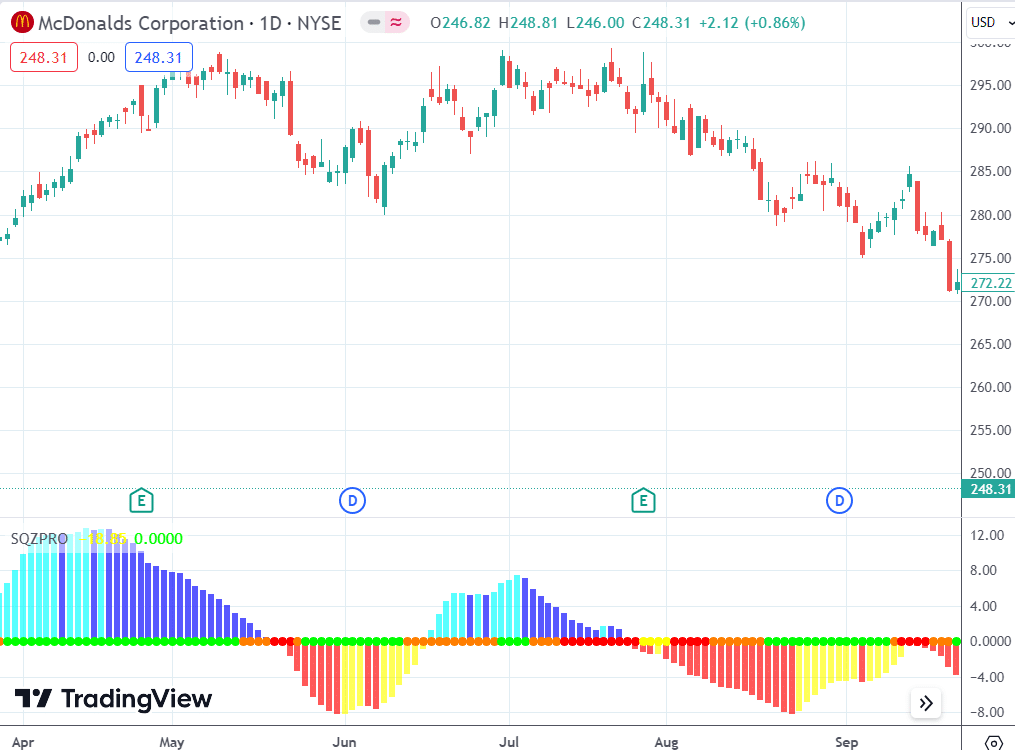
We see a green dot at the end of the week on September 22.
The squeeze has fired.
The stock is starting to move (which is what we want in a long strangle).
Early Take Profit or Scale-Out
On September 26, the MCD strangle can be sold at $1108, giving the trader a $138 profit or a 14% return on capital at risk.
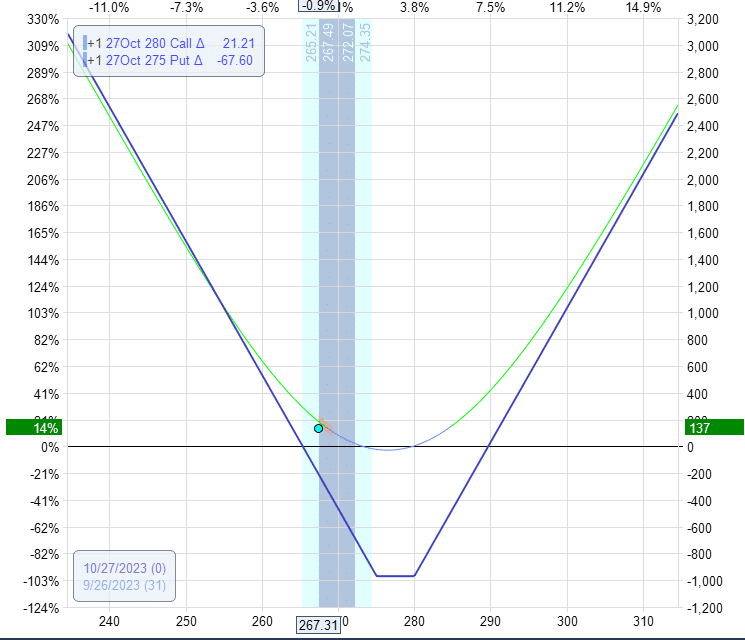
Unless one is very good at technical analysis, it isn’t easy to know when the down move ends and to take off the trade.
Some traders may decide to take the position off based on the profits achieved.
Others may decide based on price action and technicals.
This is what the candlesticks looked like on September 26:
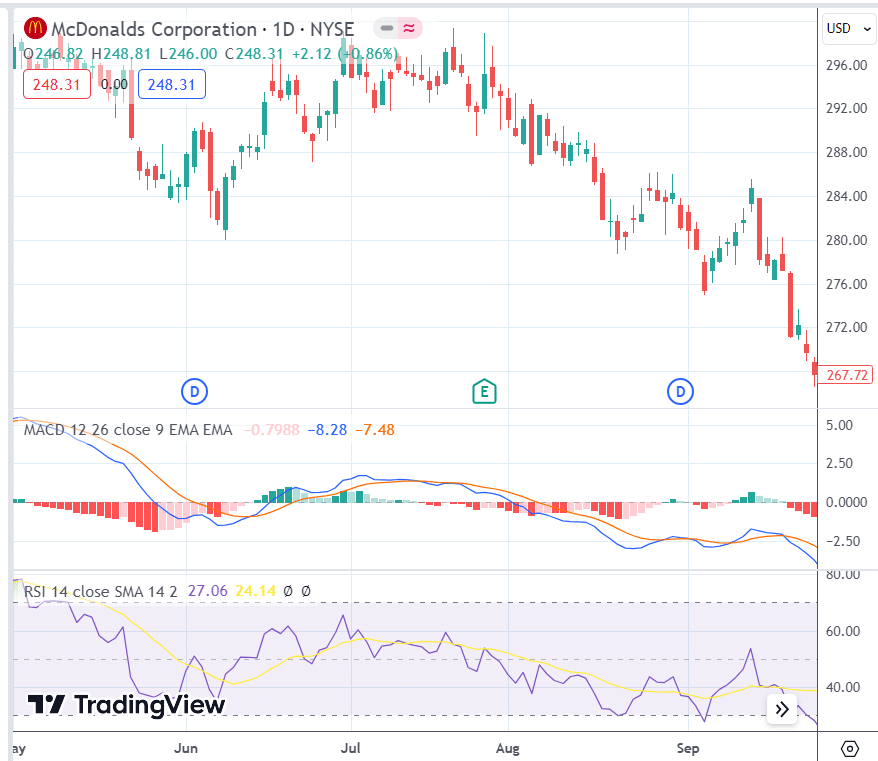
Here, we see that RSI (with default settings) had dipped into the oversold condition, which might have been what prompted a technical trader to take off the trade and lock in the profits.
Traders who have bought multiple strangles could have scaled out of the position without exiting all contracts.
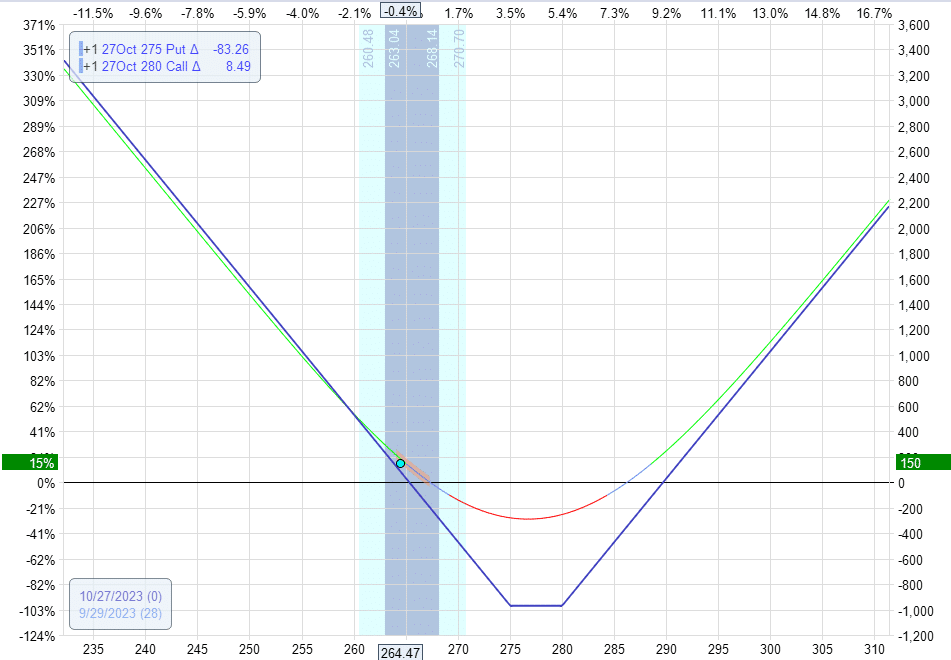
Other Technicals
Other traders may look for a turn back up on the MACD histogram; this happened on September 28:
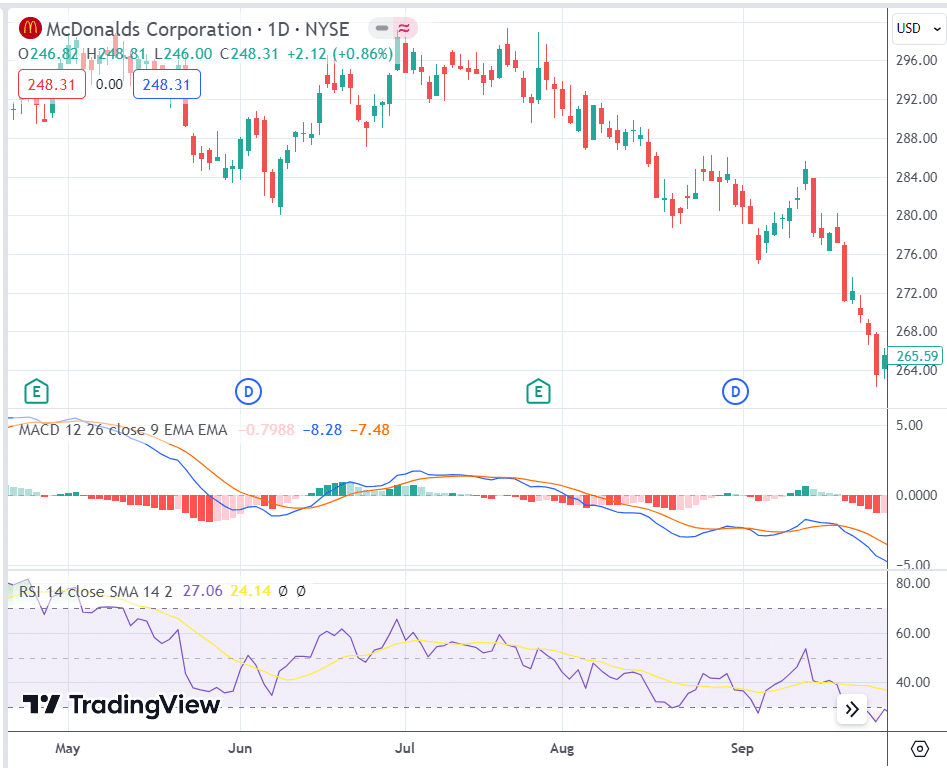
See how the MACD histogram went from bright red to pink.
A trader selling the strangle the next day, on September 29, after seeing this would reap a profit of $150, or 15%.
100% Return on Risk
On October 5, the profits would have exceeded the $1000 mark and would have given the trader a 100% return on investment:
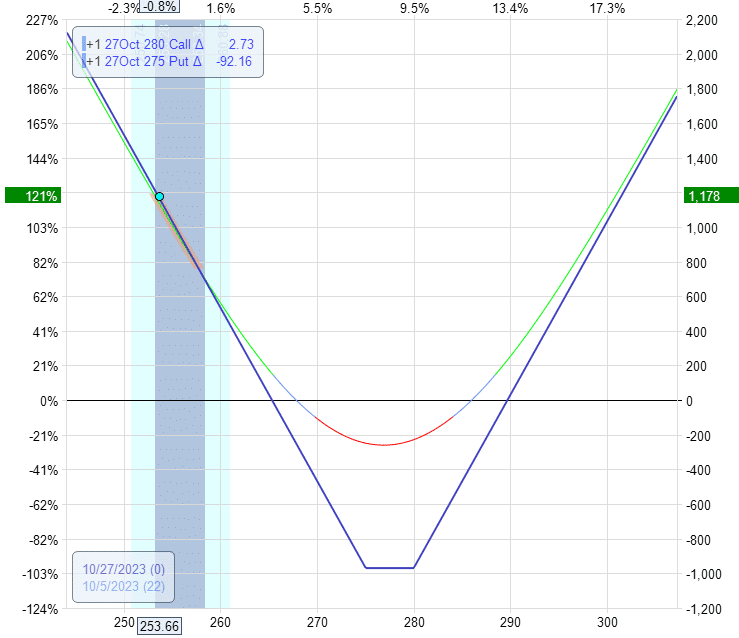
Another opportunity to take profits.
Down Move Continues
In this case, the down move is still not finished.
Since the Squeeze indicator got us into the trade, why not use the same indicator to tell us when to exit? Good idea.
On October 11, we finally saw that squeeze indicator histogram turn up.
That is when the histogram color goes from red to yellow.
And if the trader exits the next day after seeing that, the profits would be $1591, or 164% return on the capital at risk.
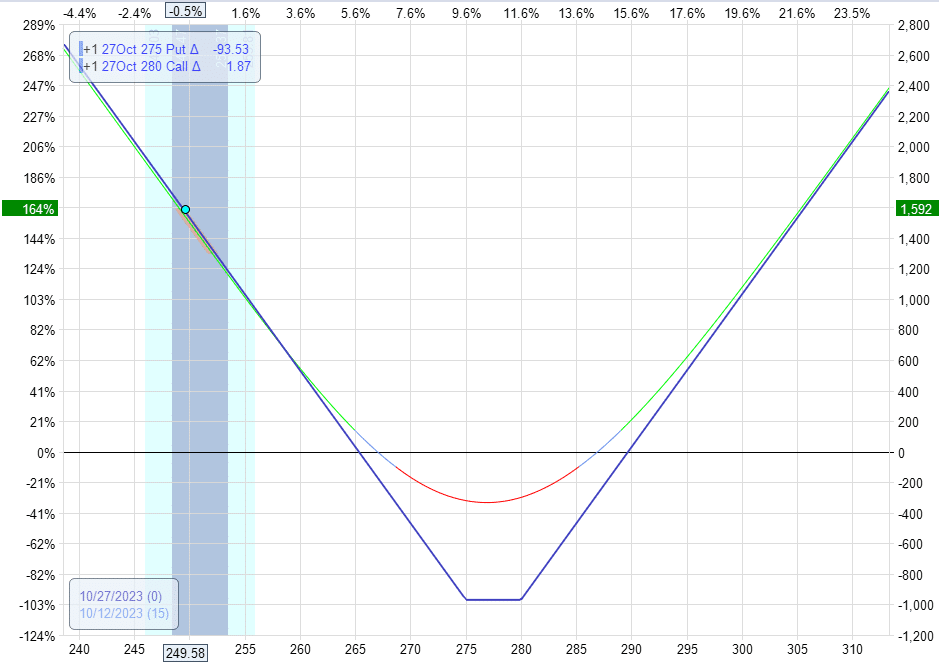
With only 15 days left to expiration, this concludes our example.
Earnings Date Changed
When an earnings date is unconfirmed, the date can change. During this trade, McDonald’s changed its earnings date from October 26 to the confirmed date of October 30.
That means that the value of the option contracts with an expiration of October 27 would no longer be held up by the earnings date of October 30.
In any case, this trade worked out primarily because of the squeeze and the large price move by McDonald’s.
Hooking our options with the earnings date only has a minor secondary effect.
Frequently Asked Questions
Where can we see the confirmed earnings date?
There are many sources. One is EarningWhipsers.
It has a checkmark next to the earnings date, meaning it is confirmed.
If you hover over the checkmark, it tells you when it was confirmed.
It was confirmed after we had placed the trade.
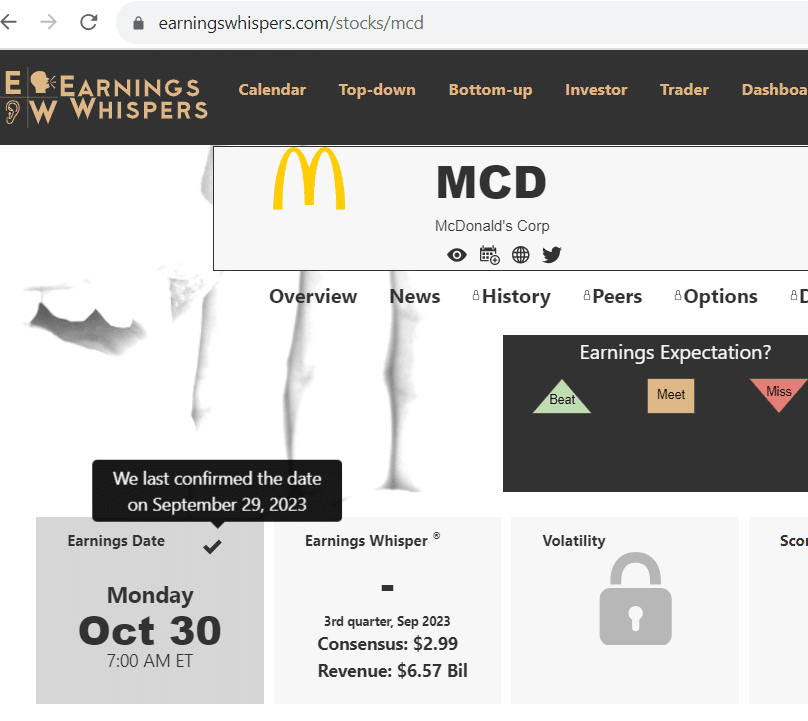
Source: earningswhipsers.com
Could the trade be exited when the RSI comes out of oversold condition instead of when it goes into oversold condition?
Certainly, and some traders would wait for that.
There are pros and cons.
Sometimes, a stock can stay in oversold condition for a very long time; sometimes, a stock will touch oversold and come out immediately.
Difficult to know in advance.
It is up to the individual trader to decide when to exit the position.
What is the difference between a straddle and a strangle?
A straddle is when the strike price of the put option and the call option are the same.
A strangle is when they are at different strikes.
This trade could have been done as a straddle.
However, we went with strangle since MCD was trading at $278 right between two major strikes of $275 and $280.
Is the squeeze indicator free?
Although the “Squeeze Pro” is a paid indicator by SimplerTrading, the older version, “TTM Squeeze,” is free on many platforms, such as ThinkOrSwim and barchart.com.
However, they may not give the same signals due to implementation and configuration differences.
In TradingView, there are freely available community scripts. One is called “Squeeze PRO Indicator” by Makit, which is used in this example.
It is based on SimplerTrading’s Squeeze Pro. But it is NOT the official SimplerTrading Squeeze Pro, which is shown below as “ST Squeeze Pro” with a lock icon next to it.
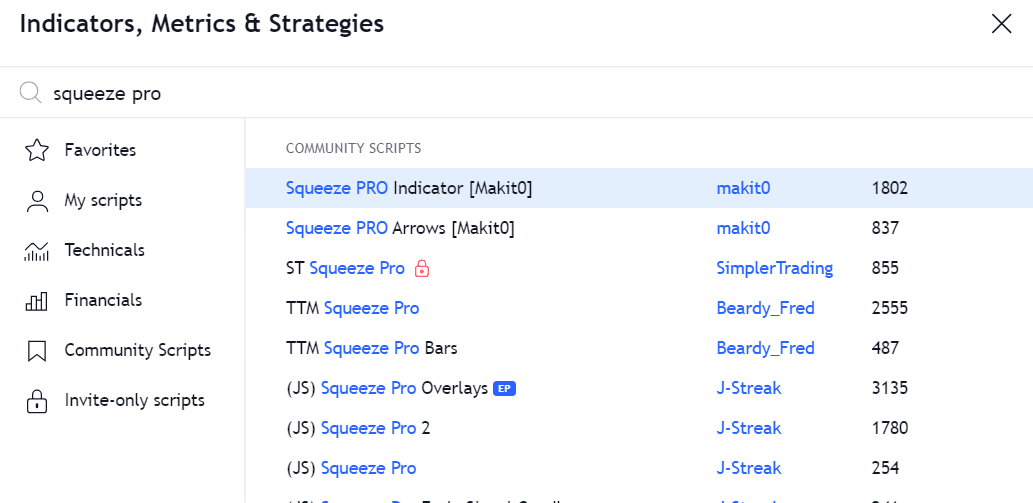
It has a locked icon because it will be available for you to use on TradingView if you purchase the indicator from SimplerTrading.
What do the orange and yellow dots in the indicator mean?
The red dot is the normal compression, and the orange dot is a lesser compression.
The yellow dot is a higher compression or squeeze.
Conclusion
Mcdonald’s, with a beta of 0.65, is considered a slow-moving stock.
However, when squeezed, it can still move.
A squeeze suggests a greater than expected move where the expected move is a statistical calculation based on option prices.
The magnitude of the move and the possible returns on the trade are also difficult to know in advance.
And the squeeze will not always work out as nicely in this example.
The long strangle structure has unlimited upside potential.
Hence, the returns can be anywhere from 10% to more than 100% return on capital.
Of course, it can be a loss, too.
If the move does not materialize or the stock moves too little, the time decay will eat up all the profits until the strangle value goes to zero at expiration, and the trader loses 100% of the capital invested.
This is why traders would rarely hold this trade to expiration.
A squeeze does not suggest a direction.
Therefore, the trader must look at other factors like price action or other indicators.
If a direction is clear, the trader can make a directional trade by either buying a call or a put or using directional spreads.
If the direction is unclear, the trader can wait until the direction is clear.
Or buy in both directions, as in our example.
The time decay of the long option may be reduced if one buys options associated with earnings.
Finally, the long strangle or long straddle can act as a black swan hedge.
Had the market crashed while in the long strangle/straddle, we would not have been worried because the huge down move would have made the long strangle/straddle profitable.
We hope you enjoyed this article on the long strangle squeeze.
If you have any questions, please send an email or leave a comment below.
Trade safe!
Disclaimer: The information above is for educational purposes only and should not be treated as investment advice. The strategy presented would not be suitable for investors who are not familiar with exchange traded options. Any readers interested in this strategy should do their own research and seek advice from a licensed financial adviser.


