


The market structure gives us an indication of a trend.
A break in market structure gives us an indication of a possible trend change.
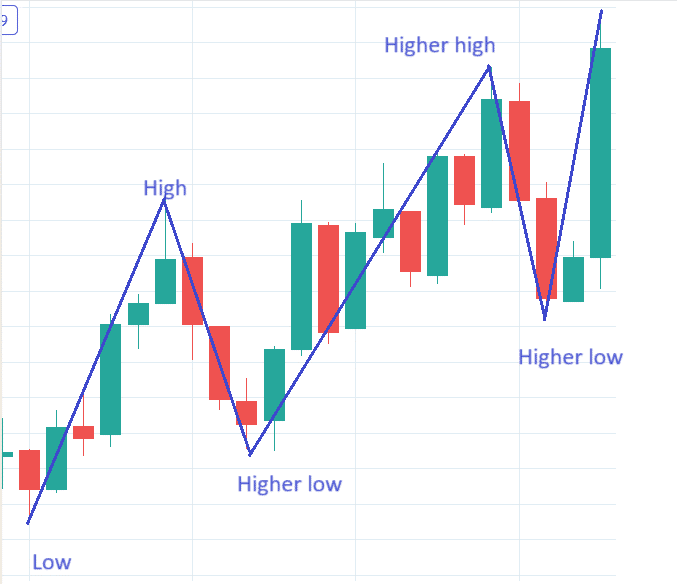
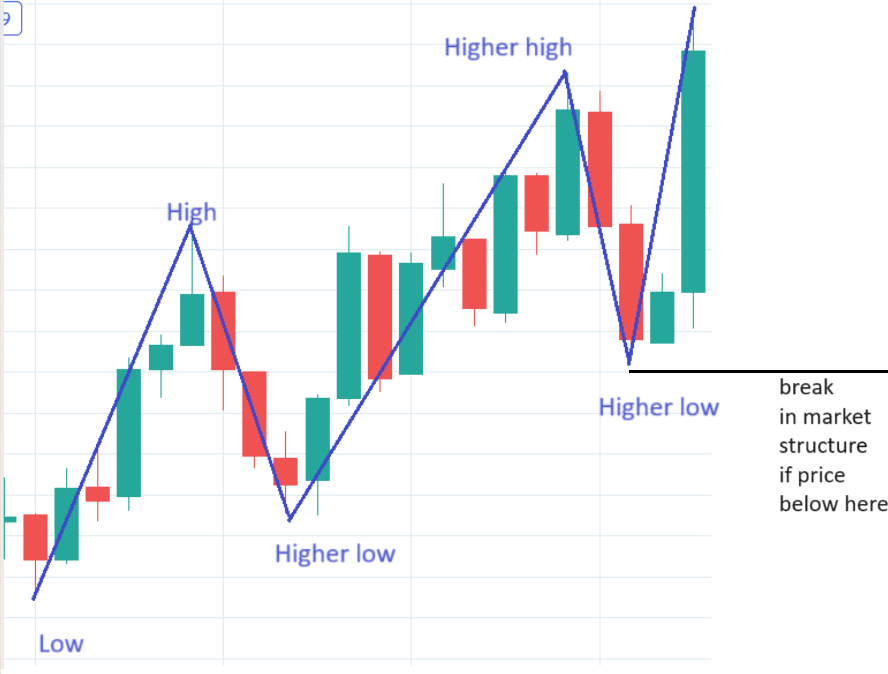
Here is a typical market structure of an uptrend with higher highs and higher lows.
The assets or the time frame do not matter.
The concept applied is the same.
This market structure is intact, and the uptrend is still in place.
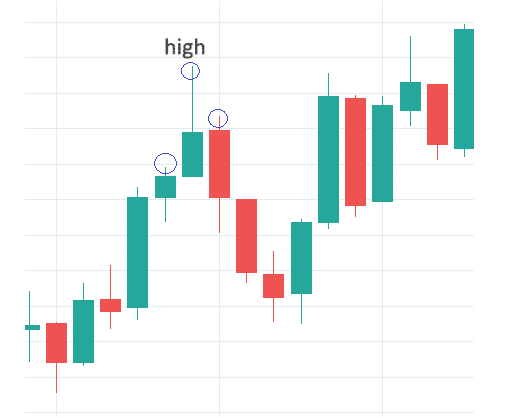
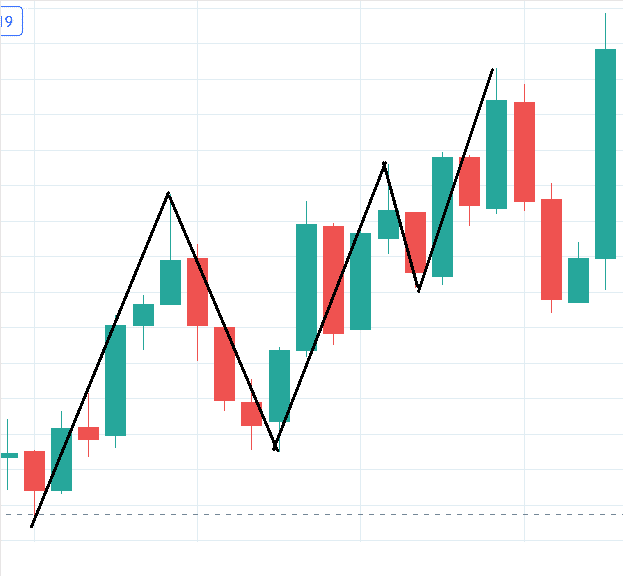
To be labeled as a high, the candle must have a high that is higher than the highs of the two candles next to it.
For example:
Similarly, we label a low if the candle’s low is lower (or equal to) the lows of the two candles next to it.
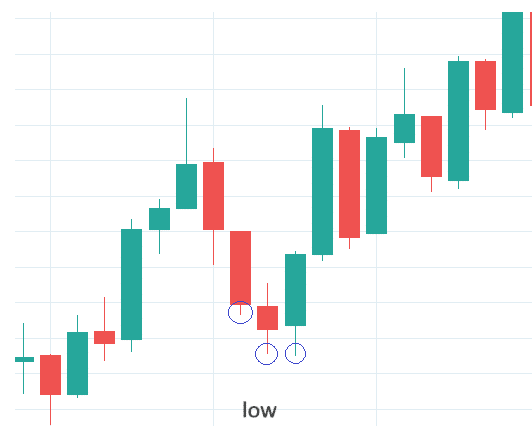
In this case, we have equal lows.
That’s okay.
We can pick either candle as the low.
We don’t need to take out our measuring tool or be too precise about it.
This highlights the fact that the drawing of the lines and the choice of which candle one chooses to be a high or a low is not an exact science.
Two people can draw two different yet valid market structure lines.
For example, here is an alternative way to draw the market structure.
Depending on how one draws it, the precise timing at which we see a market structure break may be slightly different.
Going with our first drawing, we would say there is a break in market structure if the price goes below the last swing low, as indicated by the horizontal line drawn.
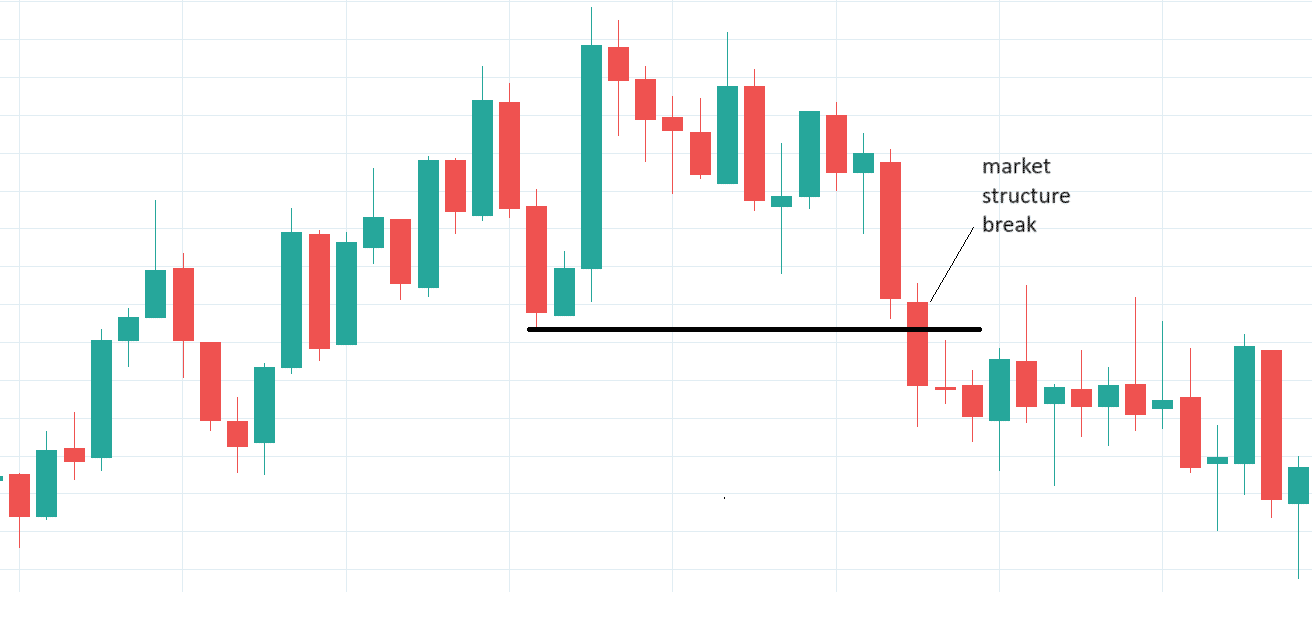
A few candles later, we see the market structure break and a reversal in price trend:
Downtrend Exercise
It may seem simple when these highs and lows are pointed out in hindsight, but it may not be as clear-cut when looking at the market in real-time.
As an exercise, see if you can determine if there is a market structure break in this downtrend:
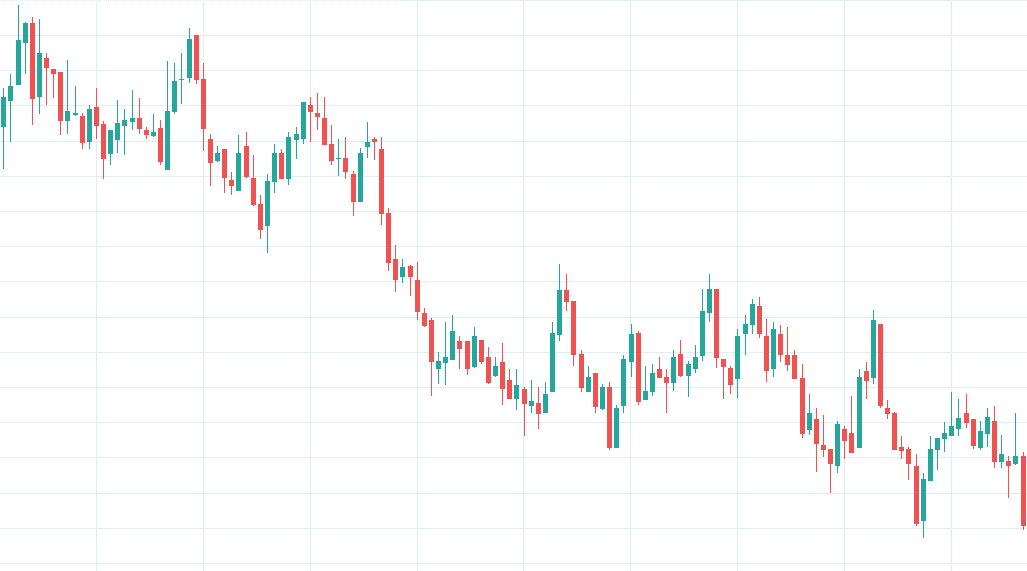
Pause the reading of this article and start labeling this chart.
Answer: The downtrend is intact. There was no market structure break. Here are the lower highs and lower lows marked out:
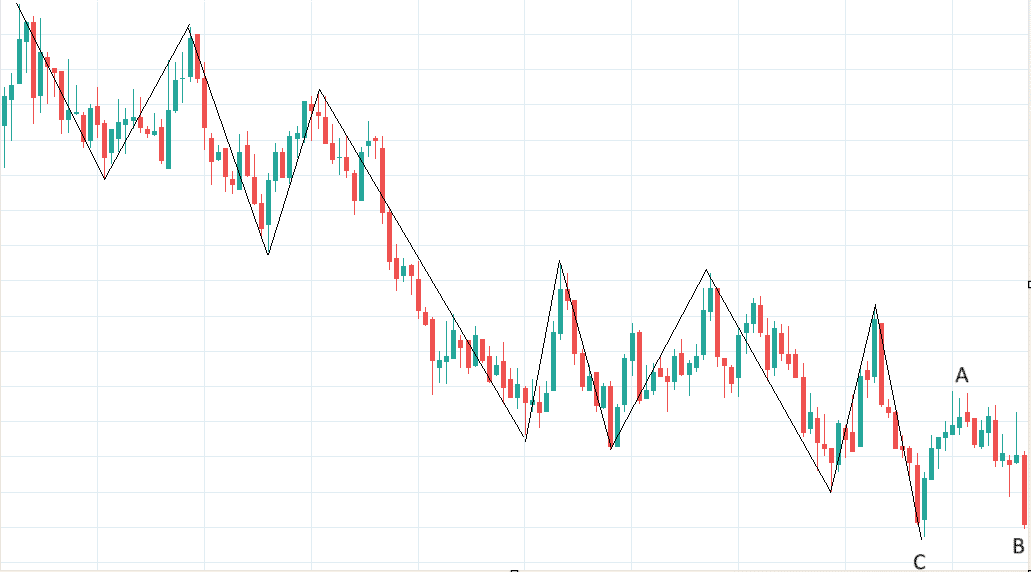
Price never broke above a swing high.
So, the downtrend is intact.
I had not yet drawn a line from C to A.
Based on the information I have so far, I can not say that point A is a swing high yet.
Because the close of the candle at point B had not gone below point C yet.
Point A can only be considered a swing high once point B has fallen below point C.
The next candle at D did close below point C:
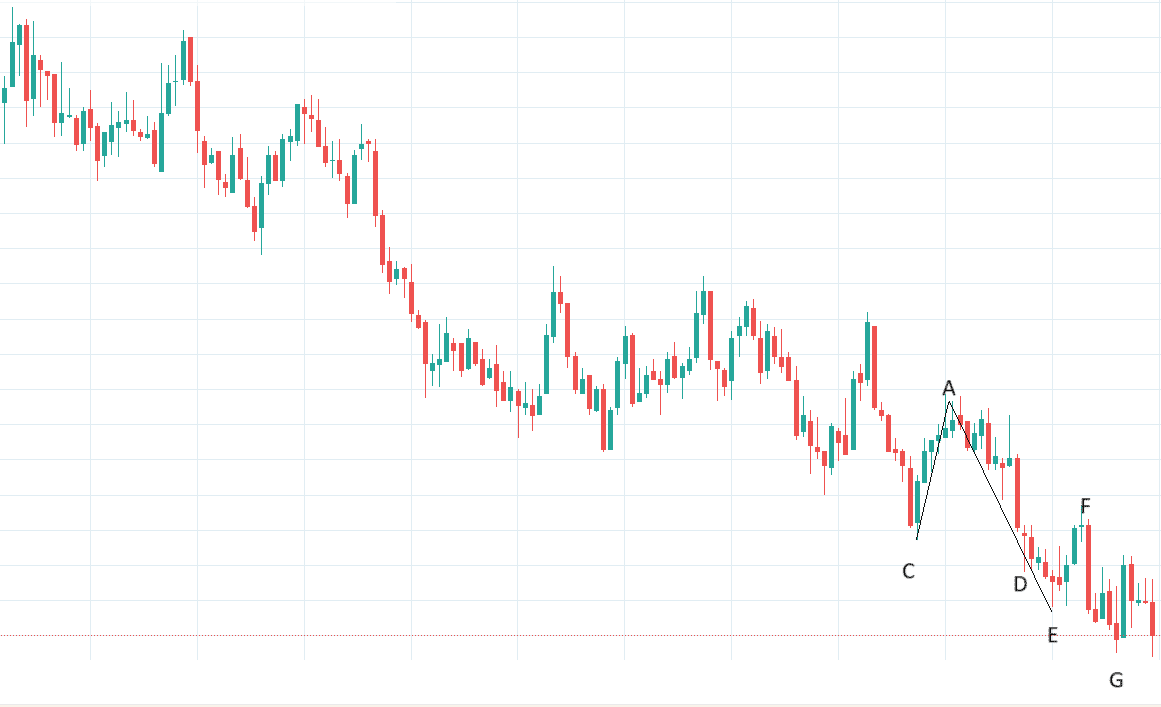
Therefore, we can now say point A is a swing high and then draw a line from point C to point A.
Before point E had appeared, I had a line from point D to point A.
However, once point E had appeared, that line was revised to go from point E to point A.
Point E can be labeled as a swing low if point F had appeared and you feel that F is a significant swing.
Whether you feel that F is a significant swing is up to interpretation.
If you feel that it is, you would have drawn your lines like this:
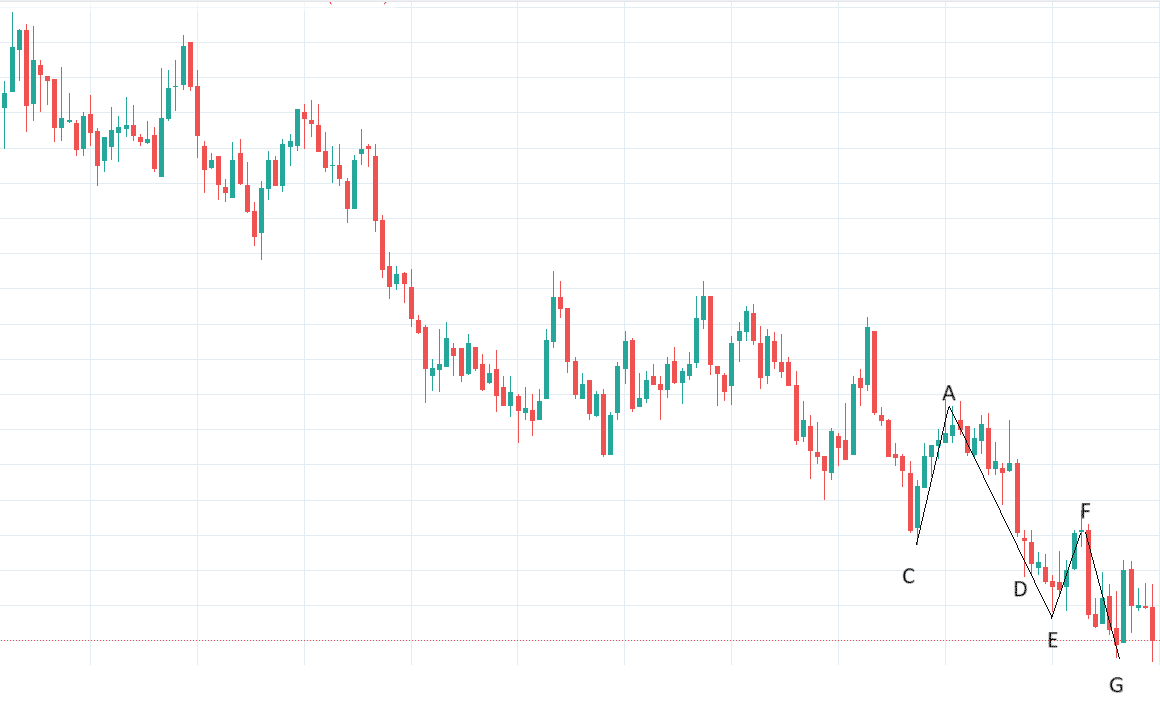 If you felt that F was not a significant swing, you would have drawn your lines like this and ignored point F as a swing high:
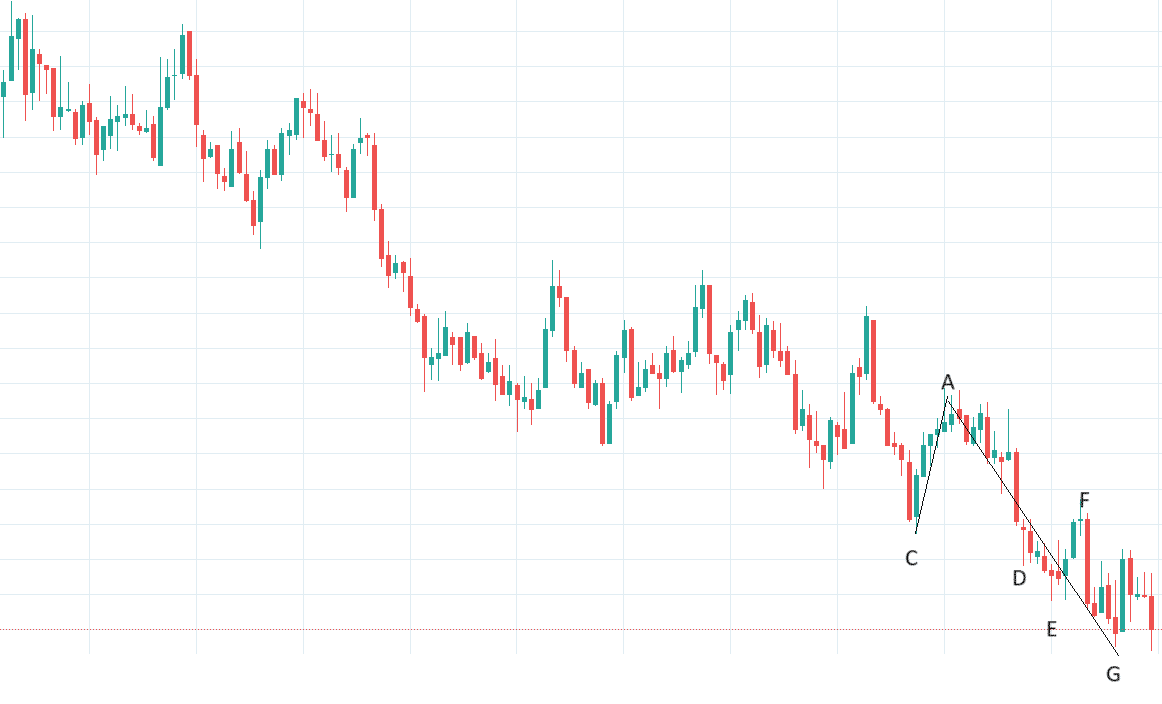 In either case, the price had never broken up above any swing highs.
Therefore, there was no market structure break here.
One can argue that there was a market structure break when point J went above the swing high of point H:
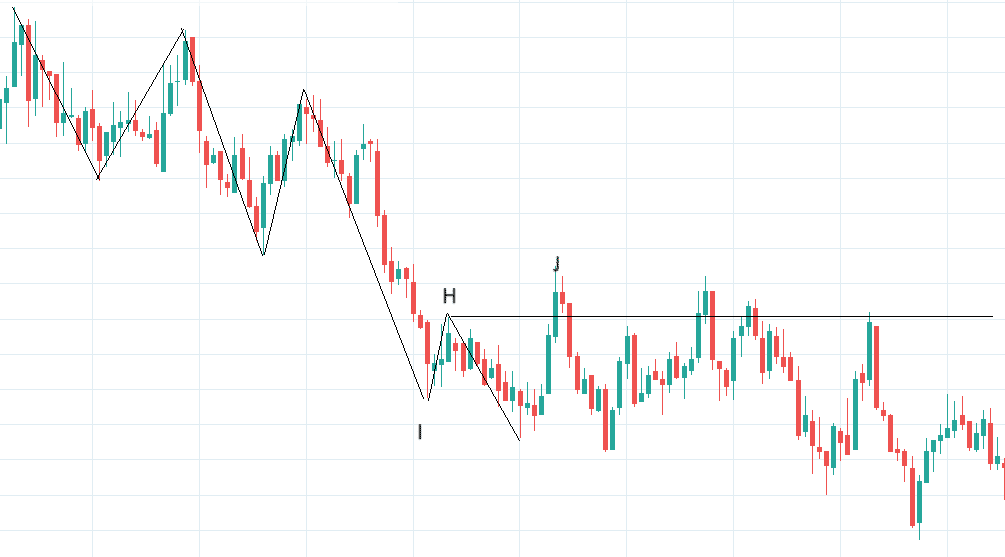
That would be a valid argument if you considered that the swing from point I to H was significant.
It was such a small upswing in the overall context that I felt it was not significant enough to call point H a swing high.
Hence, I bypassed point H as a swing high.
Again, this is not an exact science.
Some may have said the market structure broke because the price went above the swing high, point L, as shown below.
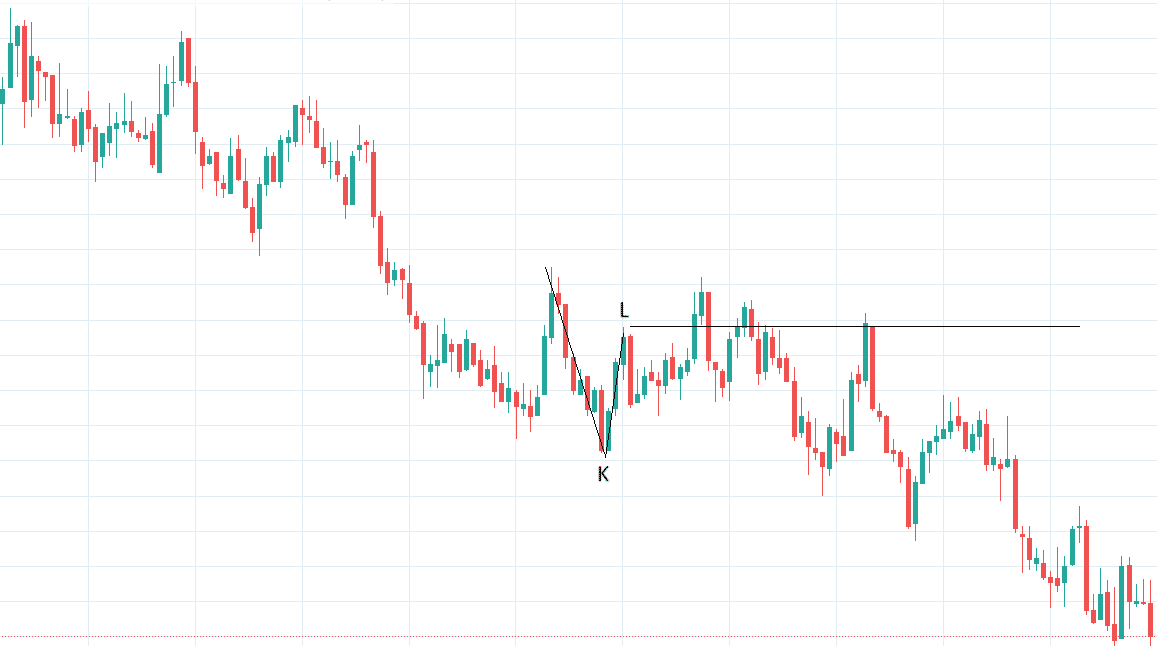
Indeed, we could not ignore point L because the swing from K to L is significant.
However, recall that we could not have labeled point L as a swing high until point M had appeared below the previous swing low of point K.
See below.
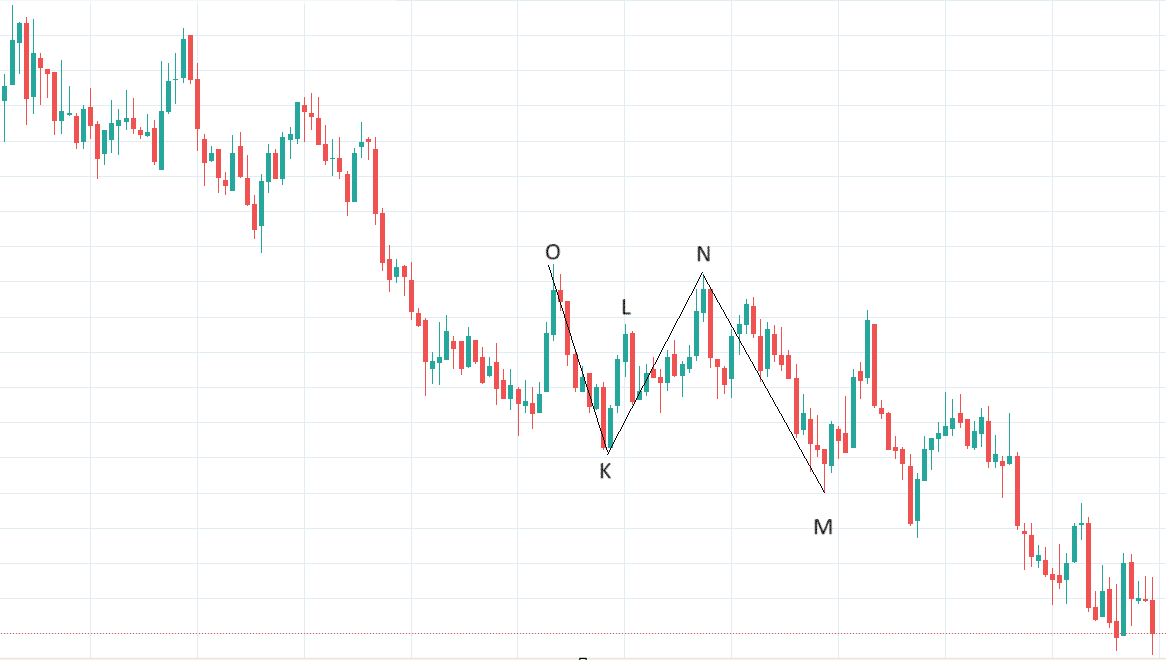
By the time point M appeared, the proper swing high was determined to be point N.
Why N and not L? Because N is the highest point between point K and M.
It is the swing high, not point L.
Point L is just part of a “complex retracement” from the swing K to N.
Upon close examination of the chart, point N is lower than point O.
Hence, we continued to have a lower low.
Price never broke above point O, nor did it ever break about point N.
Had point N been higher than point O, then yes, there would have been a market structure break.
Conclusion
What might have seemed like a simple exercise of connecting the dots, there are numerous minor nuance details to consider.
It will become easier with practice.
You can simulate the real market by uncovering the charts one bar at a time to gain experience with the charts.
We hope you enjoyed this article on how to detect a break in market structure.
If you have any questions, please send an email or leave a comment below.
If you’re not following me on Twitter, you can find my profile here.
Trade safe!
Disclaimer: The information above is for educational purposes only and should not be treated as investment advice. The strategy presented would not be suitable for investors who are not familiar with exchange traded options. Any readers interested in this strategy should do their own research and seek advice from a licensed financial adviser.


Hi Gavin! Nice Article,
We need to remove subjectivity to automatically identify HH/HL/LH/LL to determine structure. William Fractals uses 5 candles to identify them. But that can give too many swings in a volatile market. Using more candles will help in volatile market, but the downside is one will have to wait a bit longer when the market reverses.