
A trader is only as good as the information that they consume.
Your charting platform should be at the top of this list.
There are dozens of different platforms out there, some even included with your brokerage account, but one of the best is TradingView.
In addition to its large range of offerings, it’s also web-based, meaning you can easily view it from any computer or smart device that allows it.
Below, we will look at the tools they offer and the other benefits of using them as your charting platform.
Contents
Account Types and Data
Before we go into any of the different charting styles, we must discuss the different account types and data that TradingView offers its users.
Account Types
First, a free account is available, which is often perfect for new traders or traders who utilize higher timeframes and don’t mind delayed data.
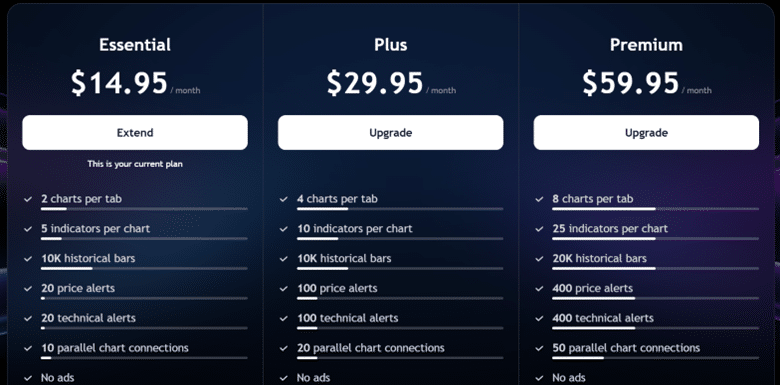
Their free tier, called Basic, offers one chart, standard time frames, and basic indicators.
This also allows you to use delayed or End-of-day data, depending on the instrument they are looking at.
The next tier up is Essentials.
This tier gives access to more chart types, different time frames, candle stick types, additional indicators, and volume indicators like the Volume at Price (Volume Profile).
The next step up from there is Plus, which contains all of the same tools but also adds the ability to save additional chart templates, utilize more indicators per chart, and export bar and strategy data.
Premium is the highest tier for retail traders.
This offers unlimited chart templates, additional indicator space on charts, the ability to place indicators on indicators, the Time Price Opportunity chart type, and second/custom chart intervals.
For a brief description of all the different levels, see the image below from the TradingView website.
Data
Now that you have the basics of the account types, the second most important thing to look at is data.
The free account comes with standard timeframes and delayed data for each tier; after that, it is recommended that you pay for streaming data to get real-time alerts and updates (the higher levels require it).
Each tier allows more simultaneous data streams, starting at 2 for Essentials and ending at 6 for Premium.
As long as you are not a professional trader, the rates are very reasonable, starting at around $15 monthly for equities data.
A final word on the account types: TradingView often runs sales several times a year, and you can get a great discount if you pay an entire year upfront.
Charts, Instruments, And Indicators
Now that the housekeeping is out of the way, we can start looking at all the features TradingView offers.
First, we will start with the charts and everything surrounding them.
As we mentioned above, some tools will require subscriptions, but they are all available on the platform.
In addition to the usual candlesticks everyone has grown accustomed to, TradingView offers many other common and uncommon chart types.
Things like Line, Mountain, and Baseline (think of what you would see on a financial news show) are pretty standard
. Then, as you climb through subscription levels, you get access to more exotic chart types like Kagi, Point and Figure, Range, Volume Bars, and even Time Price Opportunity (TPO) if that’s what you want to look at.
You can display these charts across any instrument if the data supports it.
This leads us to the next benefit of TradingView, which is their instrument list.
If you can trade it, you can probably view it here.
They offer the US and all other major stock markets and their components from around the world.
They also have Forex, Futures, Cryptocurrencies, News releases like non-farm payrolls and CPI data, and data from non-market sources.
All of this can be plotted and manipulated using TradingView charts.
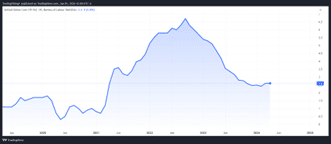
An example is the US CPI data plotted to the right on a line chart.
This leads us to the last thing you would put on a chart: the indicators.
This is one area where TradingView excels. In addition to all of the standard indicators like Moving Averages, Bollinger Bands, ADX, RSI, and MACD, you have access to a vast library of user-created studies that are shared for little or no cost.
These can all be added to your chart the same way you would add any other indicator. Additionally, you can use their development language, PineScript, to write up your custom indicators if that’s something you want to get involved with.
The platform puts the end user first with almost all aspects of their charting tools.
Other Trading Tools
Even though they are best known for their charting platform,
TradingView also offers other tools that every trader should utilize, and most of them are free as long as you have an account.
Their screeners let you scan through Stocks, ETFs, Cryptocurrencies, and Forex to help narrow down what you want to trade.
The screener is quite robust; it lets you scan for fundamental and technical setups to trade, depending on the instruments you are looking through.
They also recently added “Dex Pairs” for the Crypto enthusiasts who want to use them to trade.
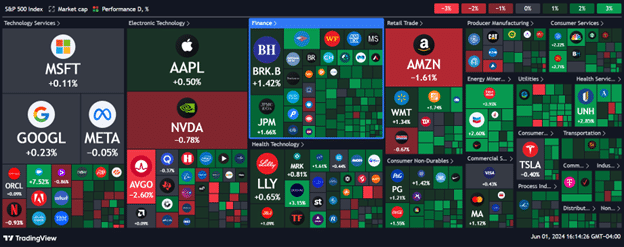
Traders also have access to the TradingView heatmap, which is similar to most other stock heatmaps.
The main difference is that if you have live data, it is also applied to this.
Additionally, you can look at individual sectors or foreign markets if you use that information in your trading.
Below is an example of the S&P index with the basic settings all set to default.
You could also add extended hours.
TradingView also offers a pretty basic economic calendar, which is nothing notable other than that you can select the release and go directly to a graph from the calendar page.
They have also started offering options data, which is currently limited to overseas markets like the Indian Exchange.
Broker Integration and Trading
As TradingView has continued to grow, they have added broker integration that lets you trade directly from the chart.
Depending on the broker, you may also be eligible to connect your data from your brokerage account, saving you the cost of a monthly data subscription.
The broker list is extensive at this point, with some large names like TradeStation, Cobra, Interactive Brokers, and WeBull all on the list if you are looking for stocks and ETFs.
If you are looking for Futures or Forex, the list grows dramatically, with some even offering bonuses if you sign up for TradingView through them.
One thing to note about the broker integration is that some brokerages cover the cost of the data and the TradingView subscription, and some do not, so be sure to read all of the terms around it if you plan to sign up through your broker.
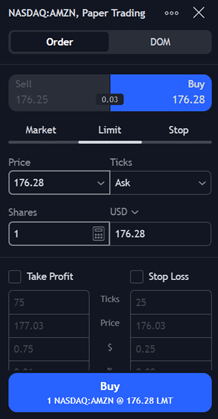
If you plan to trade through Tradingivew, you will not be disappointed.
You can trade directly from the chart you are looking at through either the Trade Window, seen here on the left, or through the DOM directly.
You can also enable chart trading so that you can move your stop losses and take profits directly on the chart.
These features are pretty standard with most brokerages, but it’s great to do them on a web-based platform.
If you aren’t a manual trader, TradingView has not forgotten you either.
You can create your custom strategies through their Pinescript language to show where trades should be opened and closed directly on the screen.
The caveat here is that Tradingivew will not place the trade with your brokerage account; it will only show them on the screen.
You must still manually buy/sell through the trading window or your brokerage account.
If you are not yet an automated trader and want to get into it, you can backtest your strategies using TradingView and read more about that here.
All users also get a free paper trading account when they sign up.
Community
The last really interesting thing about TradingView is its strong community of traders.
This community has a section on its website where they can exchange ideas, trades, comments, and indicators/strategies through Pinescript, as discussed above.
The community is very supportive, for the most part, and has great articles and posts on possible trades and what other traders are looking at.
It also includes an educational section where newer traders can look at how experienced ones execute and manage their trades.
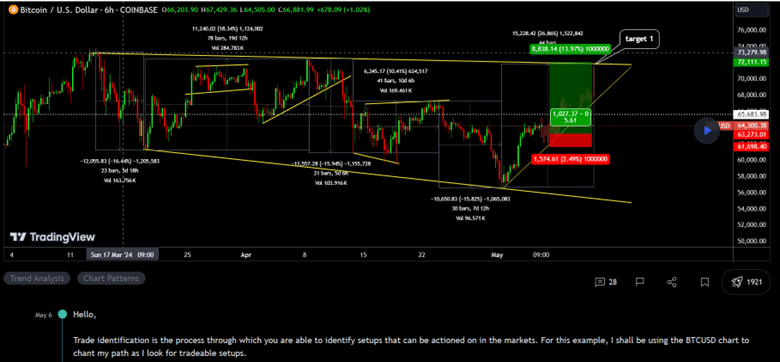
Here is an example of trade identification using real Bitcoin data as a sample.
Below the chart is an explanation of the trade, what to look for, and how to manage it.
Not all of that could be captured in the image, but it’s all available for free for both paying and free members.
Drawbacks
As with all things, TradingView has drawbacks as well.
First and foremost is their lack of US options data. If you are looking for a site to be able to plot options data, they are still working on integrating the US exchanges and adding options functionality.
The second drawback would be the learning curve.
Tradingivew is simple to learn, with most things being intuitively placed on the chart, but there is still a learning curve on how everything functions if you come from your broker’s trading platform.
The last real big drawback is the cost associated with it.
If you are currently trading through any big brokers for equities and options, you can probably use their native platform and data at no additional cost.
Futures traders still have to pay for data, so the only additional expense here would be the platform.
While it is a fantastic charting and trading tool, not all traders will want to incur another cost, especially with things like Think or Swim and TradeStation being free as long as you have a funded account.
The Verdict
TradingView is an extremely robust web-based charting platform that can be very useful to new and experienced traders.
If you are looking for on-the-go trading, access to live data from different sources, and custom candle types, then one of the paid plans is perfect for you.
The free plan is perfect if you are a newer trader and are just looking to start understanding charts, trades, and indicators.
For no cost, you can get delayed data and access to the vast library of user scripts, trade ideas, and educational content based on real trades and data.
Additional monthly costs are a potential drawback, but it may be worth it for all of the benefits.
TradingView is a great platform for traders of all skill levels and requirements.
We hope you enjoyed this TradingView review.
If you have any questions, please send an email or leave a comment below.
Trade safe!
Disclaimer: The information above is for educational purposes only and should not be treated as investment advice. The strategy presented would not be suitable for investors who are not familiar with exchange traded options. Any readers interested in this strategy should do their own research and seek advice from a licensed financial adviser.


HI Gavin, Very useful article, thanks. I believe IB’s “Advanced charts” is actually TradingView, but I’m not sure which of the 4 packages is iavailable as part of the IB standard package. I’ve tried to create multiple charts and templates but haven’t found a way to achieve this from IB. Any clues?
Also on the topic of IB, do you know a way to release an order with “execution paused” by default? Currently I tend to put a stupid price on an order and then pause it while I look at actual bid/ask spreads and adjust the price accordingly, but occasionaly orders get filled before I get a chance to pause them. Any advice? Thanks
Sorry, I don’t use IB for charting. I’m also not aware of any way to pause execution. I do the same as you by inputting a dummy price.