


The trading landscape is full of a myriad of tools and indicators that traders try to leverage to decipher market dynamics and make informed decisions. The On Balance Volume Indicator (OBV) is among the most widely adopted tools.
This comprehensive review will attempt to equip you with a better understanding of the OBV, its inception, its effective application in your trading strategies, and the benefits it potentially bestows.
Let’s delve deeper!
Contents
On Balance Volume Indicator (OBV) – An Overview
The OBV is a momentum-oriented technical analysis tool that can assist traders in evaluating the volume flow of a financial instrument.
This tool was introduced in 1963 by Joe Granville, a renowned financial writer, and market analyst.
The main function of the OBV is to determine whether a security’s price movements are propelled by robust buying or selling pressure.
This information can then help an investor make a more informed decision about an instrument and its potential trends.
How The OBV Works
The OBV takes the cumulative total volume, and then it is adjusted for the direction of the security price.
This is calculated by adding or subtracting the period from the preceding period’s OBV, depending on whether the price closes higher or lower than the previous period.
If the closing price is higher, the day’s volume is added to the previous OBV; if the closing price is lower, the day’s volume is subtracted.
If the closing price remains static, the OBV remains unchanged.
This cumulative approach to volume analysis enables traders to evaluate the volume flow in relation to price movements, which can offer potentially helpful insights into the strength of a trend and reversals.
Advantages Of Using The OBV Indicator
The OBV continues to be a valuable and effective technical analysis tool for some traders.
By providing insights into volume and the strength of market trends, the OBV can enhance traders’ decision-making processes and improve overall trading performance.
Here are some reasons why the OBV remains relevant today:
Volume confirmation of price trends:
One of the main advantages of the OBV is that it can trend in relation to price.
When the OBV rises, it indicates strong buying pressure, which can confirm an uptrend.
Conversely, when the OBV is falling, it signifies strong selling pressure, which can confirm a downtrend.
Detection of potential reversals:
The OBV can also help traders identify potential reversals in the market.
When the OBV diverges from the price trend, it can signal that the current trend may weaken, and a reversal is possible.
This can allow traders to capitalize on shifts in market sentiment before the price reflects it.
Support and resistance levels:
The OBV can also be a useful tool for identifying support and resistance levels in the market.
When the OBV reaches a previous high or low, it can indicate that the market may encounter resistance or support at that level.
This information can be helpful for traders who are looking to enter or exit positions based on price levels.
Enhancing other trading strategies:
The OBV is an extremely versatile indicator that can be used in conjunction with several other trading strategies and technical analysis tools.
By providing insights into market dynamics and volume trends, the OBV can help traders make more informed decisions.
Disadvantages Of Using The OBV Indicator
As with everything, there are always trade-offs.
The OBV is no different.
Here are some of the disadvantages of the OBV:
Insensitivity to magnitude: The OBV focuses on the direction of price changes, not the magnitude of those changes. As a result, the indicator may not fully represent the market’s true buying or selling pressure. Two days with similar volume but significantly different price changes will still have the same impact on the OBV, which can lead to misleading signals.
False signals and whipsaws: Like any technical analysis tool, the OBV is subject to false signals and whipsaws, especially in highly volatile or choppy markets. These false signals can lead to poor trade locations, so it is suggested to be used in conjunction with a more comprehensive trading system.
Lagging nature: The OBV is a cumulative indicator, which is inherently lagging, as with most technical indicators. While it can provide valuable insights into market dynamics and volume trends, its lagging nature may result in delayed signals, causing traders to miss optimal entry or exit points.
Not a standalone tool: The OBV should not be used as a standalone tool for making trading decisions. Combining the OBV with other analysis tools and techniques is crucial to increase the OBV’s effectiveness and decrease the likelihood of false signals, such as candlestick patterns, moving averages, order flow, and trend lines.
Limited applicability in illiquid markets: The OBV relies on analyzing volume data to provide insights into market dynamics. In markets with low liquidity, the volume data may be unreliable or insufficient, making the OBV less effective in providing accurate signals.
How To Use The OBV In Your Trading Strategy
So now that we know about the OBV, let’s look at some applications for trading:
-
Trend Confirmation
One of the primary uses of the OBV is to confirm the direction of a trend.
When the OBV moves in the same direction as the price, it confirms the trend’s strength.
For example, if the price of a security is in an uptrend and the OBV is also rising, this can confirm buying on the underlying.
Conversely, if the price is in a downtrend and the OBV is falling, this can confirm a bearish trend.
-
Divergence Analysis
One can use the OBV to identify potential reversals in the market by analyzing divergences between the price and the indicator.
A divergence occurs when the price and OBV move in opposite directions, signaling a potential shift in market sentiment.
There are two types of divergences:
a. Bullish divergence: The bullish divergence is when the OBV makes higher lows while the price makes lower lows. This can indicate that selling pressure is reducing, and a potential reversal to the upside may be imminent.
b. Bearish divergence: A bearish divergence is when the OBV makes lower highs while the price makes higher highs. This suggests that buying pressure is reducing, and a potential reversal to the downside may be on the way.
3. Support And Resistance Levels
Some traders use the OBV to identify support and resistance levels that may provide potential trade entry or exit points.
By observing historical OBV levels, traders can determine areas where the market has experienced significant buying or selling pressure in the past and which may act as future support or resistance levels.
This is a less common approach as it requires a more nuanced view of the indicator.
-
Combining With Other Technical Analysis Tools
This is the most common use of the OBV.
By incorporating multiple indicators, traders can gain a more comprehensive understanding of the market, allowing them to make more informed decisions and improve their overall trading performance.
Some common indicators that are combined with the OBV are the ADX, MACD, and Trendlines.
Outside of technical indicators, order flow and candlestick patterns are other common tools used in conjunction with the OBV.
Examples Of OBV In Action
Here are some examples of OBV in real-life scenarios
Trend Confirmation
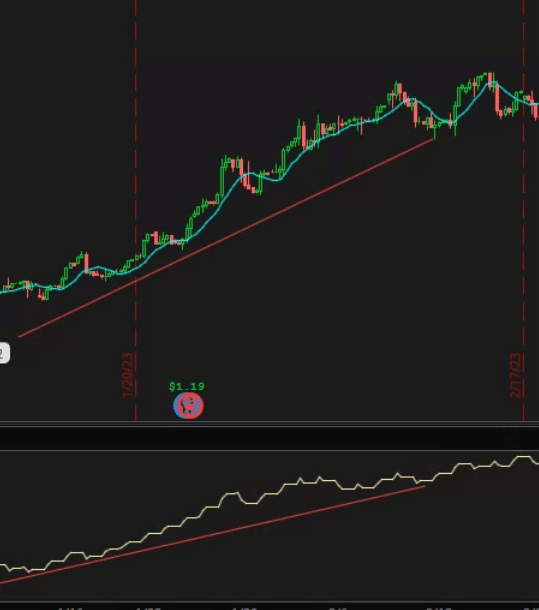
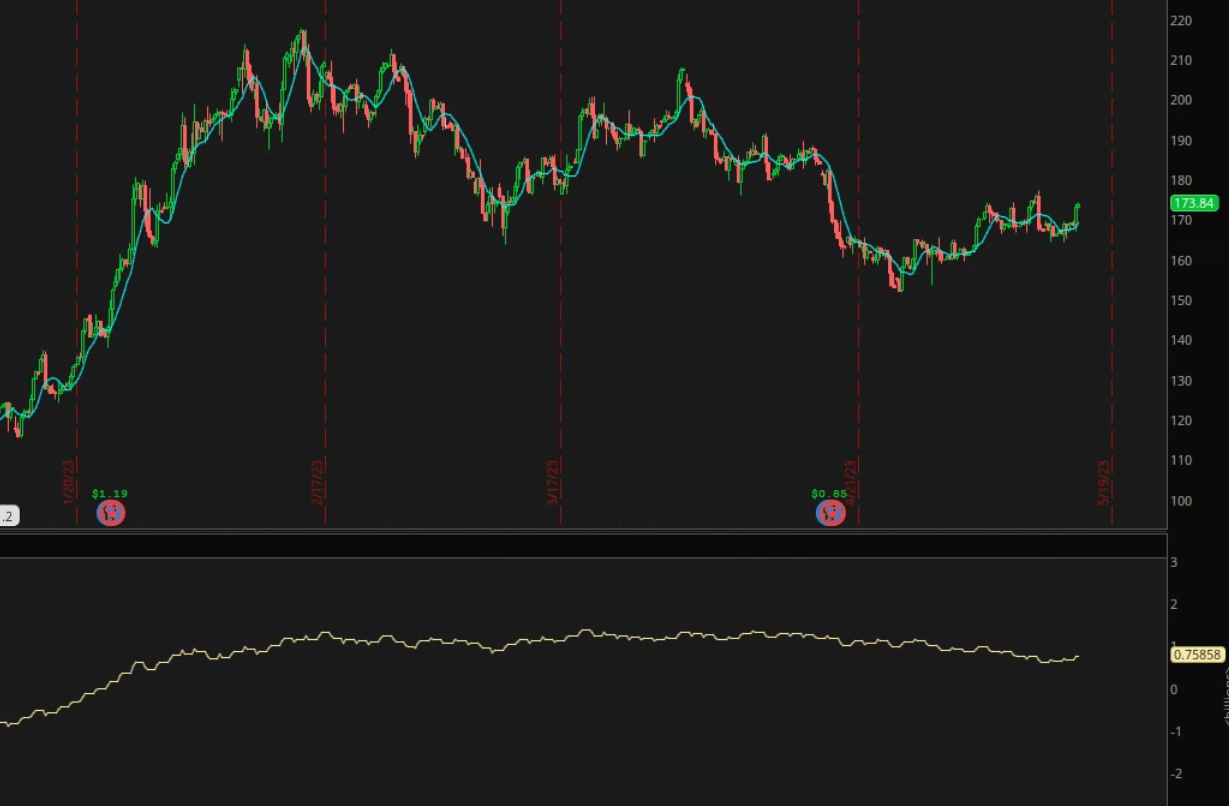
Below is a basic candlestick chart on Tesla with a Moving average and the OBV indicator at the bottom.
This chart will be used for a few examples, but first is the trend confirmation.
Notice how as the price continues to advance, the OBV follows it up, showing sustained buying in the stock.
This is one example of how the OBV can be used.
Divergences
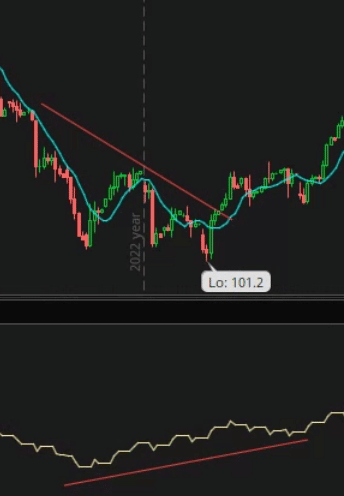
As discussed above, there are two types of divergences, bullish and bearish.
The picture to the right is a great example of a bullish divergence.
AS the OBV starts to increase, the Tesla price continues to fall, but it’s falling slower after each bounce.
Finally, when the price rebounds, the OBV confirms the trend seen in the previous section.
This also shows why using this tool with other indicators or as part of a larger strategy is important.
Just watching the OBV would have keyed you into the potential for a reversal, but there was never a clean entry based on it alone.
Conclusion
The On Balance Volume Indicator can be a powerful tool that provides traders with valuable insights into market insights and volume trends.
By understanding how to effectively use the OBV in your trading strategy, you can potentially confirm price trends, detect potential reversals, identify support and resistance levels, and enhance your overall trading performance.
As with any technical analysis tool, using the OBV in conjunction with other indicators and tools is essential to gain a comprehensive understanding of the market and make more informed trading decisions.
With practice and experience, the OBV can become an indispensable part of your trading toolkit, helping you navigate trading confidently and, hopefully, succeed.
Frequently Asked Questions
How Does The On Balance Volume Indicator (OBV) Differ From Other Volume-Based Indicators?
While other volume-based indicators, such as the Volume Weighted Average Price (VWAP) or the Money Flow Index (MFI), incorporate both price and volume data to measure buying and selling pressure, the OBV focuses solely on the cumulative volume adjusted for the direction of a security’s price that period.
The OBV provides a unique perspective on volume trends by giving equal weight to each period’s volume, making it easier to identify divergences and confirmations of price trends.
Can The On Balance Volume Indicator (OBV) Be Used Across Different Timeframes?
The OBV can be applied across various timeframes, such as intraday, daily, weekly, or even monthly charts depending on your strategy.
It’s essential to remember that the OBV’s reliability may vary depending on the chosen timeframe.
As with most indicators, longer timeframes, such as daily or weekly charts, provide more reliable signals as they incorporate more data points and are less susceptible to short-term market noise.
How Can I Combine The On Balance Volume Indicator (OBV) With Other Technical Analysis Tools For Better Results?
To enhance the effectiveness of the OBV as a tool, many traders combine it with other technical analysis tools, such as moving averages, trend lines, and candlestick patterns.
For example, a trader can use a moving average crossover strategy alongside the OBV to confirm the strength of a trend.
When the moving averages cross in the direction of the trend, and the OBV confirms the trend’s strength, it can provide a more robust signal for entering or exiting trades.
Is The OBV Suitable For All Types Of Traders?
The OBV is an extremely versatile indicator that can benefit various types of traders, including day traders, swing traders, and position traders.
It provides insights into the strength of a trend, potential reversals, and support and resistance levels, making it a valuable tool for traders seeking to capitalize on market trends and shifts in market sentiment.
However, as with any technical analysis tool, traders need to gain a thorough
understanding of the OBV and practice using it within their trading strategies before incorporating it into their live trading.
So yes, it’s a suitable indicator for almost any type of trader with the proper practice and observation.
We hope you enjoyed this article about the on balance volume indicator.
If you have any questions, please send an email or leave a comment below.
Trade safe!
Disclaimer: The information above is for educational purposes only and should not be treated as investment advice. The strategy presented would not be suitable for investors who are not familiar with exchange traded options. Any readers interested in this strategy should do their own research and seek advice from a licensed financial adviser.


