


Contents
In today’s trade example, we will do a broken wing iron butterfly on the RUT (Russell 2000 index).
This is an at-the-money non-directional butterfly suitable for range-bound income-style trading.
An iron butterfly consists of a bull put spread and a bear call spread.
What Is A Bull Put Spread
A bull put spread involves purchasing and selling put options on the same underlying asset with the same expiration date but different strike prices.
It is a bullish strategy typically used when the trader expects the underlying asset’s price to increase or remain above a certain level.
As an example:
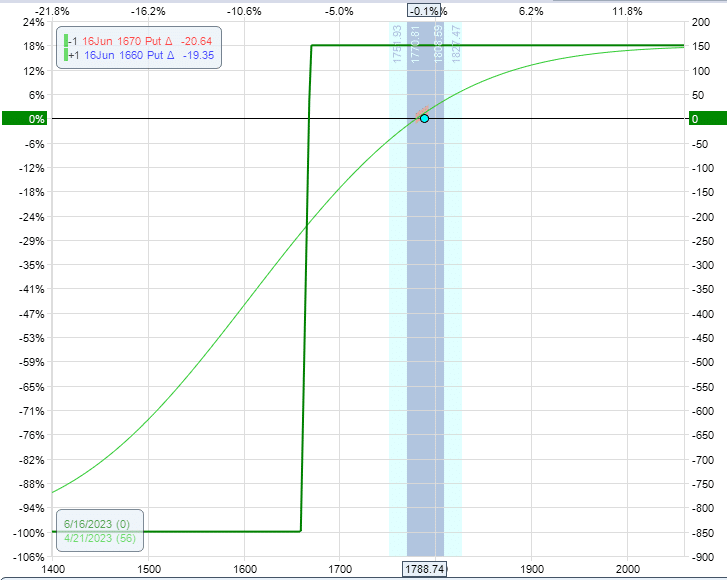
RUT is trading at 1785 on April 21, 2023.
A bull put spread on the RUT might be to sell the 1670 put option and buy the 1660 put option of the same expiration, say June 16.
The payoff graph looks like this:
What Is A Bear Call Spread
Both a bull put spread and a bear call spread are credit spreads because we collect a credit for initiating the trade.
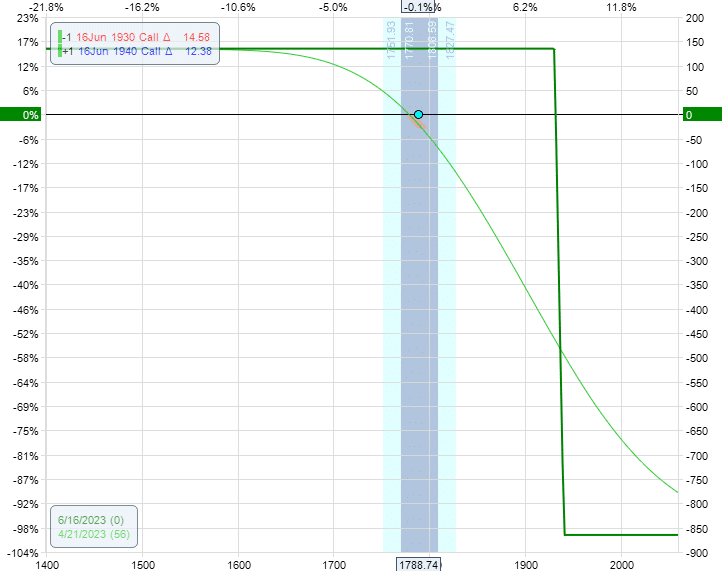
A bear call spread is where you sell the 1930 call option and buy the 1940 call, a higher-in-strike option.
You get a bearish payoff graph that looks like this:
Iron Butterfly
When you marry the two spreads together by moving them closer so that the short strike of the bull put spread and the short strike of the bear call spread is the same strike, then you have an iron butterfly.
The word “iron” refers to the fact that the strategy has both calls and put options.
For the bull put spread, we will sell the 1790 and buy the 1730.
That’s a 60-point spread.
We will sell the same short strikes at 1790 for the bear call spread and buy the 1840.
That’s a 50-point spread.
We will do two contracts each.
Date: June 16, 2023
Price: RUT @ 1798
Sell two June 16 RUT 1790 put @ $52.40
Buy two June 16 RUT 1730 put @ $33.65
Sell two June 16 RUT 1790 call @ $59.71
Buy two June 16 RUT 1840 call @ $33.40
Net credit: $9,012
We gave this butterfly a longer-dated expiration so that large price moves do not affect our P&L as much.
We are using the June 16 expiration, which is 56 days away.
Payoff Diagram
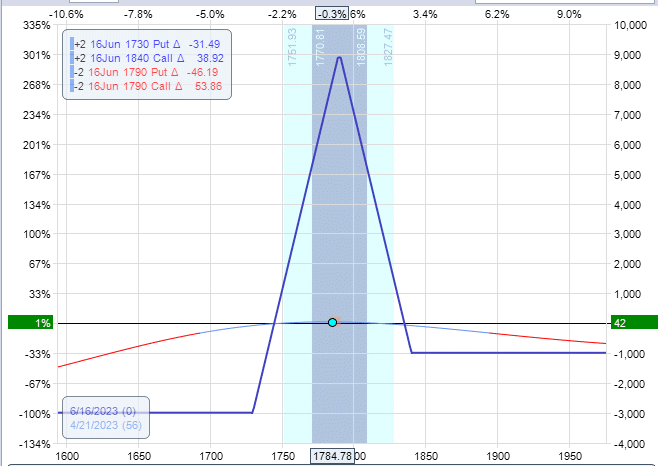
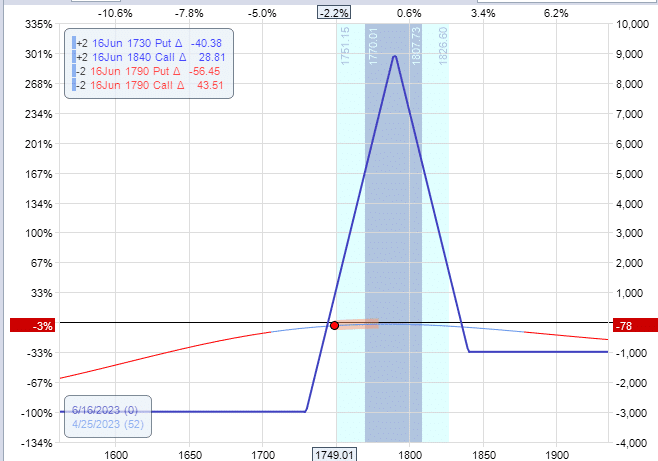
The payoff expiration graph is similar to an iron condor, except that the credit spreads are so close together that their short strikes touch, forming a peak, as shown in the graph.
The uneven width of the spreads makes the butterfly a “broken wing” such that our upside risk is less than our downside risk.
The max risk in this trade is $3000, with a theoretical potential reward of $9000. This is a 3-to-1 reward-to-risk ratio.
The Greeks are:
![]()
Due to the put-call skew in the indices, it would have too much negative delta if we had made this a symmetrical butterfly.
By having the bear call spread more narrow than the bull put spread, we can get our position delta close to zero.
The current delta of -0.20 is considered neutral for a two-lot butterfly.
The smaller that we get our delta, the larger our Theta/Delta ratio will be (as noted by T/D in OptionNet Explorer).
Maximum Loss
The expiration graph shows that the max risk occurs when RUT is below 1730 at expiration.
In that case, the bear call spread is completely out-of-the-money and expires worthless.
The bull put spread is completely in-the-money.
The loss incurred by this 60-point-wide spread at expiration is $6000 per spread.
This butterfly has two such spreads. Hence a loss of $12,000.
The initial credit of $9,012 offset this loss when we first initiated the trade.
Therefore, the max loss in this trade would be $12,000 – $9,012 = $2988, or about $3000, which is what reading the expiration graph will show.
Maximum Gain
The max potential gain on this butterfly is when RUT is at the center strike of $1790 at expiration.
If this happens, both the bull put spread, and the bear call spread will be out of the money and incur no loss.
We keep the full initial credit which is $9,012.
You can see that the expiration graph peaks at around a P&L of $9000.
Break Even Price
The break-even price is where the expiration graph crosses the zero-profit horizontal line in the graph.
There are two break-even prices, as we can see from the graph.
The lower break-even price is determined by how much money the bull put spread can lose before we lose on the trade, given that we have an initial credit of $9,012.
We have a two-lot spread, so each spread can lose up to $4506.
The bull put spread will lose $4506 if the price of RUT goes $45.06 below $1790, or $1745.
Therefore RUT at 1745 is the lower break-even price.
If RUT is below 1745 at expiration, we lose on the trade.
The upper break-even price is determined by seeing where RUT would be when the bear call spread loses $4506.
RUT would have to be inside the bear call spread by $45.06.
$1790 + $45.06 = $1835.
So the break-even prices are $1745 and $1835.
If RUT is between those two prices at expiration, we will get at least some profit in the trade.
Adjustment: Rolling Down the Put Spread
There is nothing to do in this trade until four days later, on April 25, when the price of RUT is about to go outside the tent on the lower side:
See that RUT is at 1749 and is approaching our lower break-even point of 1745.
Let’s roll the lower side further away by closing the existing put credit spread and opening a new put credit spread lower in strikes at 1740/1680.
Date: April 24, 2023
Price: RUT @ 1749
Buy to close two June 16 RUT 1790 put @ $72.89
Sell to close two June 16 RUT 1730 put @ $47.83
Sell to open two June 16 RUT 1740 put @ $49.76
Buy to open two June 16 RUT 1680 put @ $32.31
Net Debit: $1522
This is the resulting payoff graph:
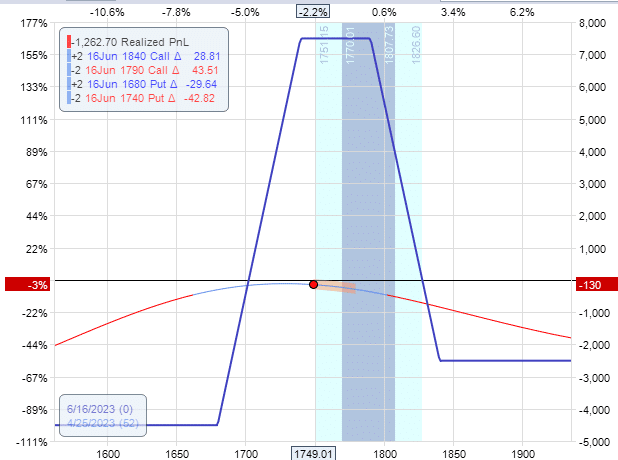
Because we paid a debit for this adjustment, this increases our risk in the trade to about $4500.
It took off the tip of the butterfly, giving it a condor-like shape. This reduces the max potential reward of the trade down to $7500.
An adjustment will change our break-even points as well as our max risk.
Profit Target
We are aiming for a profit target of 10% return on capital.
We want to ensure the trade does not lose more than 15%.
If it does, we will exit the trade to ensure our loss is not much greater than our potential profit target.
It is often a good idea to put in a good-til-canceled (GTC) order to exit for a profit target in case it is hit while we are not watching.
Our capital at risk is $4500.
Ten percent of that is $450, which we want as our profit.
We got an initial credit of $9,012.
Then we paid $1522 for the adjustment. So we are left with a credit of $7490.
If we want $450 out of this trade, then we are willing to pay the most to close the trade is $7040.
Since we have two contracts, the most we will pay to close each contract is $3745.
Therefore, we set a GTC limit order of $37.45 debit to close the entire trade.
This tells the broker that we are willing to pay this price to exit, but we are not going to pay more.
The order will trigger if the market allows us to exit the trade for a $37.45 debit or less.
Even though we have the GTC order in place, we still need to monitor the trade to watch for our exit loss trigger of 15% or if the price starts to go outside the tent again, and we need to make another adjustment.
Trade Reach Profit Target
On May 2, our GTC order was fulfilled when the payoff graph looked like this…
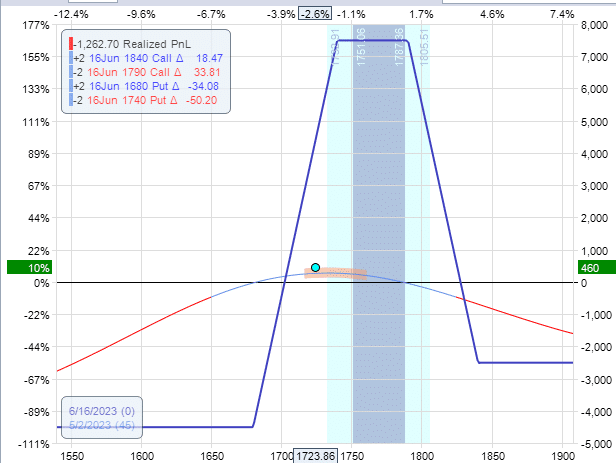
We paid $7040 to exit the entire trade.
In summary,
Initial credit: $9,012
Adjustment debit: -$1522
Exit debit: -$7040
Net profit: $450, or 10% return in 11 days
Frequently Asked Questions:
Are there risks for early assignments?
Because we are trading this butterfly on the RUT index, which is cash-settled, there is no early assignment or any assignment at all.
At expiration, the resulting profit or loss from the contract is settled in cash.
If we were doing this strategy on stocks, any short put or short call could be assigned to you before its expiration date, referred to as “early assignment” in American-style options (as opposed to European-style options).
The risk is only significant if the short put or short call is in-the-money, except for rare occasions of dividend events.
While early assignment can technically occur anytime, the risk is highest during the expiration week.
If you are short a put option, you are obligated to buy the stock at the strike price if assigned on the put option.
If you are short a call option, you are obligated to sell the stock at the strike price if you get assigned the call option.
What is the effect of time decay on range-bound trades?
Range-bound trades want the underlying to not move.
If it moves too much, the trade loses money.
Therefore it does not make money based on whether the underlying goes up or down.
Then how does it make money?
It makes money either over time or when volatility changes occur.
Time decay is the profit made via the passage of time.
This occurs when we have positive theta in the trade.
Theta tells us how much money the trade theoretically should make with each passing day (including non-trading days) – assuming all other factors stay the same.
What is the Effect of Volatility?
Some range-bound strategies have negative vega.
These are the butterfly, the iron condors, and the short strangles and straddles.
Negative vega means that they benefit when volatility decreases.
Other range-bound trades, such as the calendar, are positive vega. In theory, they benefit when volatility increases.
However, calendars have complex behaviors, which may not always be true in live markets.
Other range-bound trades, such as the double diagonal, can be configured to be either positive or negative vega.
What are the risks of range-bound trades?
There are two major risks of range-bound trades:
- The underlying moves too much in one direction. If you look at the T+0 line of range-bound trades, it slopes down to negative P&L as you move further away from the options structure on either side. When the price has moved away from your option structure, there is no theta to generate income in the trade. The trade may even have negative theta.
- The underlying makes large whipsaw moves. The price goes up, causing the trader to adjust. Then it goes down, causing the trader to reverse the adjustment. Then it goes up again, and so on. Every adjustment has a cost in terms of slippage and commissions. If the market does not stay still long even, theta can not generate enough income to overcome that cost.
Conclusion:
This trade example is in the category of range-bound trades.
We can not expect these trades to hit profit targets without adjustments.
The markets are just moving around too much for that.
With only one adjustment before reaching the profit target, this is considered a smooth trade without much drama.
Looking back at the original payoff graph when the trade started, you can see that the break-even prices are outside the two standard deviation moves RUT could make at expiration. The two standard deviations are denoted in OptionNet Explorer by the cyan color background shading.
As such, this butterfly is a rather wide butterfly.
A big butterfly in a longer-dated DTE (days to expiration) trade is what made this butterfly able to handle the market moves easily.
Next time, we’ll show you a trade example with more action.
We hope you enjoyed this article about the broken wing iron butterfly.
If you have any questions, please send an email or leave a comment below.
Trade safe!
Disclaimer: The information above is for educational purposes only and should not be treated as investment advice. The strategy presented would not be suitable for investors who are not familiar with exchange traded options. Any readers interested in this strategy should do their own research and seek advice from a licensed financial adviser.


