


Today, we are doing a ThinkorSwim tutorial.
We will look at the features, costs, analysis tools and how to get started.
We will also discuss the pros and cons and answer from FAQ.
Contents
- Introduction
- What is ThinkorSwim
- ThinkorSwim Features (Overview)
- Features Breakdown and How to Use Them
- Costs and Fees
- Paper Trading
- Education and Research
- Pros and Cons
- FAQ
- Conclusion
Introduction
There are many trading platforms out there, but one of the most common is ThinkorSwim.
Offered by TD Ameritrade, it is often synonymous with beginning and intermediate investors.
The platform is pretty simple to use, offers a plethora of tools and charts, and comes with news and chat rooms built-in.
All for Free.
What is ThinkorSwim
As stated above, ThinkorSwim (ToS from now on) is the desktop platform offered by broker TD Ameritrade.
It is simple to use, free to download, and has a host of fantastic tools for investors and traders.
One of the coolest of these is the “Spreadhacker,” which allows you to scan the entire options universe for spreads that meet your specific needs and wants.
ThinkorSwim comes with data included in the platform and smart order routing enabled by default.
You can trade with Cash accounts all the way through full Margin with a few options in between.
You can also select a paper or live trading account if you have strategies you want to try before you go live.
ThinkorSwim Features (Overview)
ToS has far too many features to list successively, but here are some of the best from a daily options trader:
- Easy account activity navigation
- Customizable data columns
- Strategy rolling tool
- Active trader tabs inclusive of L2, charts, Time and Sales, and news
- Product depths for options and futures inclusive of IV and the Greeks
- Options Time and Sales for all transactions
- Current day options statistics
- Customizable product columns
- Trade Risk Profile
- Trade Probability analysis
- Backtesting tools
- Stock/Spread/Options Scanners
- Built-in Charting Packages
- Built-in Scripting Language
- Education and Learning
Below I will dive into each of these, grouping together the ones that make sense.
Some of them, like the scripting and charts, go hand in hand.
Features Breakdown and How to Use Them
How to use ToS Charts
ToS charts are powerful when you learn to use them right.
They offer a host of tools from the usual moving averages to advanced tools like Volume by Price and fractal indicators.
You can also import and add your custom tools and indicators through their Thinkscripting language.
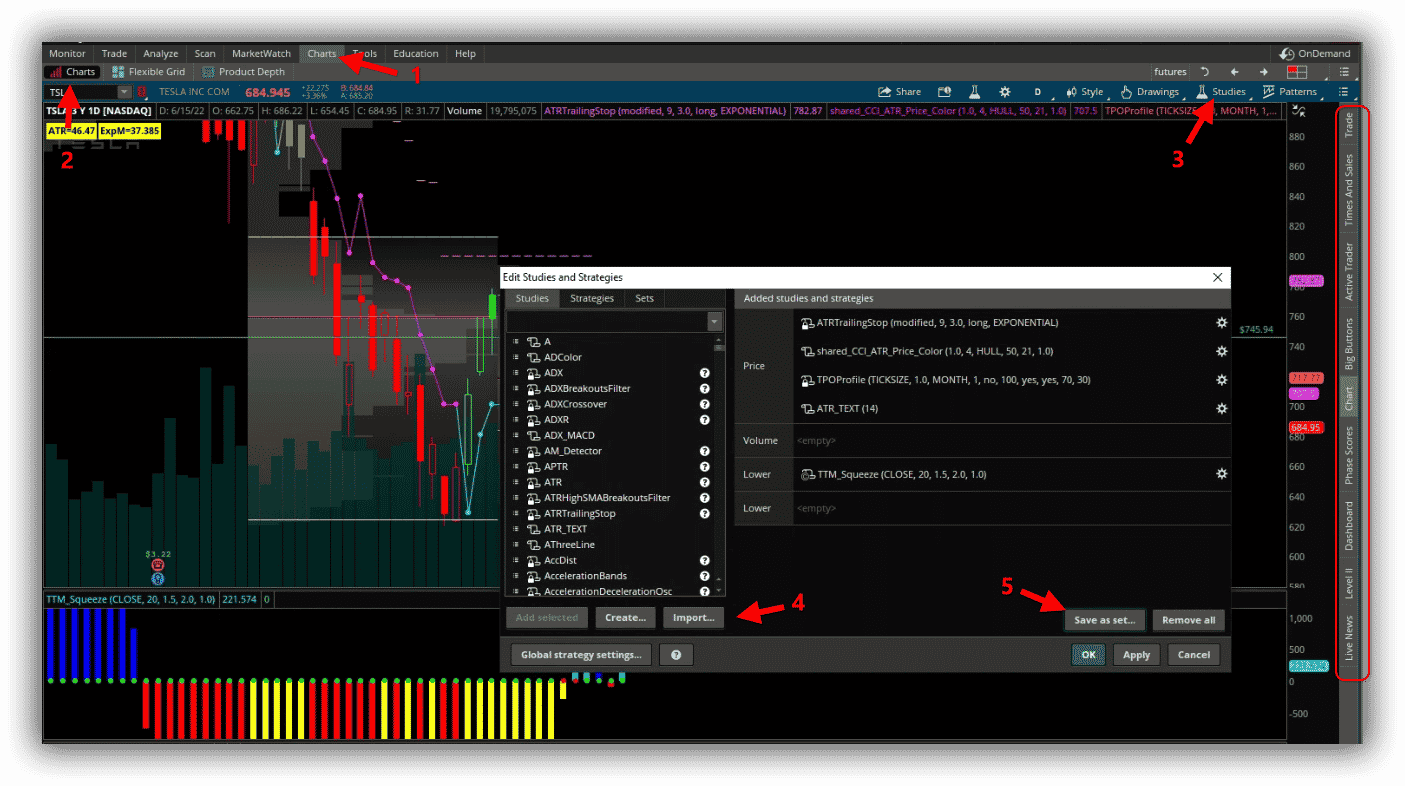
You navigate by clicking on the Charts (1) and then clicking on the Charts (2) button inside the overall charts menu.
This is a bit confusing and redundant, but when you explore some of the other options inside the charts tool, it will make more sense.
This will open up a blank chart.
Once you have a blank chart up, you can open the Studies button (3) and click on Edit Studies in the drop-down.
That will bring up the screen you see in the middle of the chart.
From here, you can scroll through the pre-existing chart studies, create study sets (5), and create/import your own studies through the thinkscript language (4).
From this chart menu, you can also do cool things like enable Level 2 on the chart, look at the Time and Sales, activate live news, and open Trade tabs/Active Trade tabs. (Red Rectangle on the right side).
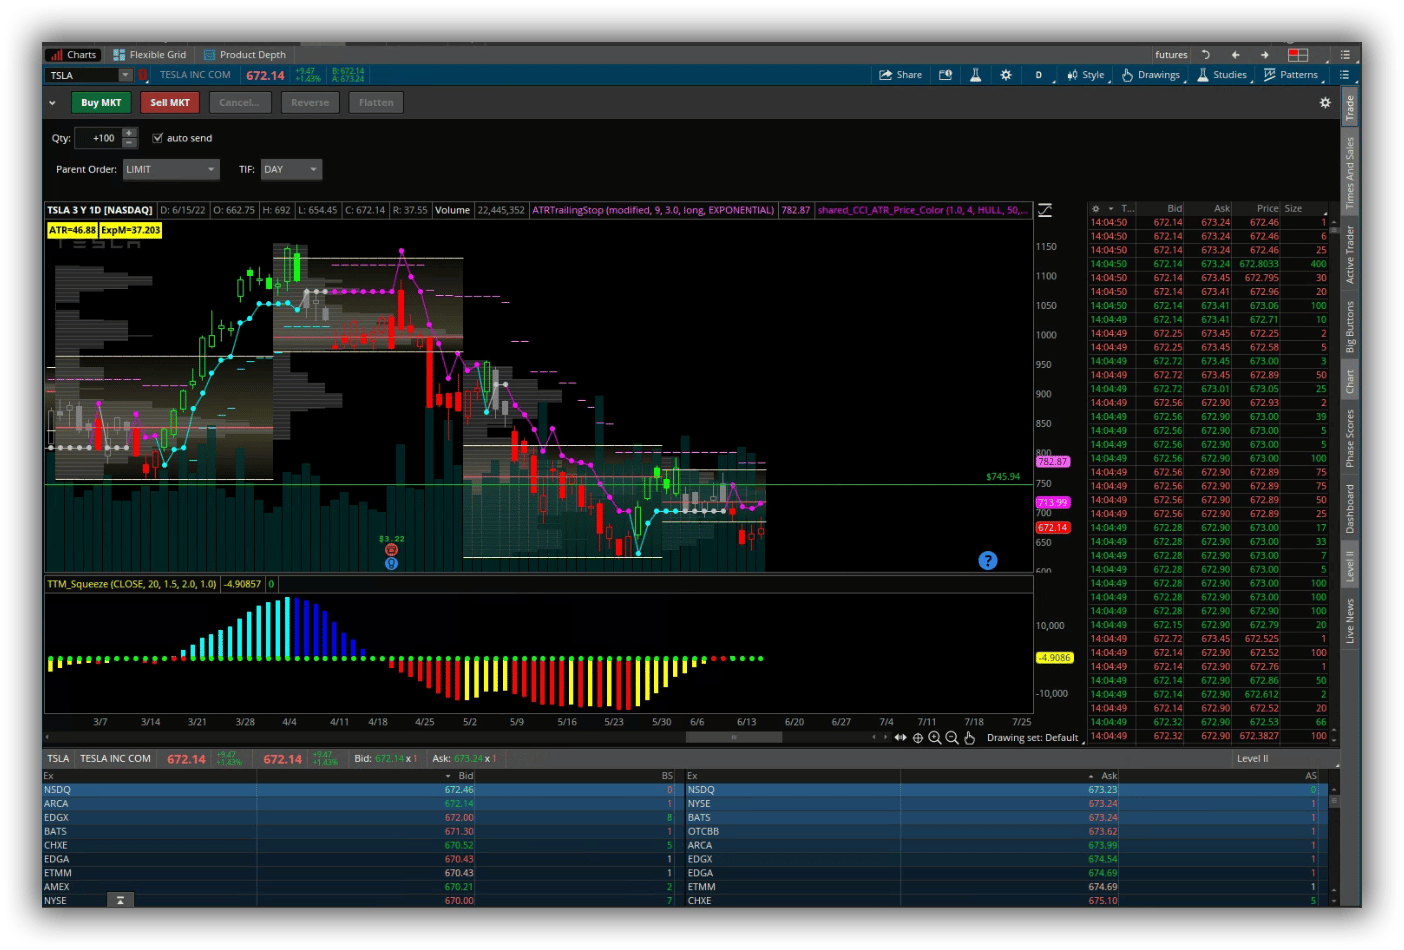
Below is what a trading chart will look like if you have active L2, Time and Sales, and the Trade options.
Analysis Tools
ToS also has some useful analysis tools.
One of these tools is the thinkback tool.
This allows for historical analysis of trades.
So you can backtest a trade even on options to see how it would have worked out daily.
The thinkback tool allows you to pick a ticker (1) and the option you wish (2).
You then can alter the date(3) to select when you would have entered the trade.
Once that is in the backtrades menu (4), you can start changing the PnL date (5) and see how you would have fared over time.

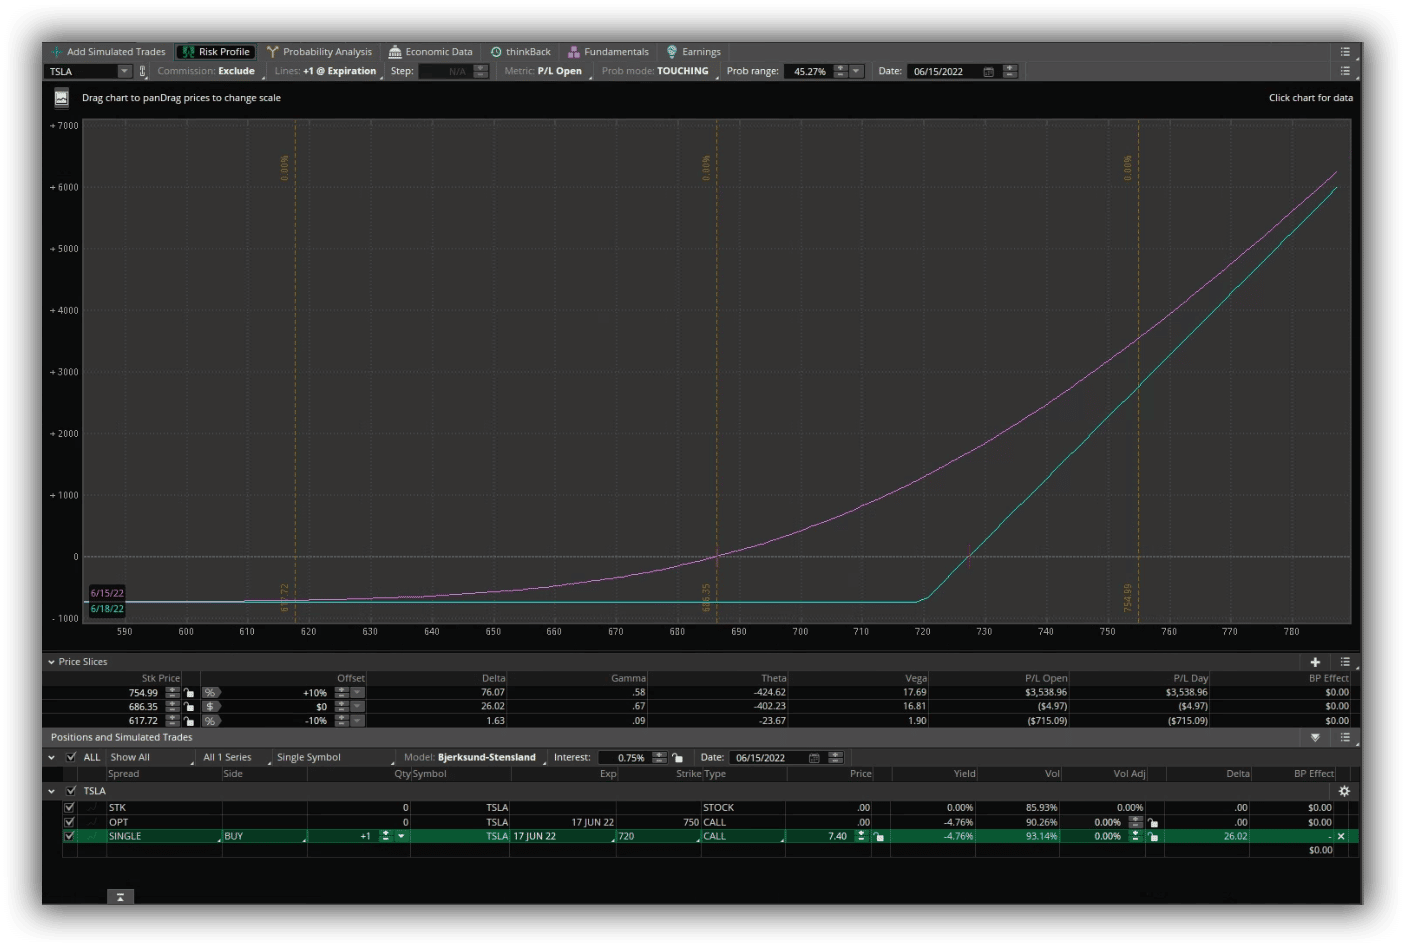
Some of the other tools that ToS has are more standard to other platforms.
One of these is a risk profile so that you can see the theoretical PnL on a trade over time and where a trade will sit on the expiration day.
The remainder of the Analysis tab consists of more basic tools.
First, the Probability analysis tool allows you to see the theoretical probability of being In the Money, Touching Strike Price, and Out of the Money on a particular trade.
Second, Third and Fourth are all related tools.
There is the Economic Data tab, which allows you to view specific pieces of economic data from the FRED database as well as from other Federal and private bodies.
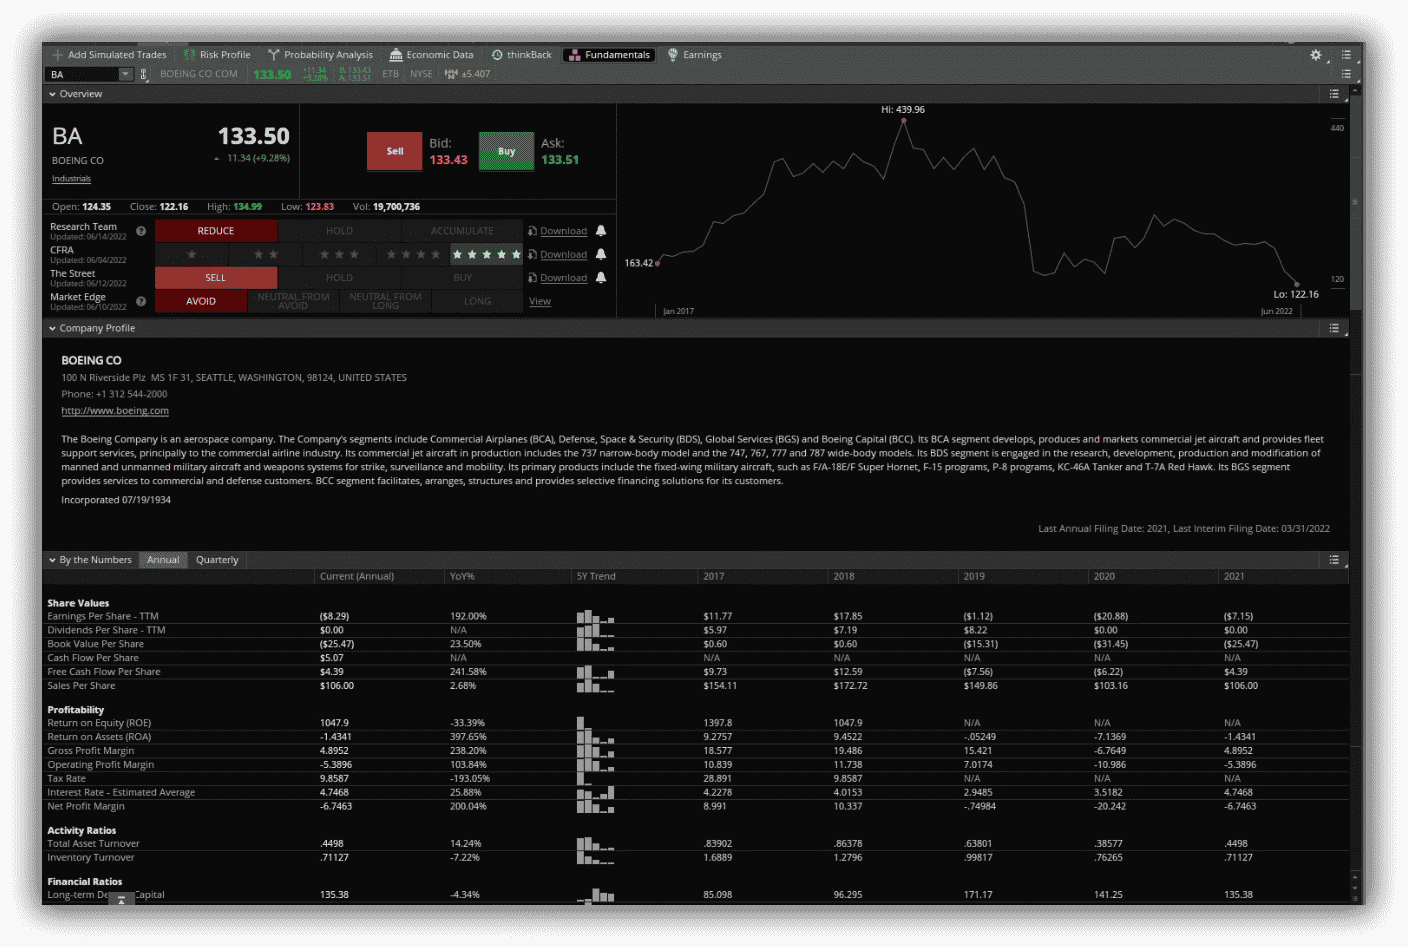
Next is the Fundamentals tab, which lets you look at the fundamentals of a particular company before investing.
This information comes from a variety of sources, with the largest being the SEC filing database.
You can see all the relevant metrics for a company, from EPS and Cashflow to CAPEX and other Balance sheet items.
They also show trends for each of the metrics available.
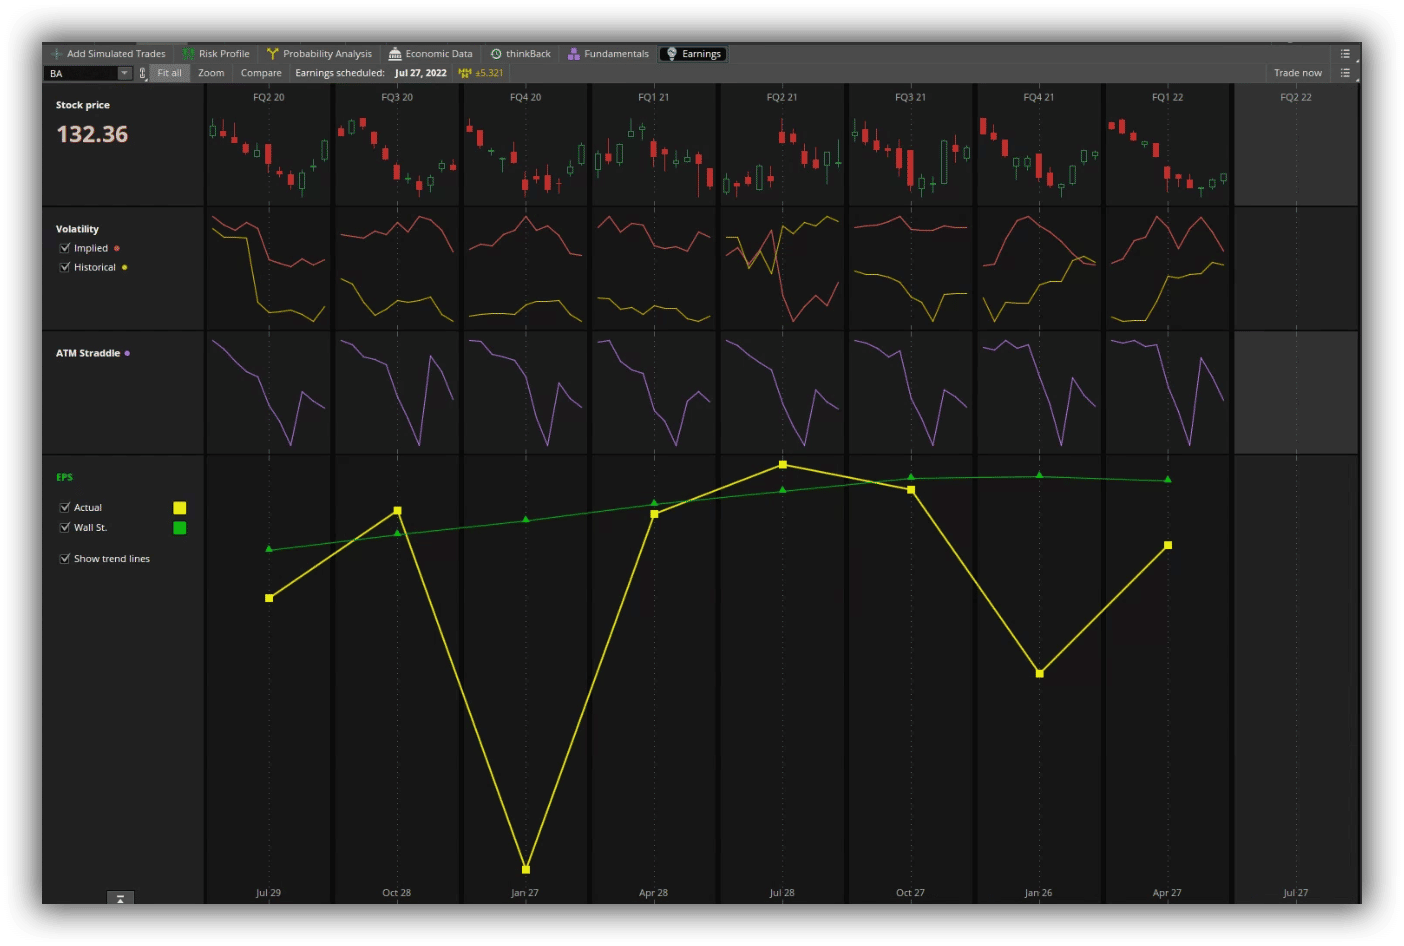
Finally, there is the Earnings Tab which shows you how the stock price fared on previous earnings announcements as well as trends, historical and implied volatility for the move, how a particular strategy would have worked, and how the earnings were when compared to estimates.
Scanners
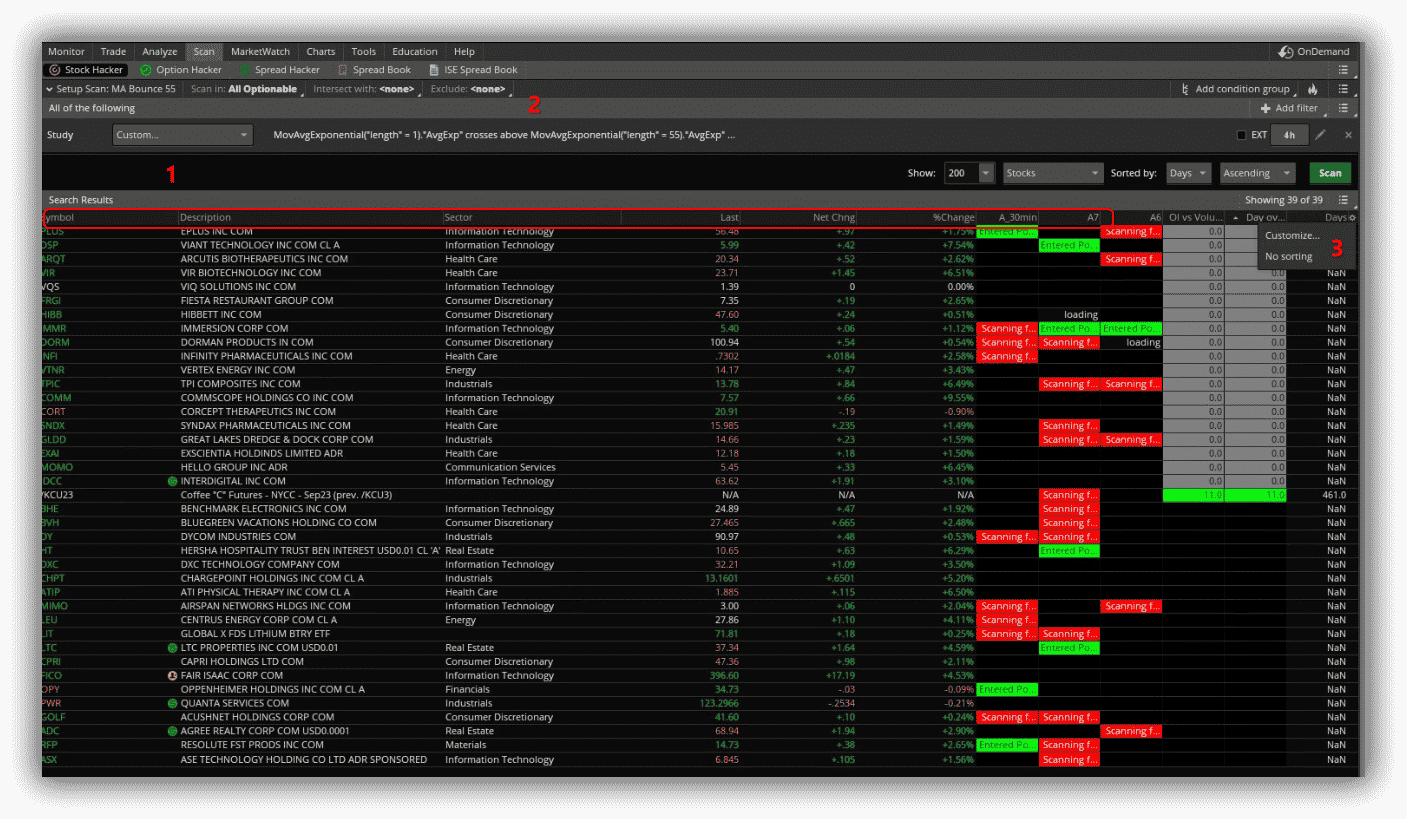
The scanners tab consists of a few different scanning options. ToS calls their scanners “hackers,” So there is the Stock Hacker, the Option Hacker, and the Spread Hacker.
The Stock Hacker is a stock scanner. You can load in some scanning criteria in the filters area (1), which will scan all of the stocks you set in your universe scan settings (2).
Any equity or future that meets the criteria will be displayed in the results area below it.
The columns of the results can be edited to run custom scripts like in the screenshot below (I am running scripts on the TTM and some proprietary work).
These customizations can be done by clicking the little gear on the far right and selecting customize (3).
These changes will be reflected in the headings bar (inside the red rectangle).
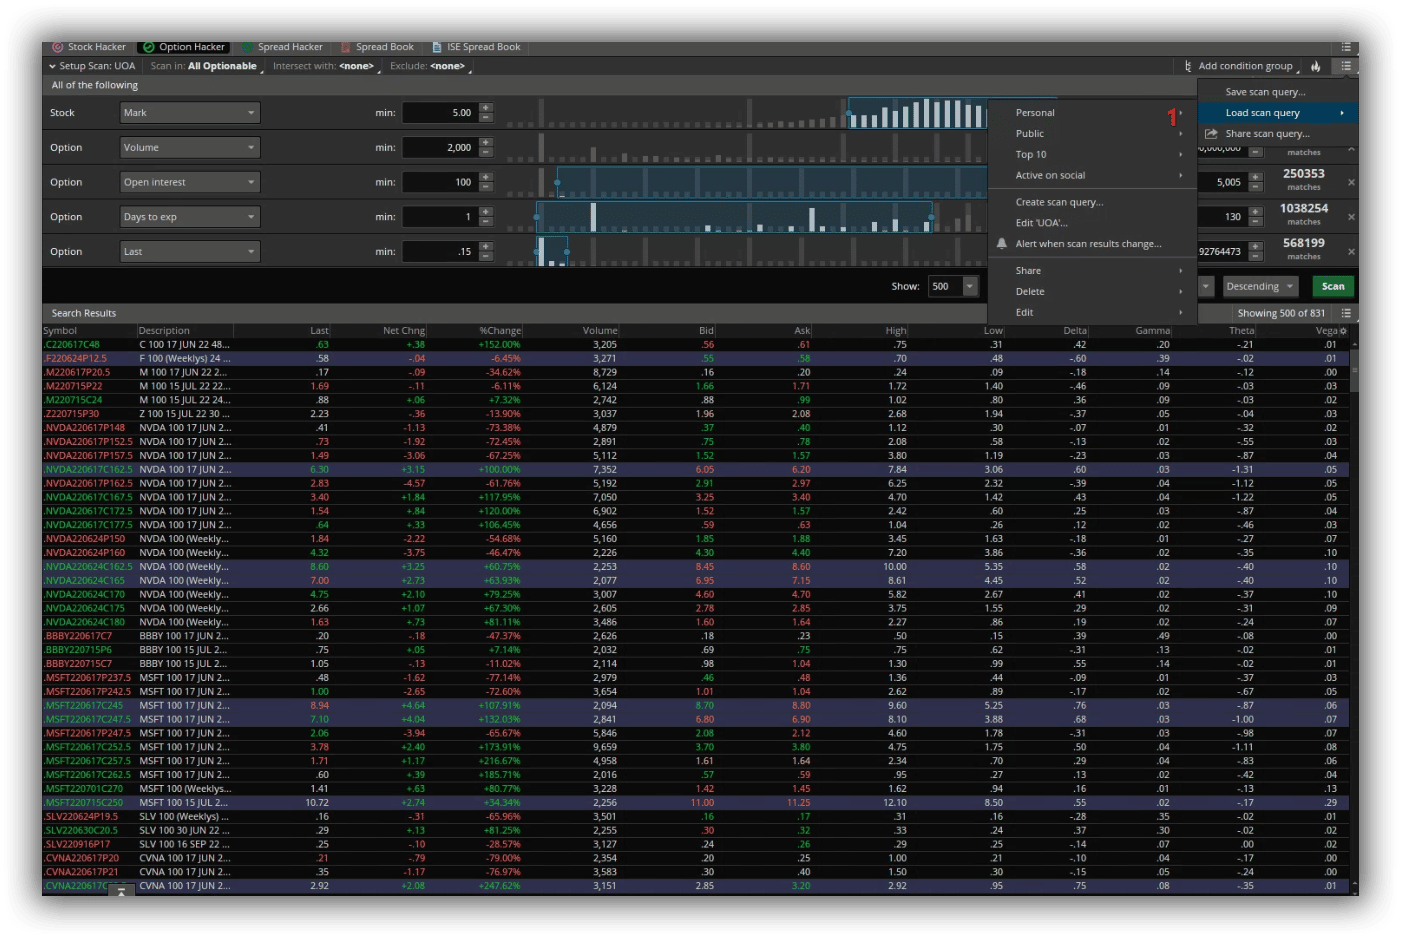
Next is the Options Hacker.
This has all of the same inputs as the Stock Hacker but will display each individual contract that will meet the criteria scanned for.
As a result, it is best to narrow these results down, as it’s not uncommon to see 1000+ results.
One of the nicer features of all of the scanners is you can save your search queries by selecting the three lines in the upper right and “save scan query” (1).
This will let you run them later without having to rebuild them completely.
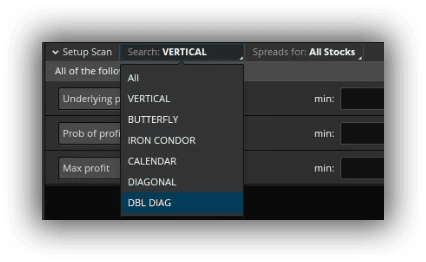
Finally, there is the Spread Hacker.
This scanner allows you to search the same as the other two, but the key difference is that it will allow you to filter by spread type.
If you want a vertical, you will select that from the drop-down at the top.
If you want a diagonal, same thing. They offer the top 5 most popular spread types as ToS sees them.
This is a really handy tool as you can filter by the probability of profit and max profit, so it will allow you to find some interesting opportunities in securities you otherwise would not have thought of.
There are two other tools on this tab. Both of them are spread books.
A spread book allows you to view all of the working spread trades for a specific instrument.
This is also an interesting place to look from time to time and see what other players are doing in the instruments that you often trade-in.
Anything of unusual size might be worth some further investigation.
Trade and Monitor
This brings us to our final two tabs for this article, the Trade Tab and the Monitor Tab.
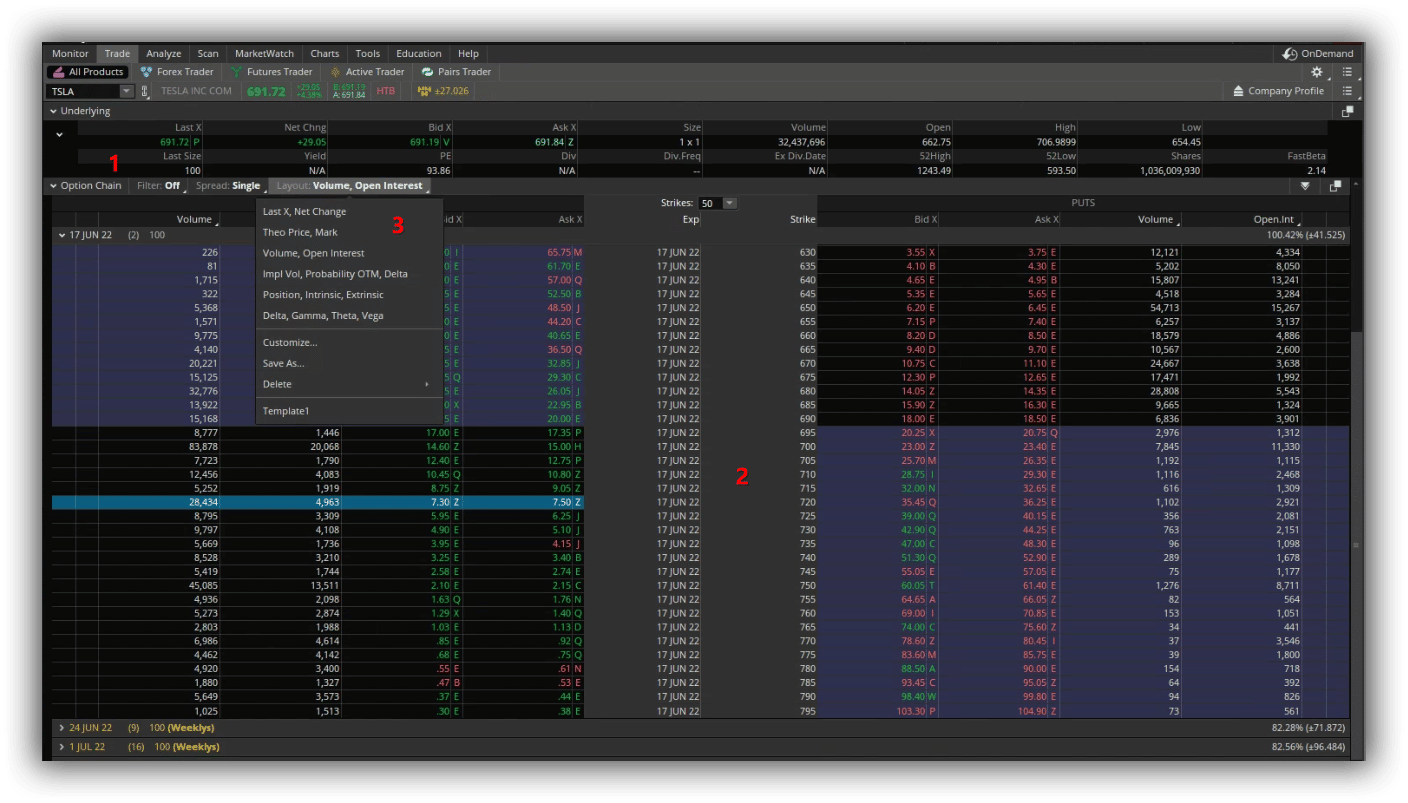
The trade tab has all the information about an instrument you search for.
When you first bring up the instrument, you will see the Underlying area (1).
This is where all of the basic stock information sits.
Last, Bid, Ask, Sizes, dates, and recent Hi/Lo data are here.
Directly under that are the options chains (2).
Here, you can select from both monthly and weekly options chains, and both calls and puts will be displayed.
Across the top of the options chains, you can select if you want a single option or a spread, as well as what layout you would like the information displayed (3).
This screen is almost infinitely customizable.
Below the options chains are Options Statistics for the day, large options trades for that specific security, and then the product depth for the options.
The product depth is ToS’s term for the term structure of the volatility surface for the instrument.
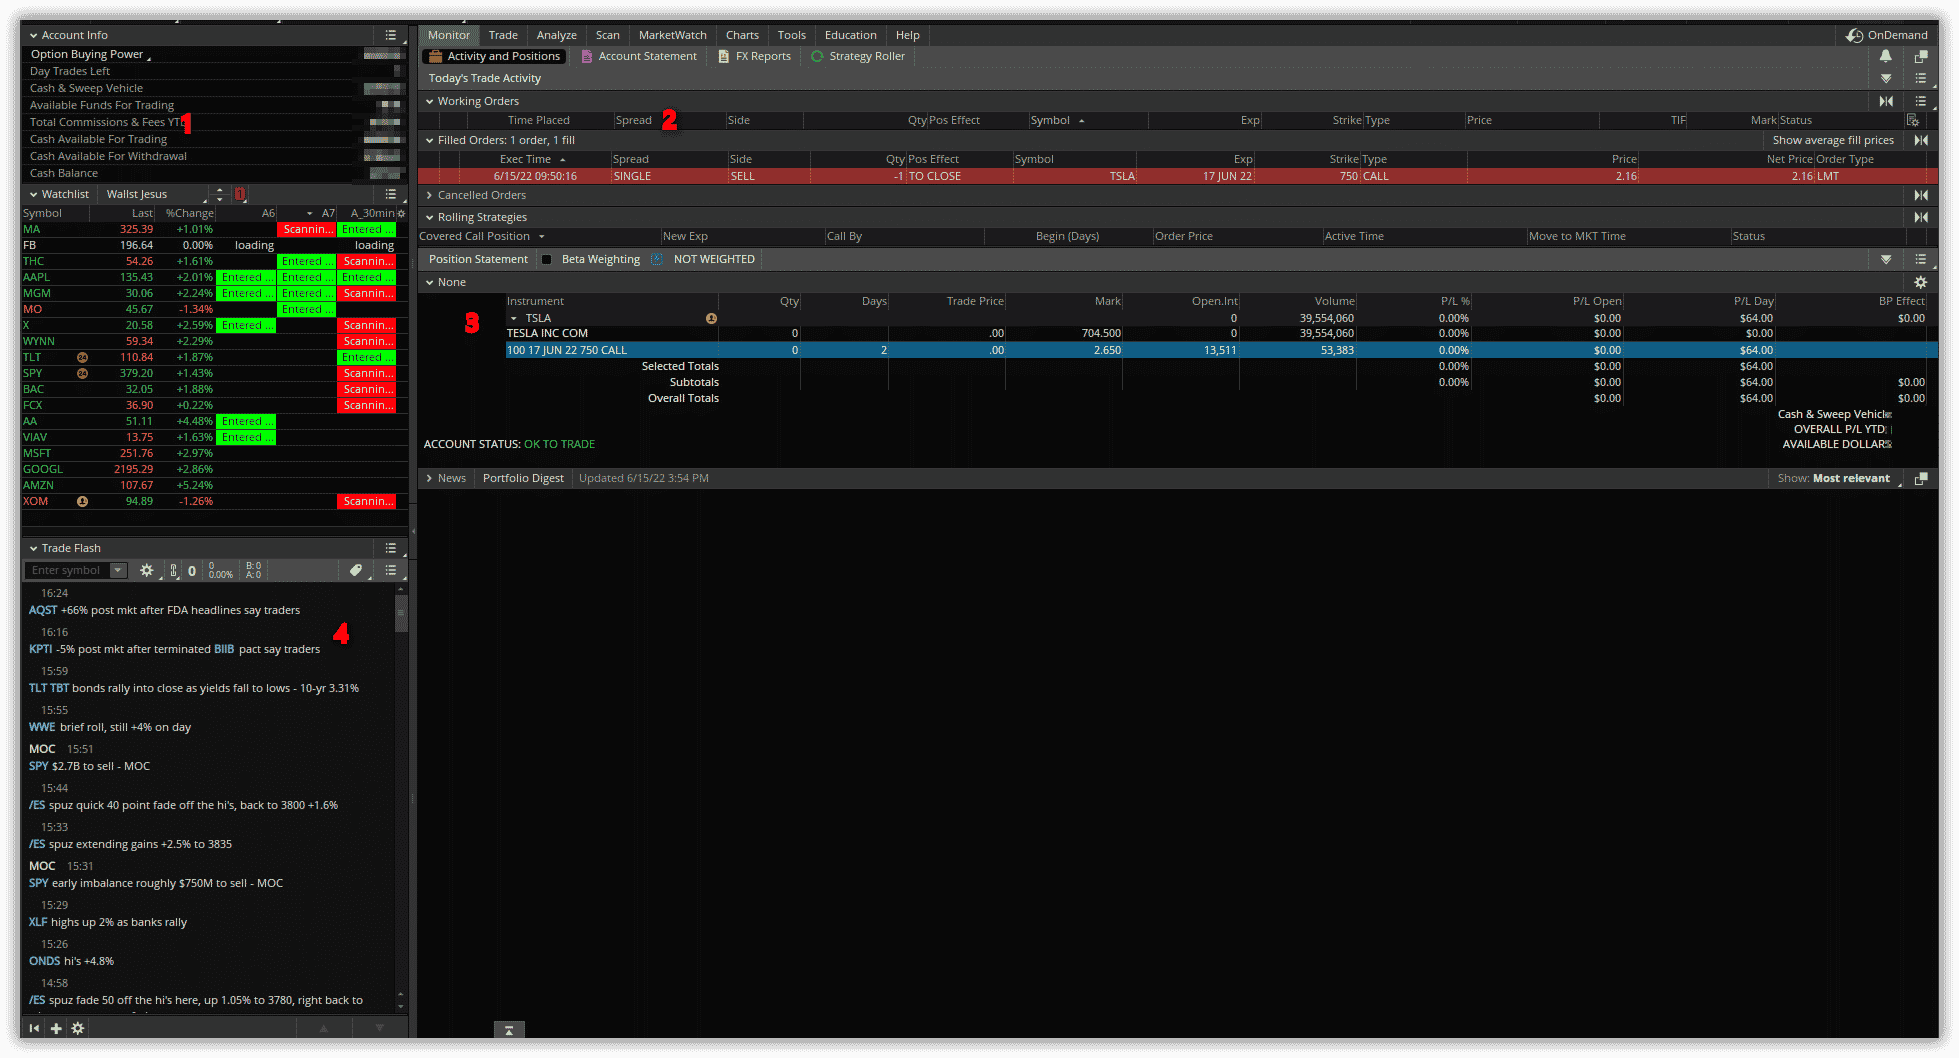
Moving to the Monitor tab, you will see a few things.
At the top will be your current activity for the day (2).
This is both working and filled orders, as well as the canceled orders and any potential rolling strategies you could use.
Below that is the Position Statement (3), which is basically all of your open positions.
All of the columns on this page are also customizable to show different metrics for your open positions.
I like the basics of PnL %, PnL on the Day, and PnL Open, but you can get as fancy as you would like.
Something that is not unique to this page but will be mentioned here is the sidebar (1).
This sidebar can contain small charts, quote boards, watchlists that can also be customized, your account information, and a widget called Trade Flash.
Tradeflash (4) is a feature that allows you to see a curated list of large and unusual trades that come through the tape.
This is one of the nicest features of ToS in my book.
Costs and Fees
ThinkorSwim has no fee associated with the platform itself.
The application and the data are all free to use if you have a live account with them.
They have a low commission for options ($0.65 + fees) and no fee for equities ($0.00 + fees).
Futures maintain a $2.25/contract commission plus all regulatory and exchange fees.
Paper Trading
When you sign up for TD Ameritrade through ThinkorSwim, you are given a paper trading account with a $100,000 net liquidating value.
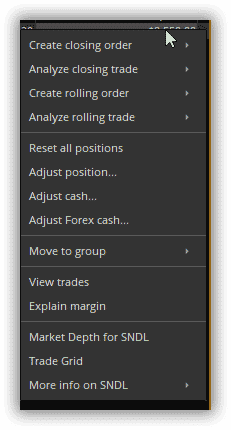
By right-clicking on the order totals box on the Monitor Tab, you can open a menu to perform a cash adjustment or a complete reset of all positions should you need to alter something.
As with most paper trading accounts, the data is delayed by 20 minutes, but you can still use all of the features available to the live accounts through the paper account.
Education and Research
Research
Research is covered above in the section on the Analysis tab in greater detail.
That tab provides access to governmental reports (SEC and FRED databases) and earnings and fundamentals.
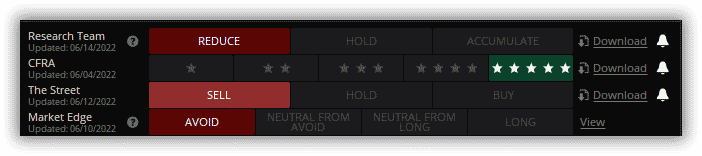
A few things not discussed above are that on the Fundamentals menu, you will see a few analyst opinions on the stock you chose.
One is TD’s own research team, one is CFRA, one is The Street, and the last is Market Edge.
You can also download the reports by clicking the download button next to the desired source.
Another area not discussed above is the Marketwatch tab.
This has the basic quote board and any alerts you may set on the charts, but it also has a great Heatmap that will allow you to filter how you see it by Index, preset filter, or your personal watchlists.
The Heatmap is standard, but the filtering is great.
Next to the Heatmap are Financing rates.
You can run this against your watchlist to see what rates are available for shorting any stocks on your watchlist.
Not something needed for options but an exceptional tool for equities, especially if you trade in both directions.
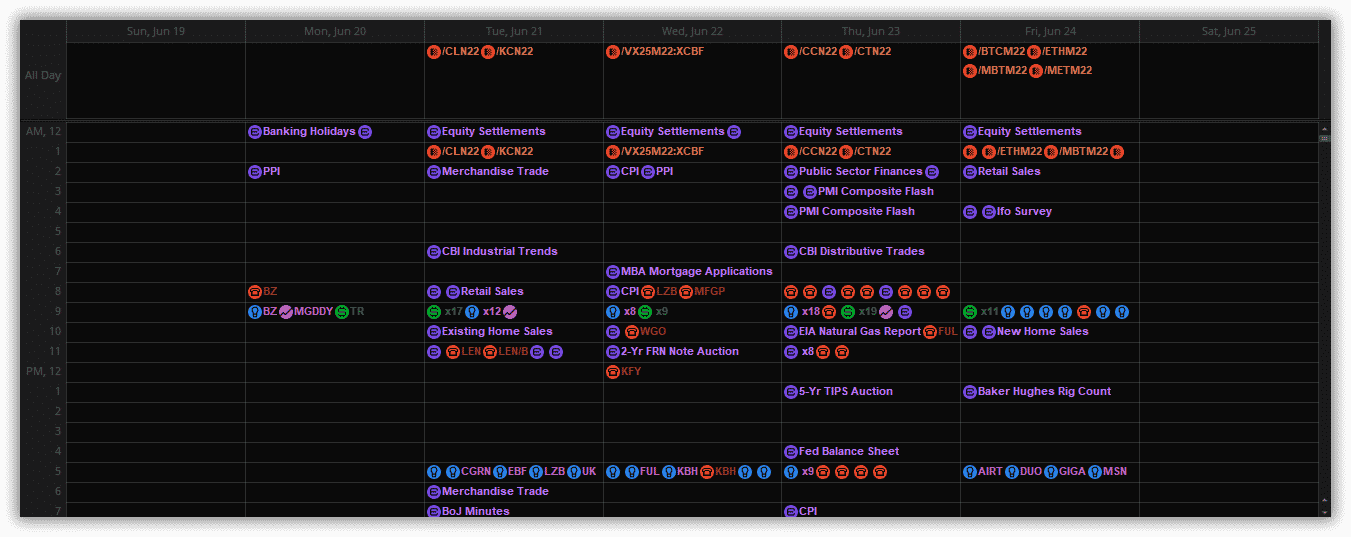
Finally, there is the calendar tab.
This calendar is exceptionally useful as you can see every scheduled event occurring that day and week, what instrument it affects, and what news is scheduled.
You can also see when futures contracts expire/are liquidated, earnings, dividends, splits, and conference calls.
You can further filter it by day, week, month, or just have it as a list. As a side note, all of these events will also appear on the chart of an equity if it is affected by it.
Education
ToS also has an education tab built right into the platform.
This has two options under it, Education and Learning Center.
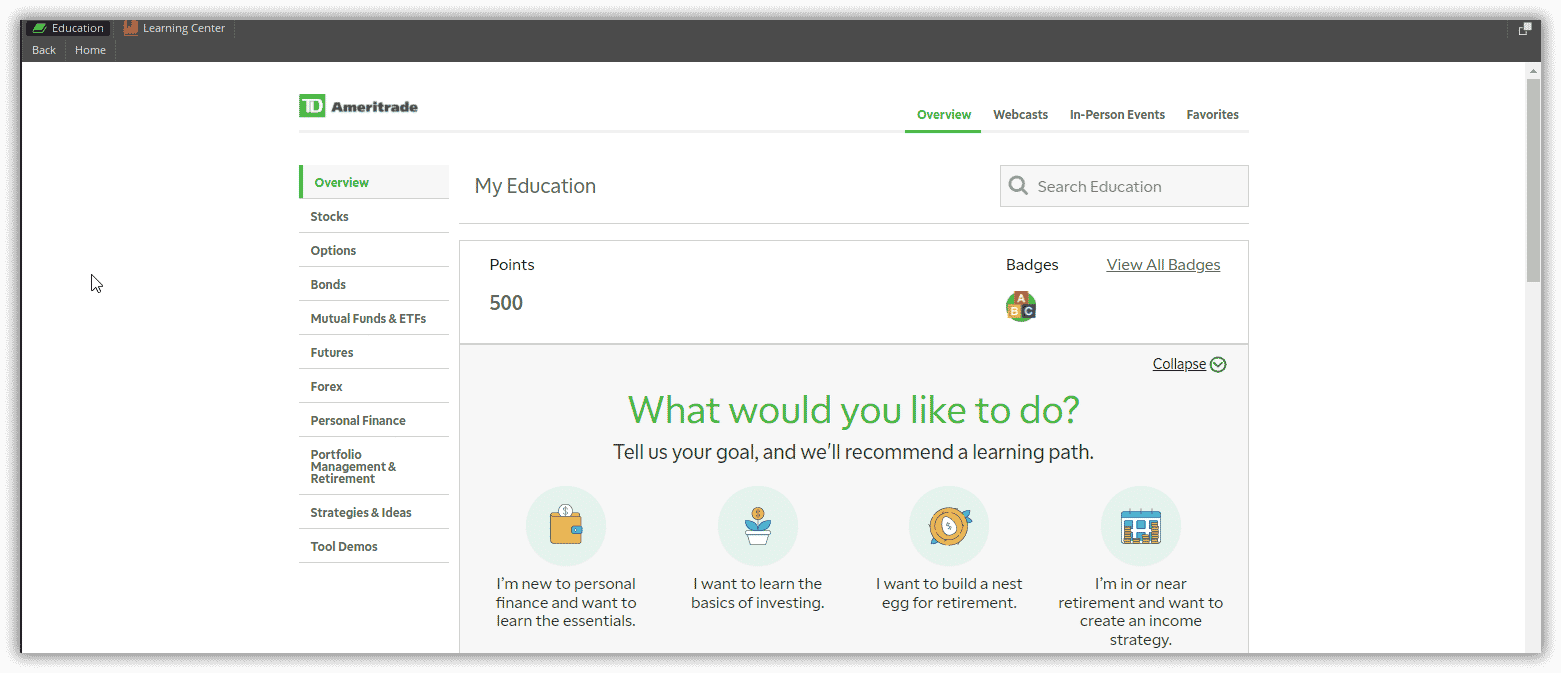
Education is just that; it is access to the TD Ameritrade education center that has webcasts and articles for all levels of trading and users.
You can break it down by the class of instrument you plan to trade or by the tool or strategy you are trying to implement.
If you need to learn something, the education center will offer it to you.
This is a huge perk of the platform. It’s built-in and included.
They also offer the learning center, which is more text-based learning.
Here you can learn how to use the platform with in-depth tutorials.
You can also learn how to analyze charts with different forms of technical analysis, drawings, chart patterns, and indicators.
You can look at their thinkscript language and learn how to create your own custom scripts or just alter the ones you find online.
That is another perk of ToS; they have a thriving online community of people who are constantly creating, updating, and altering custom studies and scripts.
Pros and Cons
Pros:
- Free for the user
- No data fee’s with a live account
- Commission-free trading
- Extensive learning library
- Extensive tools available for traders
- Fantastic charting options
- A high degree of customization is available
- Direct access to Research databases
- Reachable and helpful Customer Service
Cons:
- It is a resource-heavy platform
- Requires a moderate amount of RAM on your machine
- Laggy around market open and high volatility
- Lacking user-friendly smartphone interface
- Web version not as good as the desktop version
- Spreads occasionally get filled in two separate legs
- Requires a large amount of capital for naked selling
- Data is not as granular as a premium data feed
- Lacks some of the Unusual options scanners currently popular
FAQ
Is ThinkorSwim good for Beginners?
ThinkorSwim is a great platform for beginners.
As with all platforms, there will be a decent learning curve to it, but it is fairly intuitive to use, and extensive resources are available.
Is ThinkorSwim the same as TD Ameritrade?
Yes, ThinkorSwim is now owned by TD Ameritrade.
TD will be your broker for all executions and the web portal you go through for deposits, withdrawals, and any account customizations such as margin changes or additional services.
Is ThinkorSwim hard?
While you will have a learning curve for ThinkorSwim, the platform is very investor-friendly.
It shows your max loss and max profit potential, margin requirements, and potential risks before you submit the trade.
Plus, with an active community, it is not hard to find help.
Is there a manual for ThinkorSwim?
Yes: A PDF manual exists on the website at the following link: https://tlc.thinkorswim.com/center/howToTos.html
Which is better, Robinhood or Thinkorswim?
I think this is a matter of opinion.
Most professional traders I know will say ThinkorSwim (or almost any real trading platform) is better than Robinhood.
I agree with this stance.
Between their pay-for-order flow model and their constant bugs in the app, I would say ToS is night and day better than Robinhood.
Conclusion
ThinkorSwim is a solid all-around platform.
They have a plethora of tools and data that will help you in your trading endeavors.
I have been using ThinkorSwim since I started trading just over a decade ago, and while I have a few other platforms for niche requirements, ToS is always my go-to for actual trading.
We hope you enjoyed this ThinkorSwim tutorial.
If you have any questions, please send an email or leave a comment below.
Trade safe!
Disclaimer: The information above is for educational purposes only and should not be treated as investment advice. The strategy presented would not be suitable for investors who are not familiar with exchange traded options. Any readers interested in this strategy should do their own research and seek advice from a licensed financial adviser.


I am not a TOS user, however I think that they do have commissions on Options Trades, 65 cents per contract + fees.
Thanks Gav. Is TOS available in Australia?
Unfortunately not. 🙁
Is there a reason you say this is for beginner and intermediate investors- what do advanced traders use?
Also on the con that they dont have a web version – link is below – but its not advanced as the desktop version
https://trade.thinkorswim.com/
It’s good for advanced traders as well.
Thanks for this tutorial. It is extremely helpful.
Glad it helped.
Hi Gavin, is this article written by you seriously as I know you are using IB instead in the most time?
I had a friend help me with it.