


An Interactive Brokers volume profile can be added to TWS charts and today you will learn how to do it. We will look at a couple of examples too.
Contents
- What Is A Volume Profile Chart?
- How To Read Interactive Brokers Volume Profile
- How To Add Volume Profile In How To Read Interactive Brokers Volume Profile
- FAQ
- Conclusion
What Is A Volume Profile Chart?
Within Interactive Brokers, or any broker to be honest, a volume profile chart can be useful for both short-term traders and long-term investors.
A volume profile chart, sometimes referred to as a market profile chart, gives clues as to the points of control for a stock.
With price, volume and time period shown on a single chart, the Interactive Brokers volume profile can show potential levels of support and resistance.
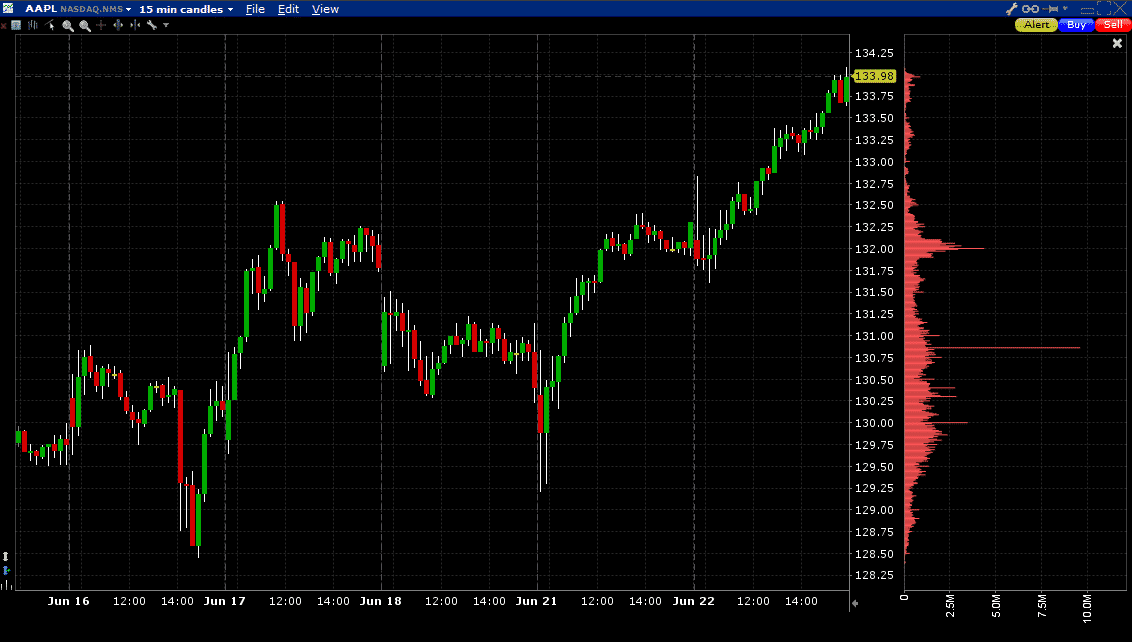
Below is an example of a 15-minute chart of AAPL taken from late June 2021.
From the volume histogram on the right, we can see that there is a potential level of support around 132.
Trades may use this information to structure a bull put spread trade with the view that AAPL will not break through 132.
How To Read Interactive Brokers Volume Profile
The volume profile chart is similar to a regular chart in that we have price on the vertical scale (y-axis) and time on the horizontal scale (x-axis).
We have now added a third parameter which is the volume histrogram to the right of the price labels.
The longest horizontal lines represent the largest amount of trading volume.
The price level with the greatest volume is known as the point of control.
Going back to our AAPL example, bulls took control once price broke out above 132 and went on a quick rally to 134.
This can be very useful information for short-term traders.
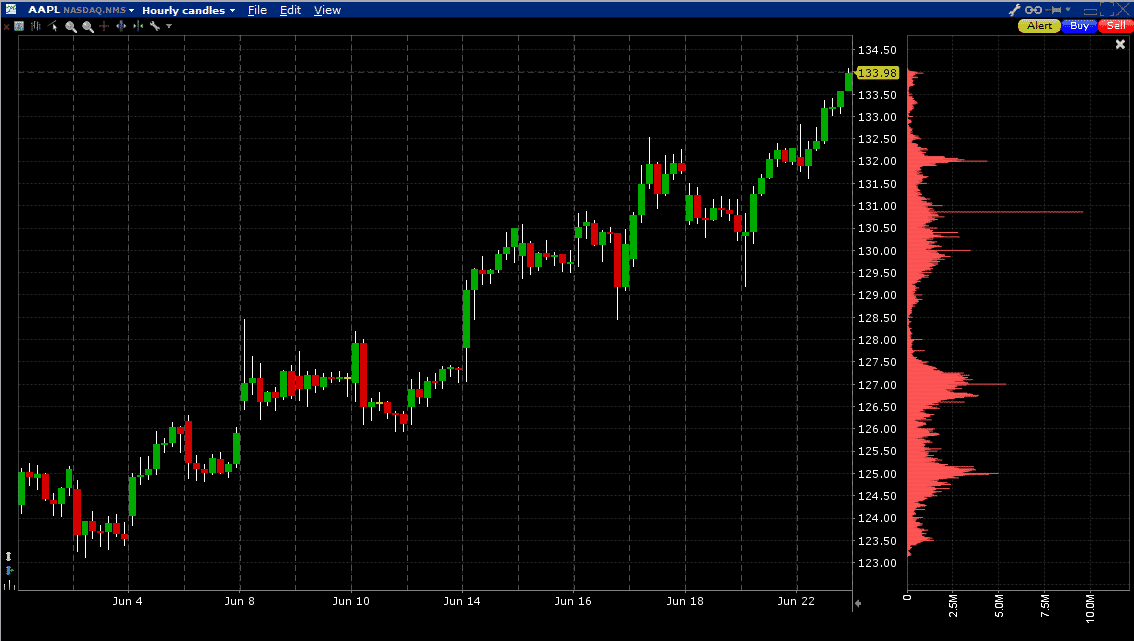
Below is the same chart but using hourly candles.
We can see a lot of volume between 129.50 and 132.
This should provide a strong support going forward.
Likewise, there is a volume void between 127.50 and 129.
Therefore, if AAPL breaks below 129, prices could quickly decline to 127.50 due to the lack of volume support.
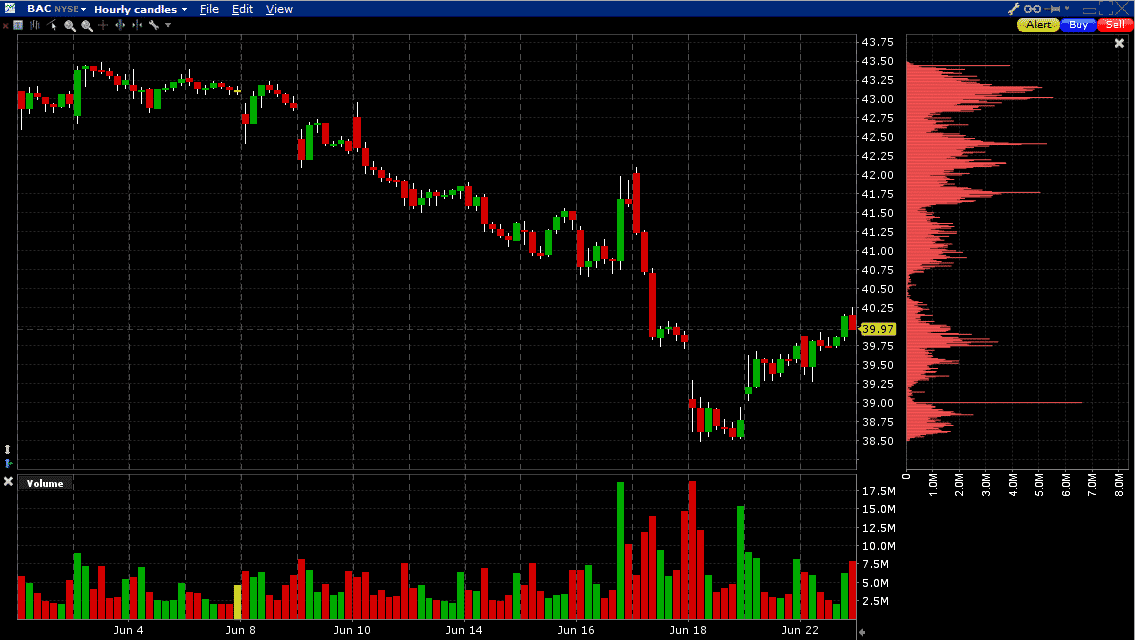
Here we have another example using BAC.
This time we see the point of control is above the current stock price.
If BAC does rally, the stock will likely have a hard time getting above the 41 – 42 area.
How To Add Volume Profile In How To Read Interactive Brokers Volume Profile
Unfortunately, it is not obvious how to add the volume profile to Interactive Brokers charts, but luckily, you’ve come to the right place.
Within the chart, go to View and then Volume Histogram.
See the image below for details.
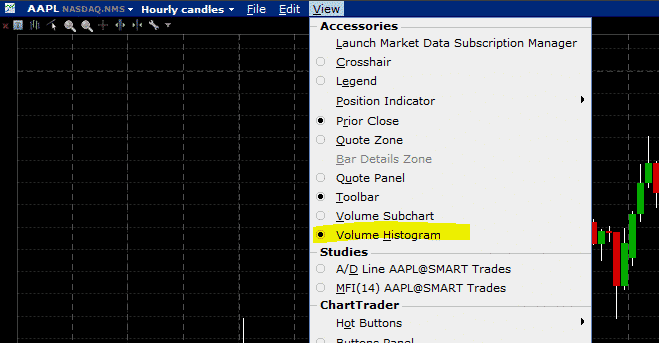
Toggle the radio button to on and you are good to go.
It may take a few seconds for the volume profile to populate, I guess there are some heavy calculations that need completing in the background.
One other thing to note is that it appears only possible to add the volume histogram to hourly charts and other short-term charts.
Daily charts do not seem to have it which is quote annoying.
FAQ
What Is The Interactive Brokers Volume Profile?
The Interactive Brokers Volume Profile is a tool that displays the volume traded at each price level for a given instrument over a specific time period.
It is a useful tool for traders to analyze the supply and demand of an instrument and identify potential areas of support and resistance.
How Do I Access The Interactive Brokers Volume Profile?
To access the Interactive Brokers Volume Profile, you need to have an account with Interactive Brokers and download the Trader Workstation (TWS) platform.
Once you have logged in to TWS, you can access the Volume Profile by selecting the chart type and choosing Volume Profile from the list of available options.
What Are Some Benefits Of Using The Interactive Brokers Volume Profile?
Some benefits of using the Interactive Brokers Volume Profile include:
(1) identifying potential areas of support and resistance,
(2) analyzing the strength of price movements,
(3) detecting market trends and reversals,
(4) making informed trading decisions based on supply and demand, and
(5) improving risk management by setting appropriate stop-loss and take-profit levels.
Can The Interactive Brokers Volume Profile Be Used For All Instruments?
The Interactive Brokers Volume Profile can be used for most instruments, including stocks, futures, options, and forex.
However, it may not be available for all instruments, and the data may be limited for less-liquid instruments.
Is The Interactive Brokers Volume Profile Suitable For Beginners?
The Interactive Brokers Volume Profile can be a useful tool for beginners to learn about supply and demand and identify potential areas of support and resistance.
However, it may require some basic knowledge of technical analysis and trading concepts.
It is recommended that beginners learn the basics of trading before using the Interactive Brokers Volume Profile.
Are There Any Limitations Of The Interactive Brokers Volume Profile?
Some limitations of the Interactive Brokers Volume Profile include:
(1) it may not be available for all instruments,
(2) the data may be limited for less-liquid instruments,
(3) it may require some basic knowledge of technical analysis and trading concepts, and
(4) it should not be used as the sole factor for making trading decisions.
Conclusion
There you have it.
Now you know how to add volume profile to Interactive Brokers charts and how to read it.
We hope it helps you in your trading.
Trade safe!
Disclaimer: The information above is for educational purposes only and should not be treated as investment advice. The strategy presented would not be suitable for investors who are not familiar with exchange traded options. Any readers interested in this strategy should do their own research and seek advice from a licensed financial adviser.


Thanks like you mentioned, not obvous at all to find!!
Yes, not obvious at all. At least you know now.
thank you great find
Should definitely be in studies.
Did you find out how to change the color? Thanks
No I didn’t. If you do, let me know.
Thank you. great find. If anyone ever finds a way to see this longer than 1 day please do let us know. So useful
Is volume profile available with API access so we can perform technical analysis with it programmatically ?
Possibly, but I’m not 100% sure. Just email the support desk and they will be able to help.
Can the volume profile for the ask side and for the bid side be viewed as either two separate volume profiles or as two bars on top of each other ? Also can we access the ask side volume profile , and the bid side volume profile, through the API calls to TWS ?
Not sure. I would suggest emailing the help desk. Their live support is not very good, but the email support usually gets back to you within a few hours.
I cannot find VOLUMN PROFILE under the view.
I can only see VOLUMN SUBCHART
Under View – Look for Volume Histogram.
On the screen : chart Settings / Chart Parameters, it does not appear enabled to select the “check”, (it is light gray)
I cannot find VOLUMN PROFILE under the view.
I can only see VOLUMN SUBCHART.
Looks like they have changed things. Try this:
Open IBKR desktop in live mode and add it to your chart and then sign out. Once you sign into TWS again, it should be available on the chart. Definitely very odd that they haven’t added it as an available indicator in TWS, but for some reason it becomes available if you set it as an indicator in IBKR desktop first. Hope that works for you.