


Today we’ll cover two technical analysis candlestick patterns: The Bullish and Bearish separating lines candlestick pattern.
Candlestick patterns help the traders to understand the price action.
Therefore, such patterns, when studied carefully in combination with other parameters, provide excellent trading opportunities.
One such pattern is separating lines.
So, let us understand two such patterns: bullish separating lines and bearish separating lines.
Contents
- What Are Bullish Separating Lines And Bearish Separating Lines?
- What Do They Mean?
- How To Trade Bullish and Bearish Separating Lines
- Conclusion
What Are Bullish Separating Lines And Bearish Separating Lines?
The Separating lines pattern is a two-candle pattern that indicates the continuation of the previous trend.
However, the candles formed in such a pattern move in opposite directions.
Let us see the two different separating lines.
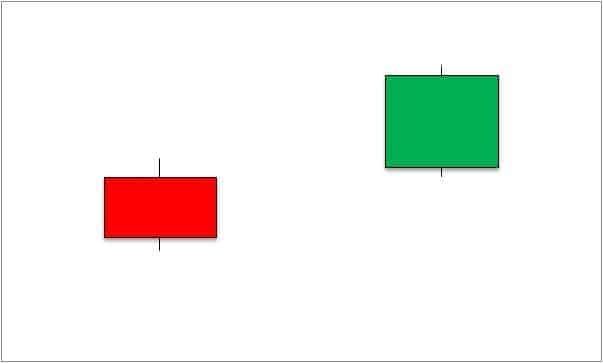
Bullish Separating Lines
The bullish separating lines pattern is formed during a bullish trend.
It signals the continuation of the prevailing bullish trend after a temporary correction.
The pattern is formed of two candles where the second bullish candle follows the first bearish candle.
The second candle opens above the body of the first bearish candle or near its open and closes higher than from where it opened.
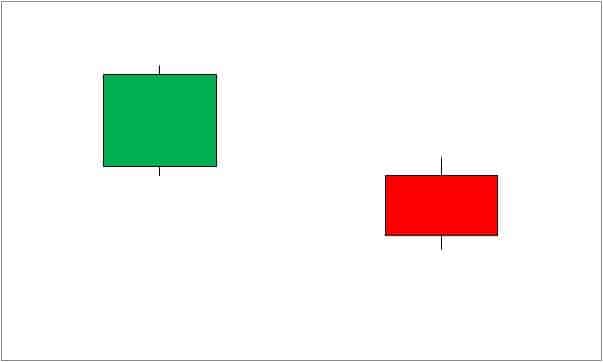
Bearish Separating Lines
The bearish separating lines pattern is formed during a bearish trend.
It signals the continuation of the prevailing bearish trend after a temporary pullback.
The pattern is formed of two candles where the second bearish candle follows the first bullish candle.
The second candle opens below the body of the first bullish candle or near its open and closes lower than from where it opened.
What Do They Mean?
Bullish Separating Lines
The bulls seem to be dominating the market.
But with a bearish candle formation in the middle of the uptrend, the bears try to take control.
The price falls considerably during the bears’ rule, but it seems to last short.
As a result, the price moves upwards on the second day after opening at the previous day’s open, and the bulls cherish the market recovery.
The two days’ action of the bears bringing the prices down and the bulls’ successful attempt for price recovery indicates the continuation of the uptrend.
The price shifts significantly from the close of the first day to the open of the second day.
Further, the bullish candle on the second day indicates the strength of the bulls even after a setback.
Hence, the uptrend is expected to continue.
The longer body candles make the pattern more reliable.
Bearish Separating Lines
The bears are in control, as reflected by the price downtrend.
However, the bulls attempt to overpower the bears by gaining control.
First, they try hard to bring the prices up, as evident by the formation of the bullish candle in the downtrend.
However, the power of the bulls seems to be short-lived.
The bears again seize control on the second day by opening the price near the previous day’s open.
Finally, they establish complete control by bringing the prices down on the second day, and thus, the price closes much below the open price.
The bears’ confidence is reinforced with the price’s paradigm shift from the first day close to the second day open.
Thus, they become successful in bringing the prices down on the second day.
With the two days’ action, it is pretty evident that the downtrend is expected to continue after the temporary pullback.
How To Trade Bullish And Bearish Separating Lines
Bullish Separating Lines
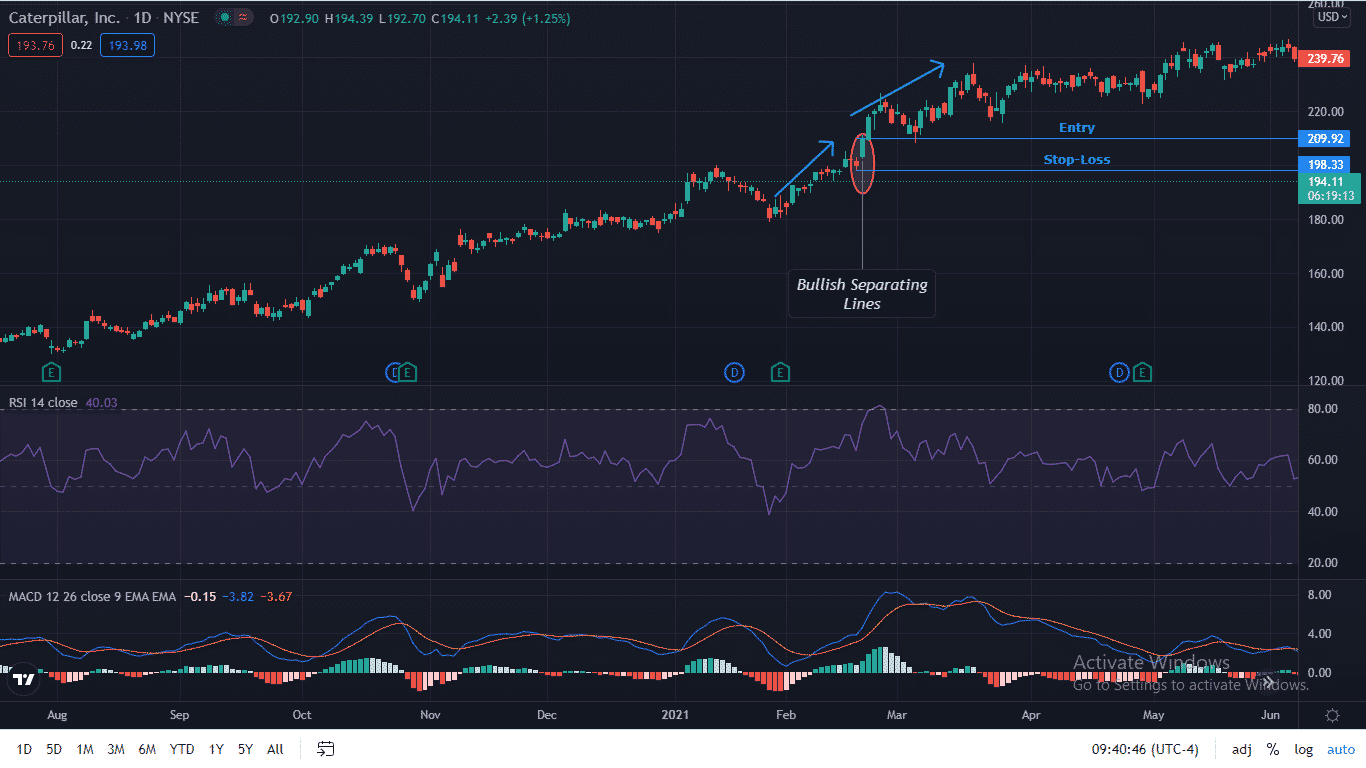
Let’s take an example to understand how you can trade such bullish separating lines.
The chart below is of Caterpillar, Inc. (CAT) on a daily timeframe.
You can see that the stock was in an uptrend in the month of Februray’2021.
The bullish separating lines pattern was formed on February 18th and 19th.
The price on Feb’ 19th opened near the previous day open at around $203, and it rallied upwards during the day.
The formation of such bullish separating lines establishes the bulls’ control.
Thus, one can go long at around $210, which is the close of the second day.
The stop-loss can be placed at the low of the first day at around $198.
You can see that the price rallied after that to $246.69 within few months.
Bearish Separating Lines
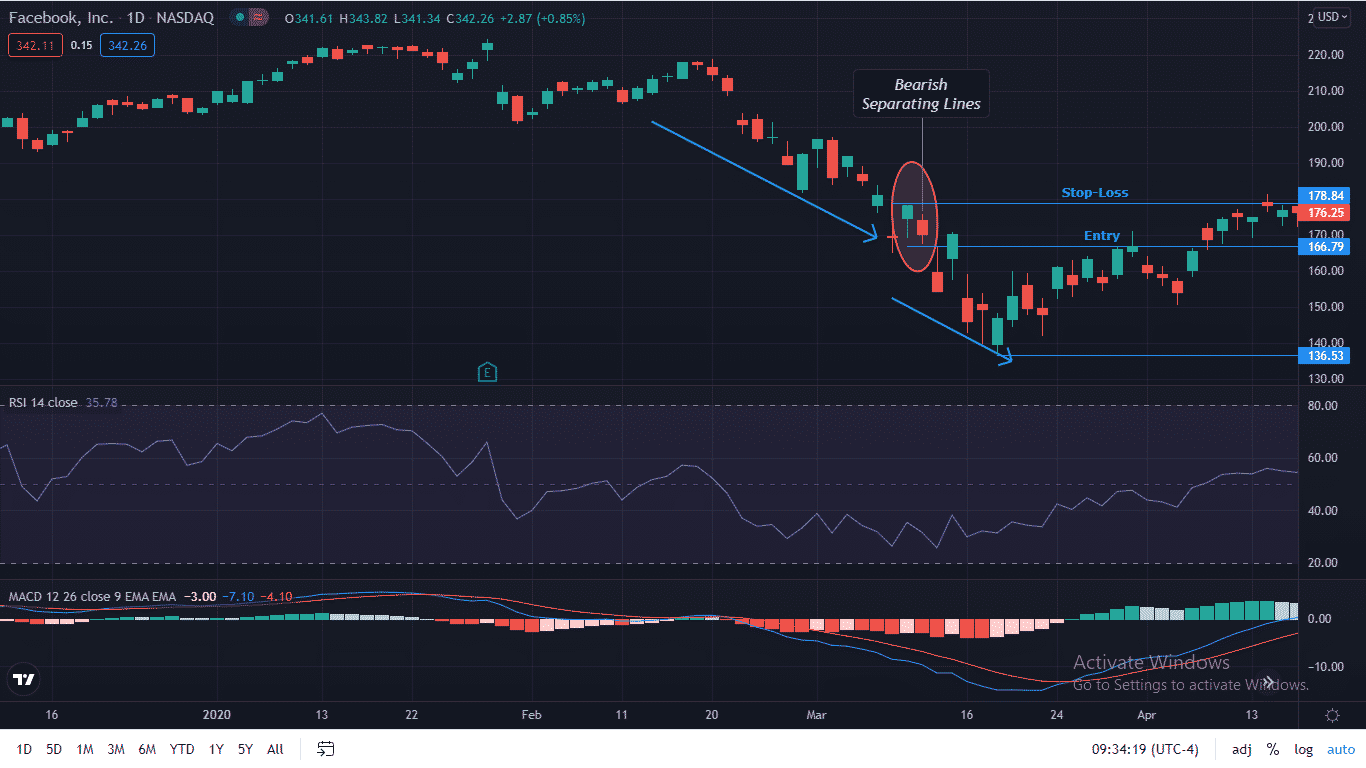
The chart below is of Facebook, Inc. (FB) on a daily timeframe.
The stock was in a downtrend from February’2020.
The bearish separating lines pattern was formed on March 10th & 11th‘2020.
One can go short on the stock below the second day’s low, i.e., $167.
The stop-loss can be the high of the first day at around $179.
The price retests the second day low on March 13th, 2020 and continues falling from there.
It touches a low of $136 within a few days.
Conclusion
The bullish and bearish separating lines pattern confirms the trend continuation and helps the traders trade in line with the trend.
Thus, the pattern establishes the price trend and provides an excellent trading opportunity.
We hope you enjoyed this article on the separating lines candlestick pattern. If you have any questions please send us an email or leave a comment below.
Trade safe!
Disclaimer: The information above is for educational purposes only and should not be treated as investment advice. The strategy presented would not be suitable for investors who are not familiar with exchange traded options. Any readers interested in this strategy should do their own research and seek advice from a licensed financial adviser.


