

Today’s Ninja Spread review will show you everything you need to know about this very nice piece of software.
NinjaSpread is a scanner tool to find spreads of interest.
All you need to run it is a web browser and internet connection.
If you are not into trying to scroll large rows of data on a mobile phone, it is better to use it on a larger desktop monitor due to its large data tables.
Contents
Introduction
The first time you come to the scanner, you will see a Tips Wizard explaining what is to be inputted into each field.
It is easy to say, “Yeah, I don’t have time to go through this.
I think I know what each of these things means.”
But I would encourage you not to dismiss the Tips Wizard and spend just a couple of minutes reading it. It clarifies a lot of things.
For example, if you are looking for backwardation in calendars, the Tip Wizard will explain what the values for “skew” mean:
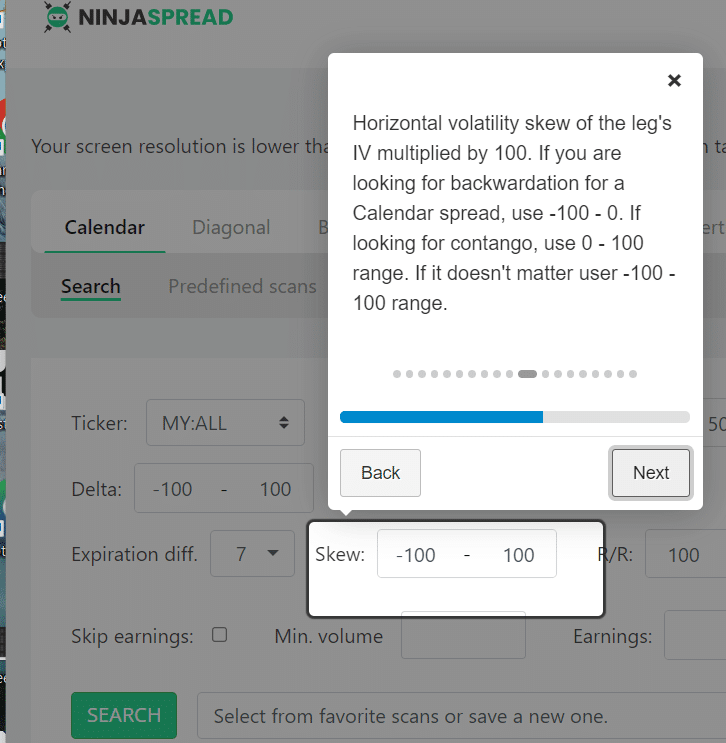
One of the fields is marked as “R/R”.
Is that a reward-to-risk ratio? Or is that risk-to-reward?
Well, the tip would have told you it is reward-to-risk.
The creator of NinjaSpread made a video on how to use NinjaSpread.
Even though the video is an hour and 40 minutes long, he goes over things rather quickly and assumes that the viewer is already familiar with the various strategies.
This is because this software has so many things to cover.
He did say something interesting in the video that I have to quote it here:
“The maximum profit of a butterfly is never achievable. But the maximum risk is. So keep that in mind.”
This is so very true. Many people don’t tend to realize this when looking at the reward-to-risk.
They see they can make ten times their risk and then get excited about it.
This is only in theory. It’s not the case in reality.
Calendar Example
Let’s look at an example of finding a calendar trade for the ticker symbol QCOM (Qual Comm).
The “Tg%” is the target percentage or how close the calendar strike is to the market’s current price.
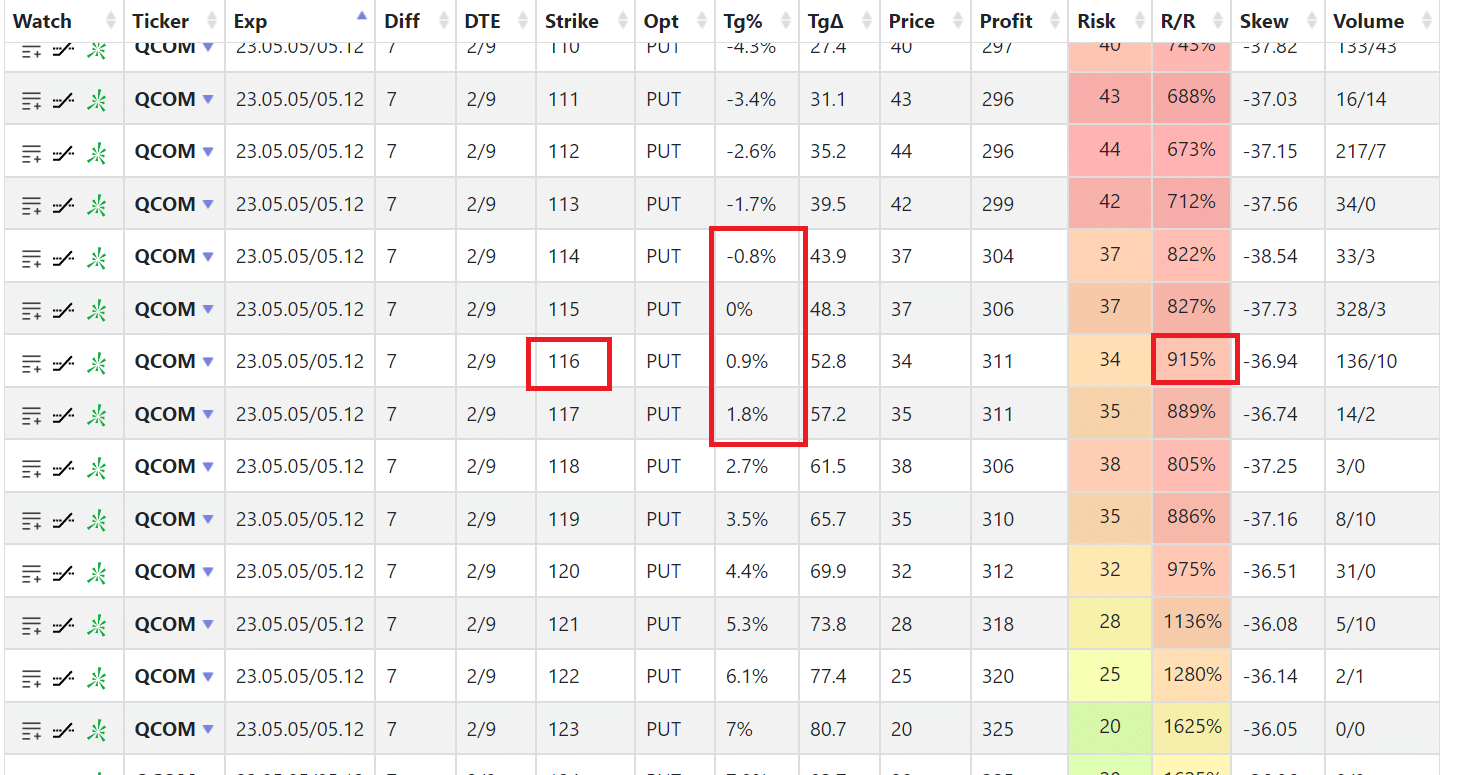
We want the calendar to be at the moment.
That is why we picked the 116 strike for the calendar where the “Tg%” is closest to zero.
The DTE column shows “2/9,” meaning there are two days till the expiration of the short option and nine days till the expiration of the long option.
The difference is seven, which is why this is a 7-day spread.
Note that we have a reward-to-risk of 915%.
What if we used longer-term calendars?
Suppose we want our short option to expire in 9 days and the long option to expire in 16 days.
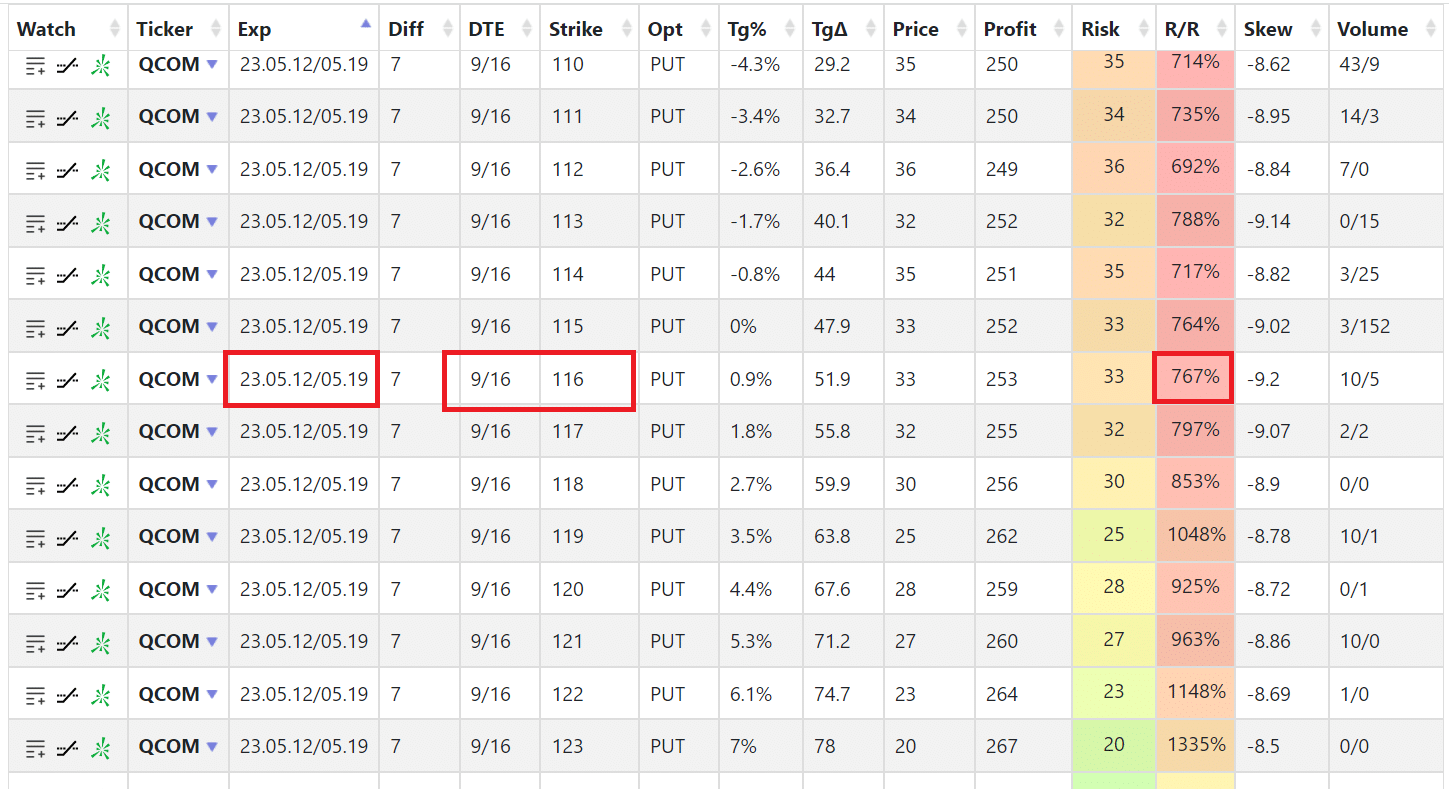
Then, we see that the reward-to-risk is lower at 767%.
By playing around with the various settings in Ninja Spread, you will start to learn the characteristics of calendars.
If you increase the DTE range, you get multiple checkboxes in the expiration differences…
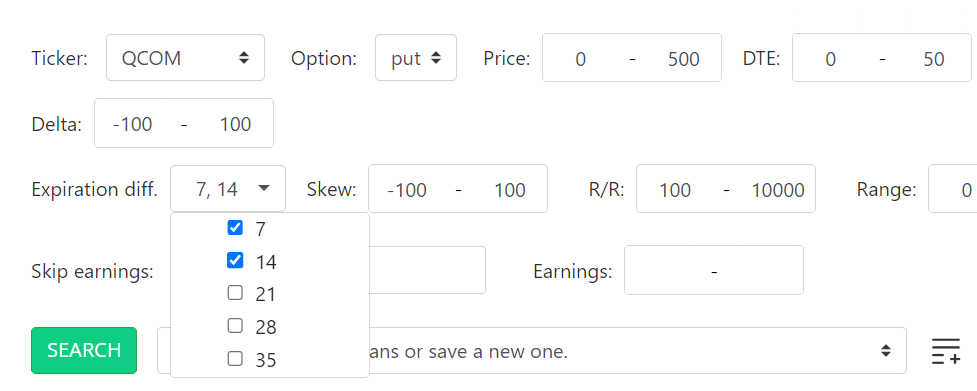
You will see that increasing the time difference between the short option and the long option decreases the reward-to-risk. Here is a 14-day spread:
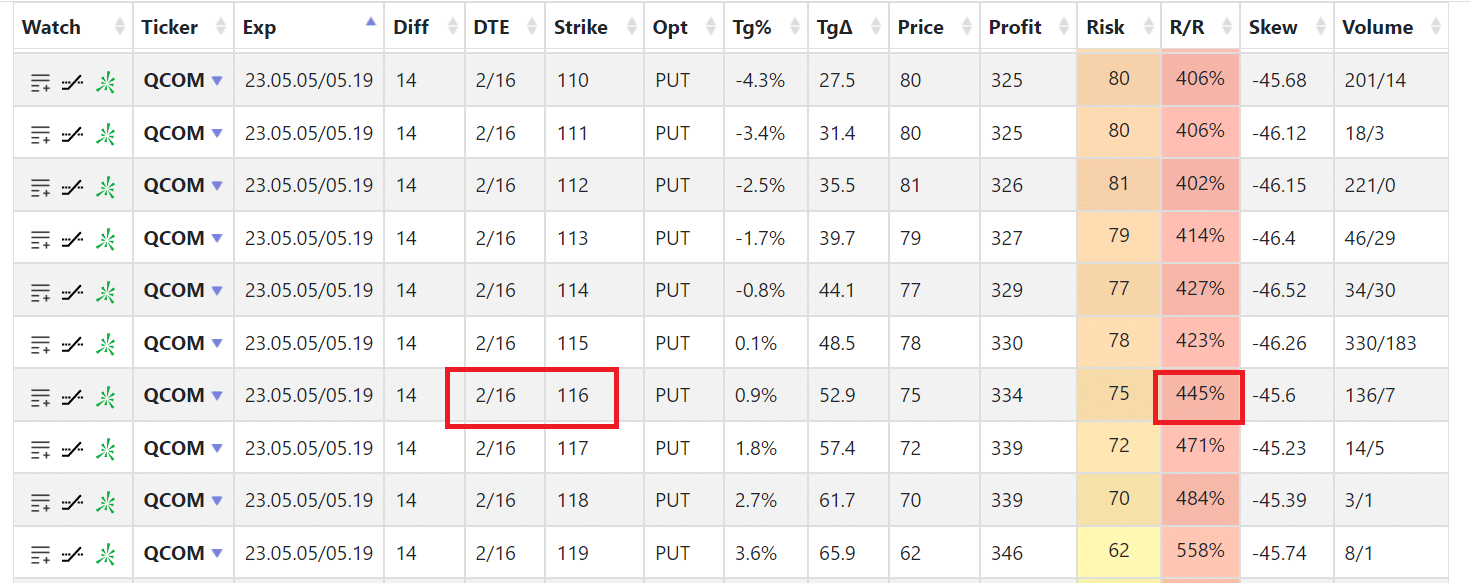
So narrow-spread calendars appear to have a better reward to risk.
What exactly does reward-to-risk mean? It means if you have a calendar like this:
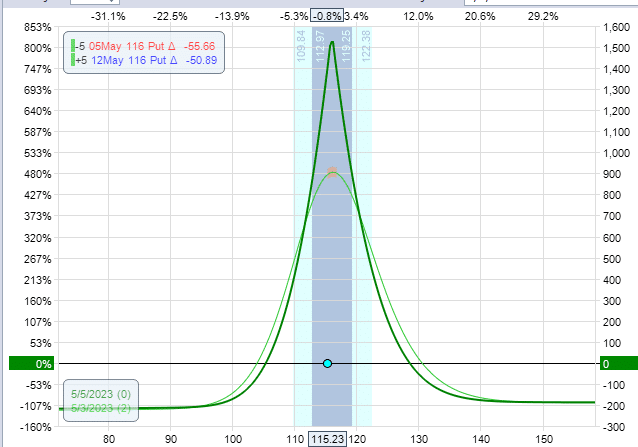
You take the max potential reward (in this case $1500) divided by the risk in the trade (in this case $200).
You get 7.5, which is 750% when converted to percentages.
Bull Put Spread
Let’s say we are looking for a bull put credit spread on SPY where the short put is at the ten delta to 25 delta with 30 to 60 days to expiration.
We would select “Vertical” from the menu and enter the query as shown.

The strategy is bullish, so we specify the position delta to be positive.
Since we are receiving a credit to place this trade, we specify a “-500 to 0” as the price to indicate that we want a bull put spread to give us a credit anywhere from 0 to $500.
If we had a debit strategy, we would put in a positive number for price.
The other fields are not as important for this query.
So we can leave with wide values to not limit our results.
Here, we get some bull put spreads grouped by expiration:
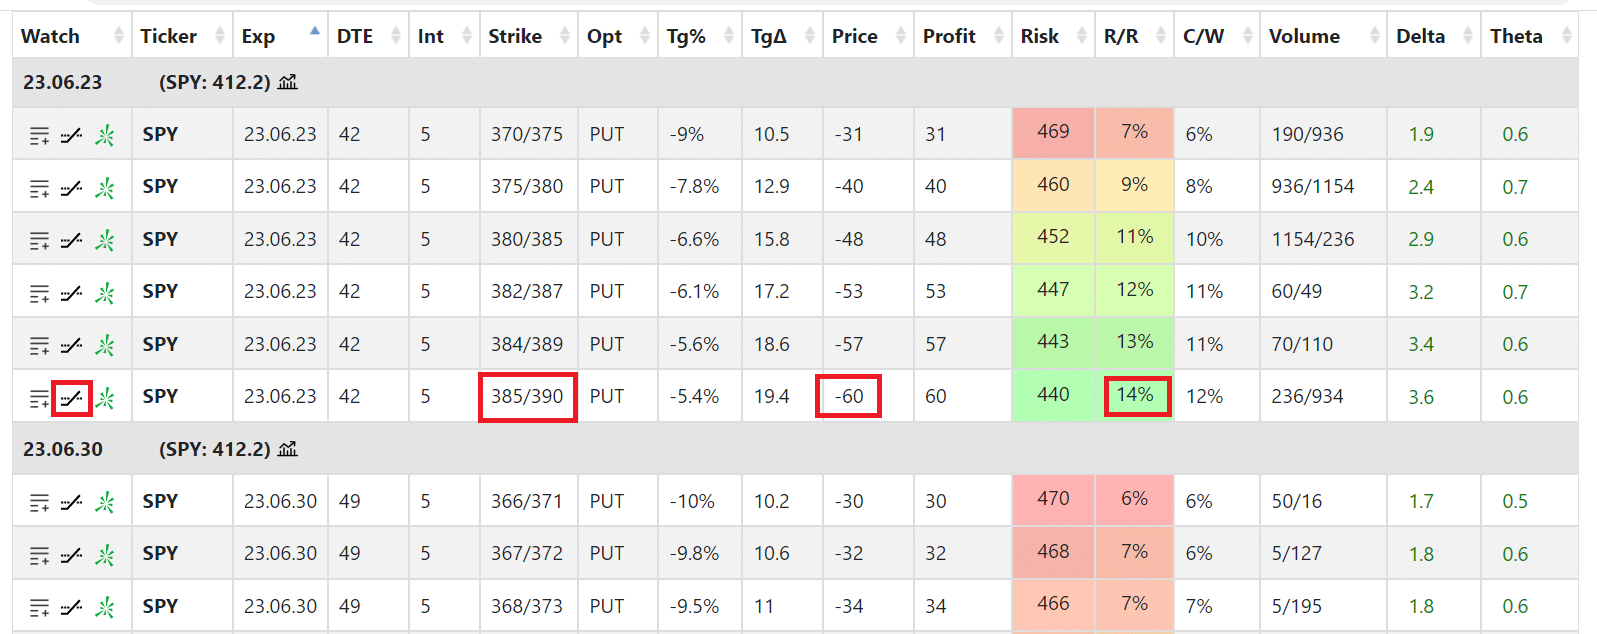
I’m particularly interested in the 385/390 bull put expiring June 23 because it gives a decent credit of $60.
My risk on this 5-point wide spread is $440.
So my reward-to-risk would be $60/$440, or 14%, as shown.
Each result column can be sorted in ascending or descending order.
You can remove or add columns by clicking on the column links:

Clicking the chart icon will show the payoff graph:
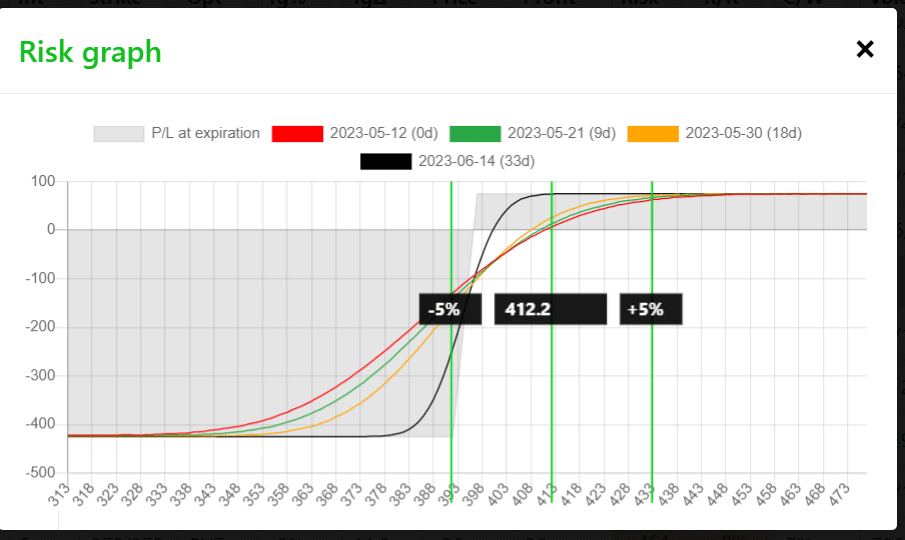
The current SPY price is at 412.
There is even a chart icon that brings up a candlestick chart of SPY:
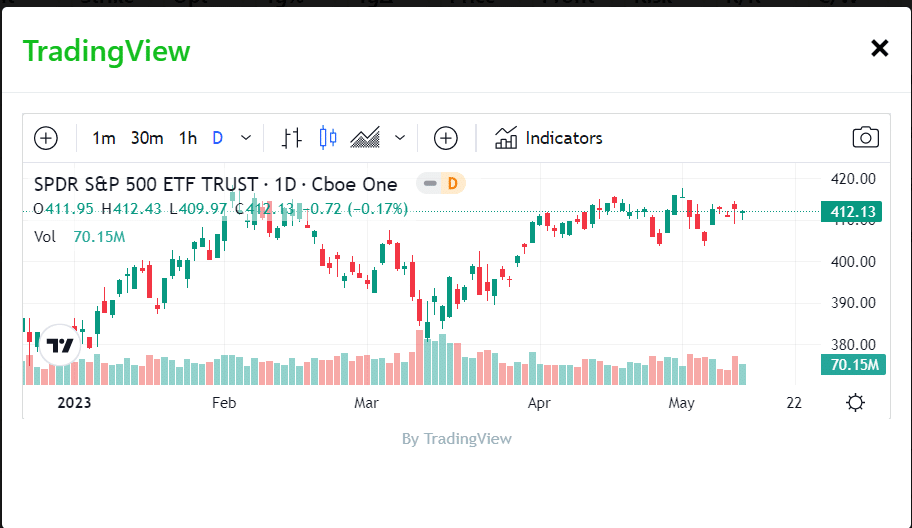
It is a miniature embedded version of a TradingView chart.
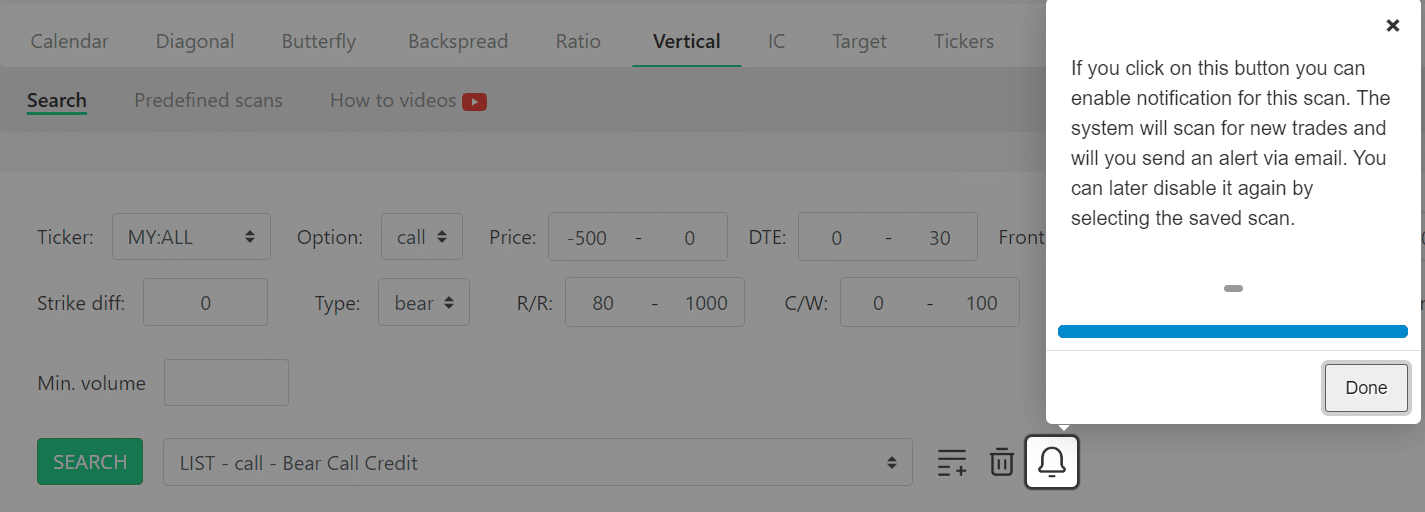
You can save this scan and then have NinjaSpread notify you by email if new trades show up in this scan.
Iron Condor
In this next example, I am looking for an iron condor with short legs out-of-the-money at the 10 to 20 delta for all stocks in the NinjaSpread database.

Note that Ninja Spread does not have data for all possible tickers.
However, it will not be a problem for all the more well-known tickers.
We check-marked “skip earnings” because we don’t want our iron condor to span any earnings dates.
Note that we say that we want the spread width to be either 5 points or 10 points wide by entering it as comma-separated values in the “Strike diff” field.
In the results, we click “Chart View” to show our results in this format.
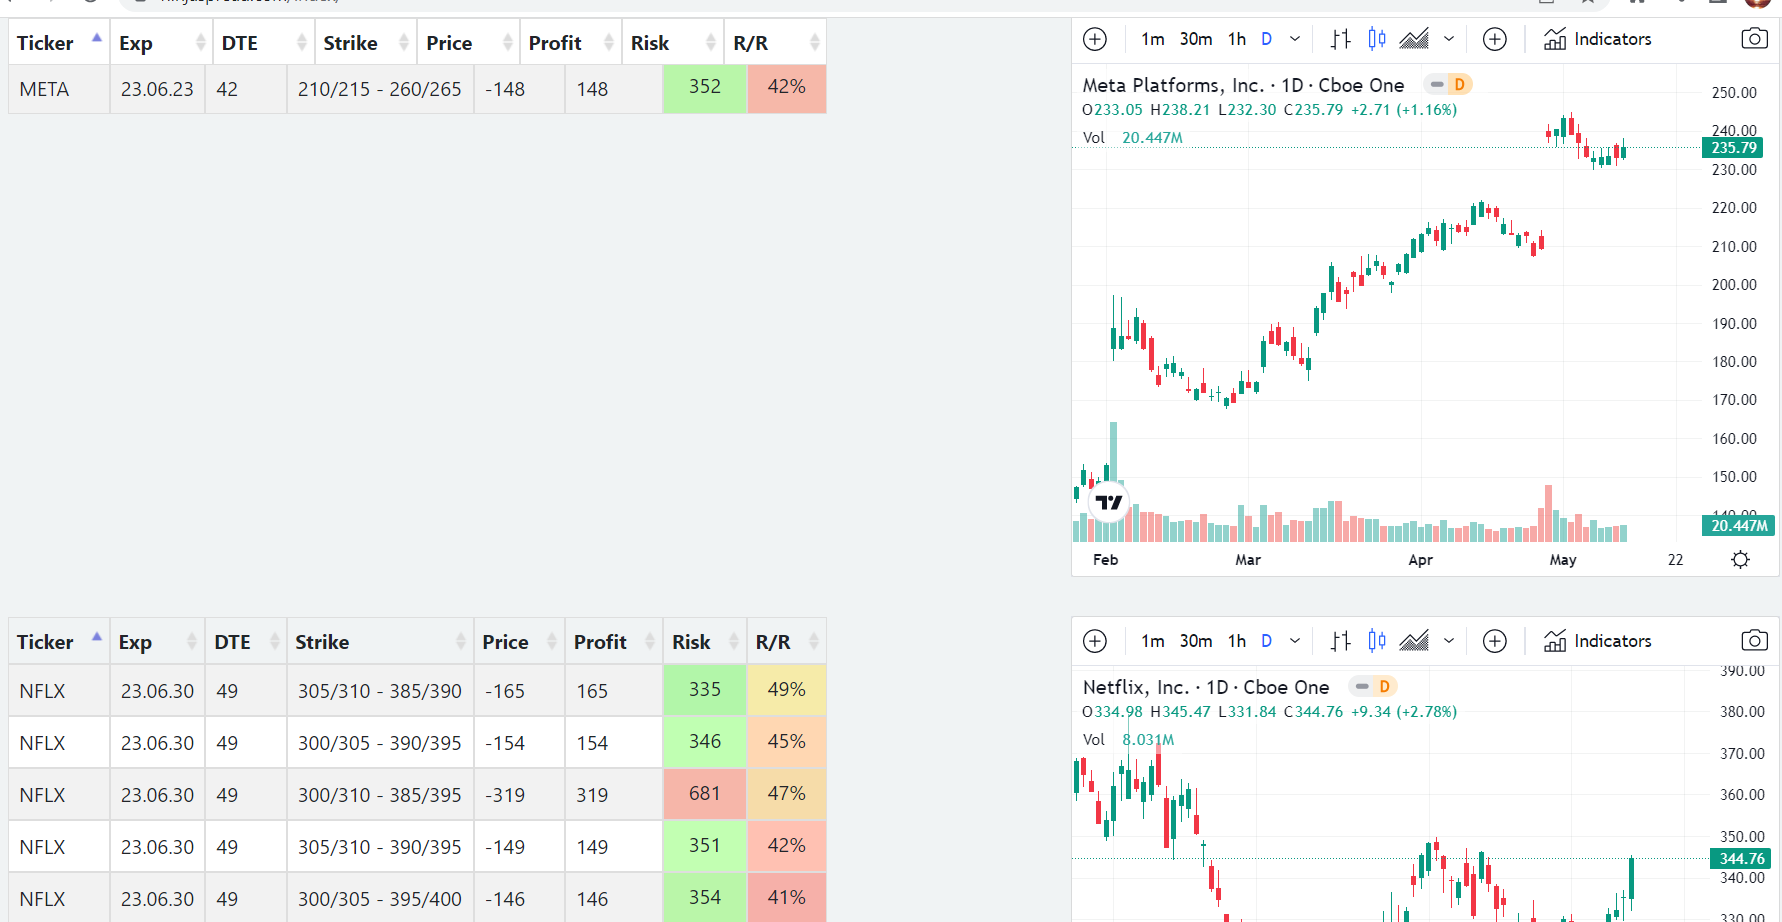
We can scroll through the charts looking for the ones that look range-bound where we might want to enter into an iron condor.
Earning Stats
If you go to the menu Tickers and Earnings Stats, it will show you stocks with upcoming earnings in the next 14 days:
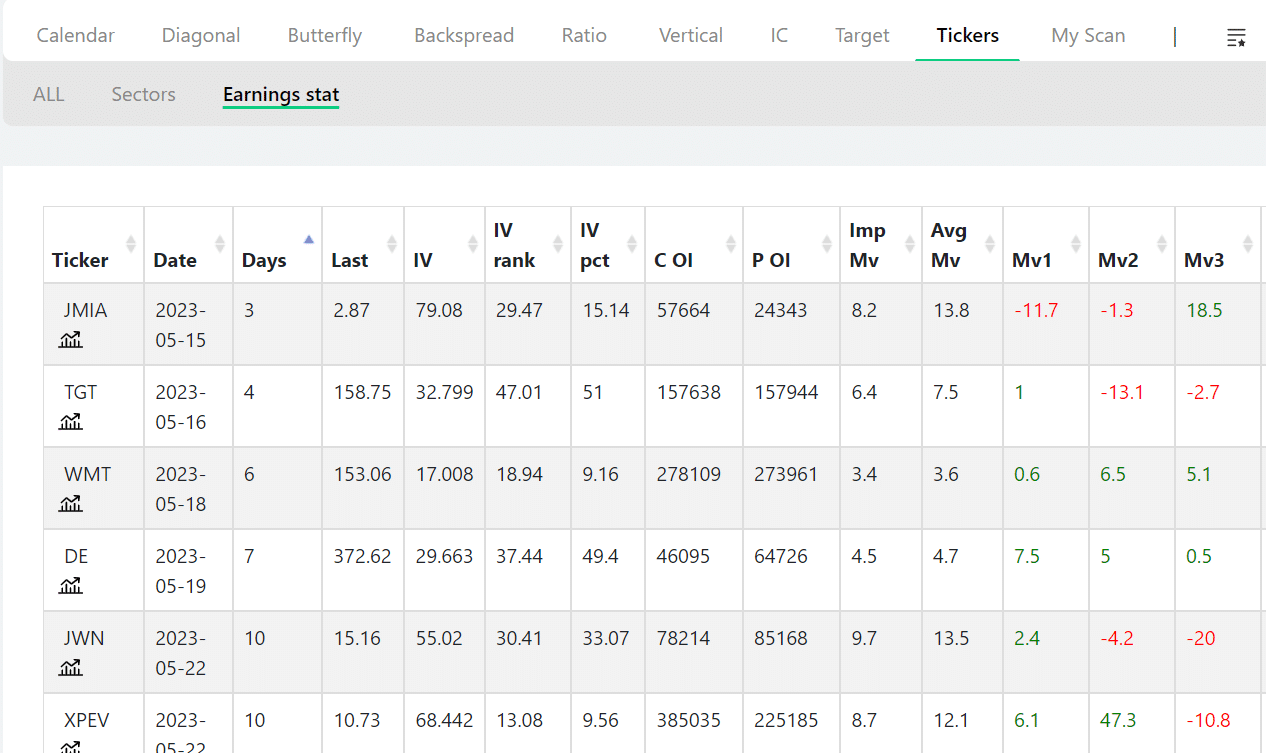
Here, we see that Walmart (WMT) has earnings coming up in 6 days.
The implied move is expected to be 3.4%.
The average move on earnings based on the last 12 earnings is 3.6%
In previous earnings didn’t move much, only up 0.6%.
However, the earnings before that one moved a big 6.5%. We see that in the previous three earnings, it went up.
The table also shows IV (implied volatility) for those traders who want to sell high IV during earnings.
Other Scans
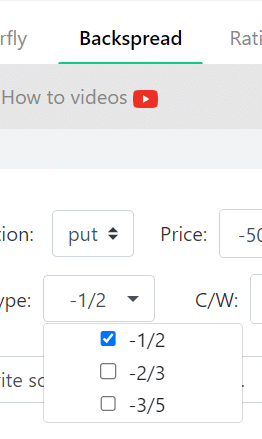
You can look for backspreads where you are selling one option and buying two options:
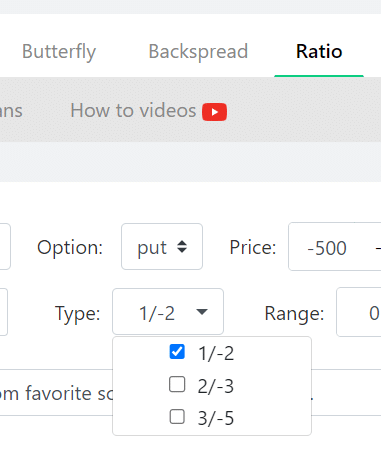
Or ratio spreads, where you are buying one and selling two:
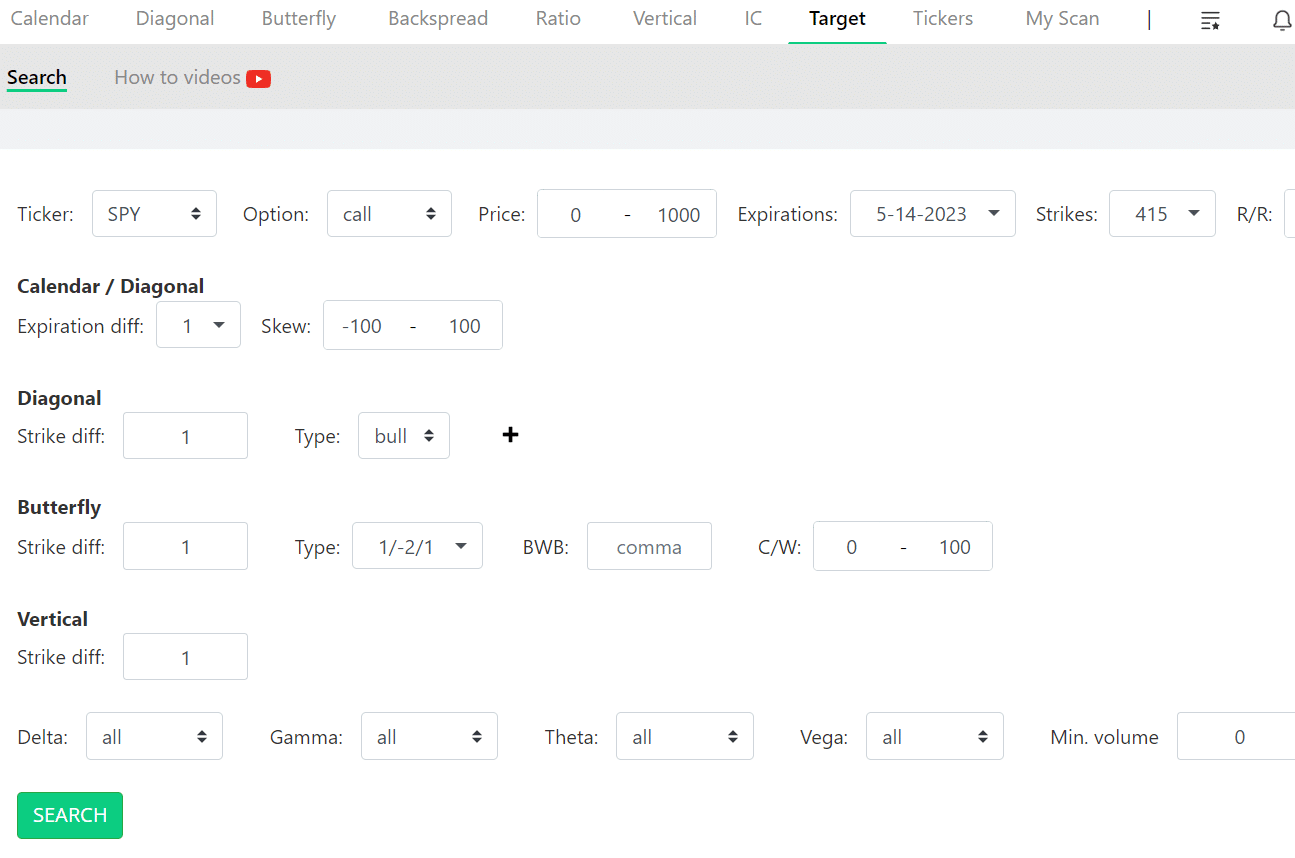
Suppose we think SPY will go to $415 in three days.
Shall we do a calendar, butterfly, or vertical?
Run the “Target” scan.
NinjaSpread will show you the metrics for the different strategies:
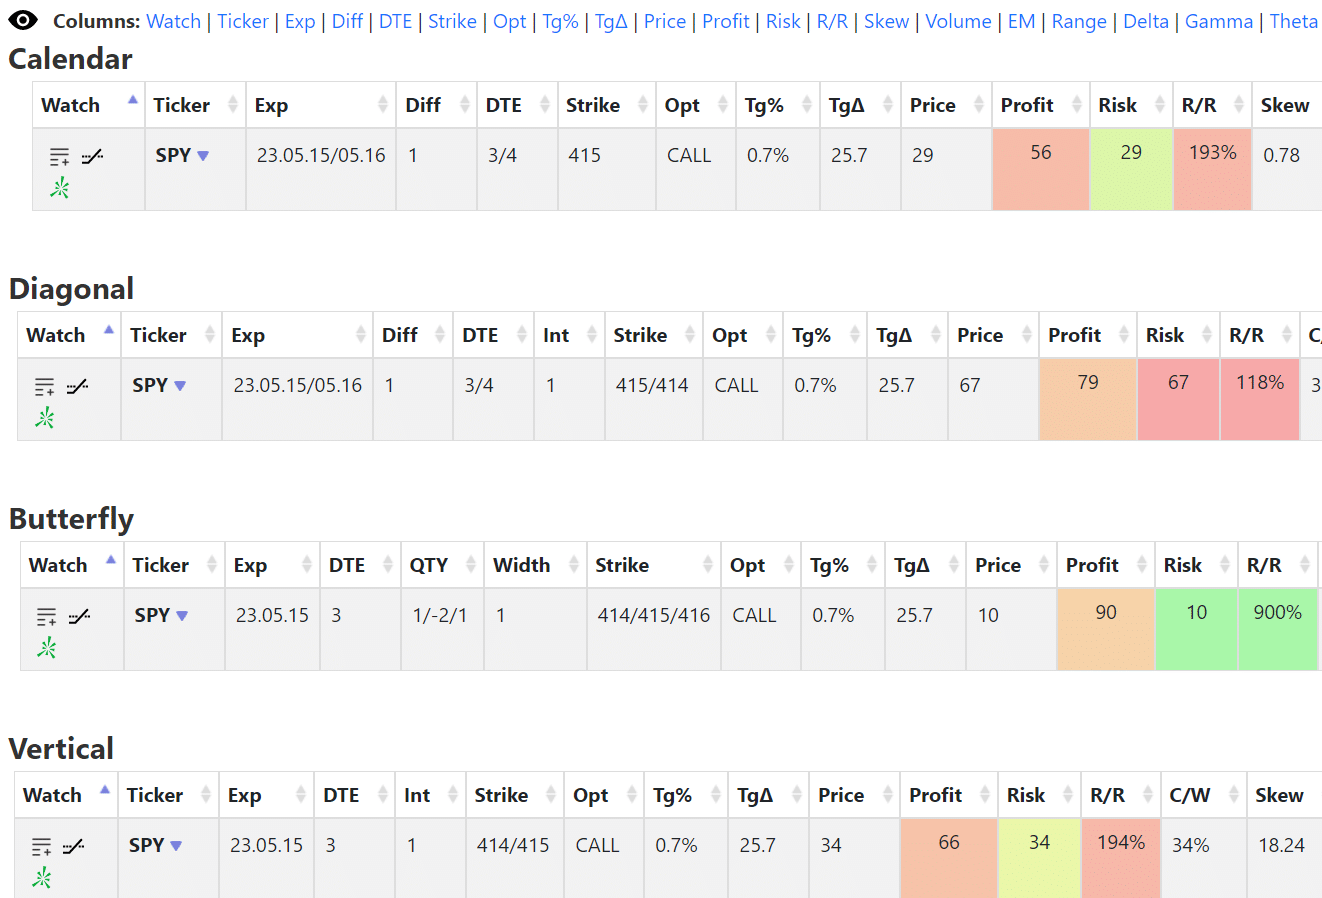
Looks like the butterfly has the best reward-to-risk ratio, with the possibility of winning $90 by risking only $10.
Relative Value
You can find cheap calendars for SPY, SPX, QQQ, and IWM by check-marking the “Historical RV” box:
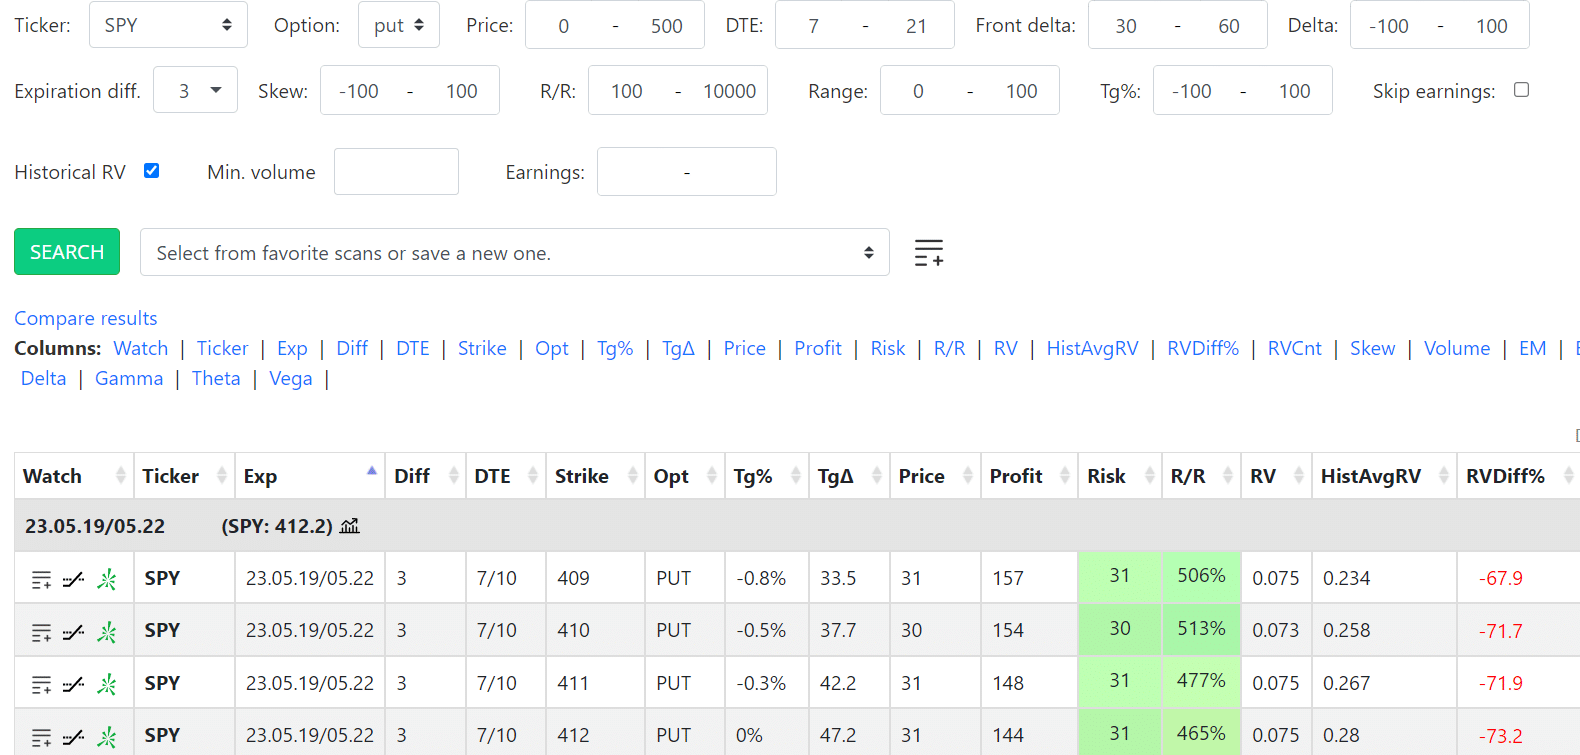
The results will display the “RV” value of the calendar.
RV is a relative value, which is the cost of the calendar divided by the asset price.
The lower the number, the lower the cost of the calendar relative to the underlying asset price.
It also shows you the “historical average RV” of a calendar of that type since 2019.
The first row in the above results shows that this calendar has an RV value of 0.075 when the average RV value is 0.234.
Therefore, this calendar is 68% cheaper than the average.
It might be a good deal to buy, and maybe that’s why it has such a high reward to risk of 5 times.
Frequently Asked Questions
Can I export the result to Excel?
Yes, or you can export it to CSV (comma-separated value) format.
Can I send a spread that I like to my broker?
Yes and no.
If you enable Tradier connectivity, you can click a link, and NinjaSpread will send the selected spread as an order to your Tradier account.
It only populates the order so that you don’t have to waste time typing it in manually.
NinjaSpread will not submit the order for you because it does not control your Tradier account.
For ThinkOrSwim users, you might have noticed the ToS icon. It copies the spread to your clipboard, which you can paste as an order in your ThinkOrSwim platform.
Can NinjaSpread scan for 0 DTE options?
As of the time of this writing in November 2023, it can only scan for 0 DTE SPX butterflies…
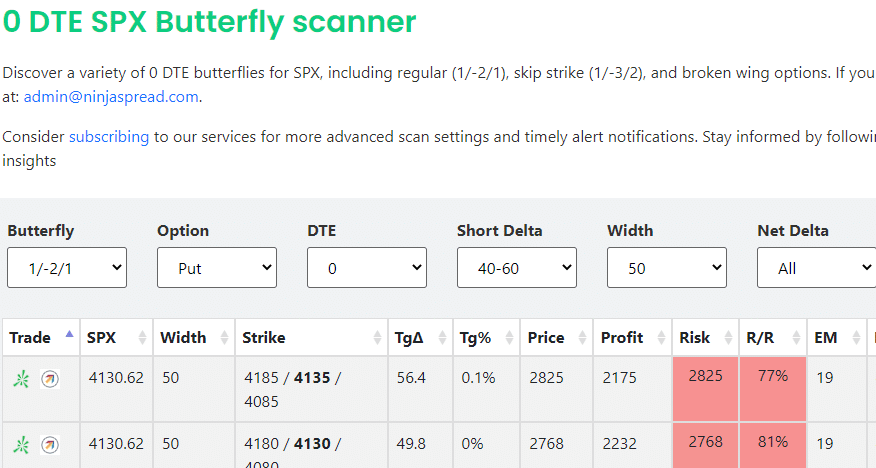
New features might still be added.
Conclusion
Because NinjaSpread is so extensive, this article showed only some of the scans that are possible.
They have a 14-day free trial that has full functionality.
But it will start charging after the free trial is over.
If you don’t want to enter payment information for the free trial, a demo login is available, which provides limited functionality with seven days old data.
If you are looking for a specific need, there is an email where you can always send them questions.
We hope you enjoyed this ninja spread review.
If you have any questions, please send an email or leave a comment below.
Trade safe!
Disclaimer: The information above is for educational purposes only and should not be treated as investment advice. The strategy presented would not be suitable for investors who are not familiar with exchange traded options. Any readers interested in this strategy should do their own research and seek advice from a licensed financial adviser.


