


It is impossible to predict where the market is going to go or when it is going to go there, so as a result, traders rely heavily on probabilities and statistics in planning their trades.
There is no place in trading that this is more accurate than in options trading.
In addition to the usual problems of getting the timing and direction correct on a trade, options traders have the added variables of theta decay and Delta to determine if their trade will be profitable.
These make being able to identify the probability of an options trade vital to long-term success in the options markets.
Here, we will go over a few ways to help identify and trade high-probability options trades and help tilt the odds of profit more in your favor.
Contents
Don’t Fight the Trend
One of the simplest ways to keep the probability of profit high is to keep in line with the current trend.
The trend can differ depending on the timeframe, but being aware of the overall direction of the stock you trade will help keep you in the black.
A great way to help keep you on the right side of the trend is a moving average or multiple moving averages.
Looking to trade long when stocks are above their moving averages and short when they are below can help to increase the odds of an options trade ending in profit.
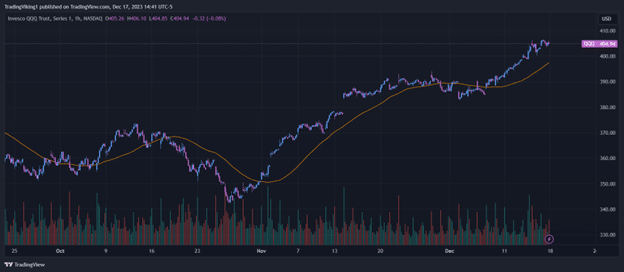
As an example, check out this chart of QQQ below. Longs were the best trade around on this hourly chart once the price closed above the 50-period simple moving average.
While you still need a sound entry and exit plan, trading in the direction of the moving averages is one of the simplest ways to help find high-probability options trades.
Analyze Support and Resistance
If trend trading isn’t your preferred trading style, support, and resistance levels can be a great way to help find high-probability locations for trades.
Some common ways to find support and resistance locations are the following:
- Pivot Points – Indicators such as Camarilla Pivots provide predetermined points where the market may react. These are usually set with a predetermined formula.
- Volume Profile Points – Either High or Low-volume areas can provide some spots where the market can reverse and provide you with a high probability trade
- Double Tops/Bottoms – Double Tops/Bottoms can be a great and simple way to find areas with a high probability of reversing.
Whatever method you use, learning to analyze support and resistance levels on a stock chart is a great way to put the odds of a trade in your favor.
Technical Analysis/Price Patterns
When practiced and studied, Technical analysis can be an excellent way to find high-probability-options trades.
There are several techniques traders can use to put an edge in their trading.
Moving Average Crossover
Perhaps one of the most basic technical setups, this article would not be complete without mentioning it.
The premise of this setup is simple: you wait for a short time frame moving average to cross over a long time frame moving average to look for a signal.
This setup can work in both directions, but it’s most powerful when the stock comes from a pullback.
The entry criteria are up for debate, with some traders entering when the actual cross happens and others waiting for the price to come back and test one of the moving averages.
Testing what works best for your trading style is recommended since both entry criteria can be profitable.
Bollinger Band Walk
A less common way to identify high-probability options trades is through the Bollinger Bands.
We aren’t talking about the usual reversal trading method here, but with a strategy that looks at buying/selling momentum, called the Bollinger Band Walk.
This method is also quite simple; it looks for a stock that routinely trades through the upper or lower band, pushing it higher or lower.
This is often indicative of an asset showing continued momentum in one direction.
The entry occurs on a pullback to the band’s midline or the opposite side.
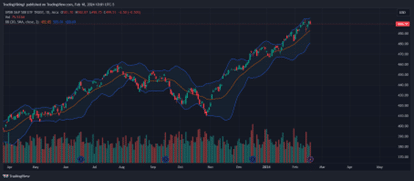
Look at the SPY chart here as an example; in both the uptrends and the down trends, you can see the corresponding bands moving in the direction of the trend.
The SPY then gave several pullbacks to the midline or opposite band from which to enter.
These allow you to keep stops tight and give you maximum room to run.
RSI/MACD
The RSI and MACD can help stack the trading odds in your favor.
Neither one of them produces very reliable signals, but when combined with other factors like the ones mentioned above, they can help keep you on the right side of the trade.
For the MACD, look for the trigger line to cross the moving average line in the direction of the trade to confirm the trend with your overall system.
The RSI is a bit more complicated because it can be used in several ways.
First is the standard overbought/oversold method.
This can work well depending on how the rest of your trading system works.
The other method is to view a consistent reading over 70 or under 30 as a sign of momentum.
When matched with one of the methods above to show the trend or your system, this can be a great confirmation that you are trading a high-probability setup in a stock.
Implied Volatility
Finally, there is the implied volatility in your options. Implied volatility will seldom be a reason to enter a trade, but it is vital to pay attention to it to help keep you profitable.
When entering an option trade, look to enter on a strike with low implied volatility if you are buying and higher implied volatility if you are selling.
This will be relative to the stock you are trading, but by doing this, you keep a higher probability of the option working in your favor.
Use Spreads Wisely
Another way to identify and execute high-probability options trades is by using spreads.
There are three main types of spread trades: Horizontal, Vertical, and Diagonal.
Horizontal Spreads
Horizontal spreads are typically calendar spreads; they are used to span over a time horizon decided by the trader and benefit from either increased short-term volatility (Reverse Calendar Spread) or decreased short-term volatility (Calendar Spread).
These Spreads are mostly about Implied Volatility and Theta but often have high margin requirements.
When used correctly, though, they can be a pretty powerful way to trade time in a covered manner.
Vertical Spreads
Next up are Vertical Spreads, which are perhaps the most well-known of the spread types.
These produce many high probability options trades when they are sold and put theta decay on your side.
These trades also have a directional nature, making them so powerful.
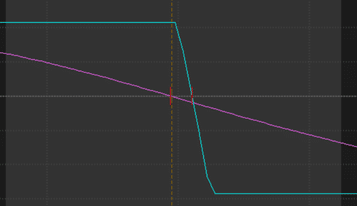
An example is the call credit spread profile to the right here.
You only need to be right because the underlying can’t trade lower/higher than your strike prices; otherwise, you can let time decay work in your favor.
Diagonal Spreads
Diagonal spreads have the potential to combine the best parts of horizontal and vertical spreads.
They can help a trader stay on the right side of time decay and give them a small profit boost from picking the correct direction.
This makes them a powerful tool when combined with the other techniques discussed in finding and executing high-probability options trades.
Wrapping It Up
Success in options trading is often determined by how well you can identify high-probability trades.
Relying on strategies that align with the market trend can help keep you on the right side of the trade.
Additionally, using support/resistance levels and indicators such as moving averages, Bollinger Bands, RSI, and MACD can throw the probabilities further in your favor.
Finally, understanding implied volatility and implementing spread strategies such as verticals can further improve the likelihood of profitable outcomes.
Mastering these techniques can offer traders a better chance at using the options market with confidence and success.
We hope you enjoyed this article on how to identify high probability option trades.
If you have any questions, please send an email or leave a comment below.
Trade safe!
Disclaimer: The information above is for educational purposes only and should not be treated as investment advice. The strategy presented would not be suitable for investors who are not familiar with exchange traded options. Any readers interested in this strategy should do their own research and seek advice from a licensed financial adviser.


