


Contents
What does that mean?
A few definitions are in order here.
The VIX, or the CBOE Volatility Index, is a popular measure of market expectations of near-term volatility conveyed by S&P 500 stock index option prices.
VIX is generally mean-reverting, which means it tends to revert to its historical average over time.
While the VIX can experience high and low volatility periods, extreme levels are often followed by a return to more moderate levels.
Traders know this and use mean-reversion as a basis for trading strategies.
For example, they may take positions based on the expectation that if the VIX reaches extreme levels, it will likely revert to its historical average, providing potential profit opportunities.
If one looks at a historical chart of the VIX over the years 2022 and 2023, one can get a sense of the range.
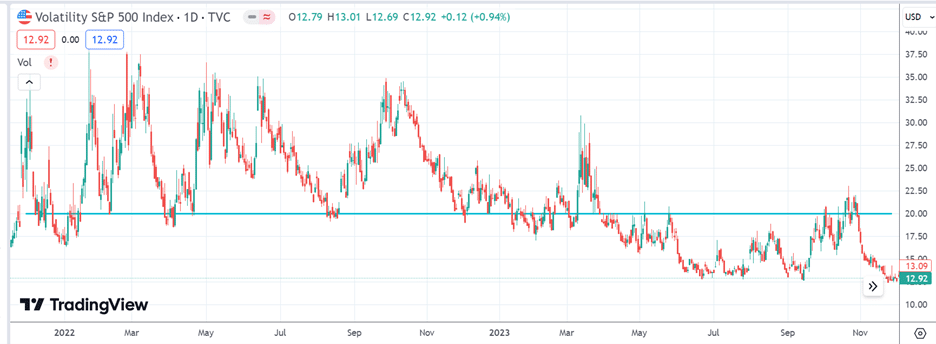
We see that VIX under 20 is on the low end of the range, which I have marked off with a teal horizontal line.
Don’t you love that TradingView lets you draw things on its chart?
I even picked the color of the line.
If a trader sees the VIX under 20, there may be an expectation that it will rise to its normal range in the near future.
The graph shows that this rise in VIX is not a slow, gradual rise.
It is like it jumps straight up.
That’s why we call it a VIX pop.
Sadly, VIX is not like stock.
VIX is an index.
The trader cannot buy shares of the VIX as he might buy shares of stocks and then sell at a higher price.
Sure, some ETFs are based on the VIX and can be purchased like stocks.
But, for today, we will use an option structure known as a vertical spread to try to profit from a rise in the VIX.
While you cannot buy shares of the VIX, you can sell and buy put options and call options on the VIX.
The formal definition of a vertical spread is an options structure that involves buying and selling options of the same type (either both call options or put options) on the same underlying security with the same expiration date but at different strike prices.
In this example, our underlying security is the VIX.
Let’s pick a date where the VIX is below 20 (say January 26, 2023) and look at the option chain for the VIX on that day in OptionNet Explorer.
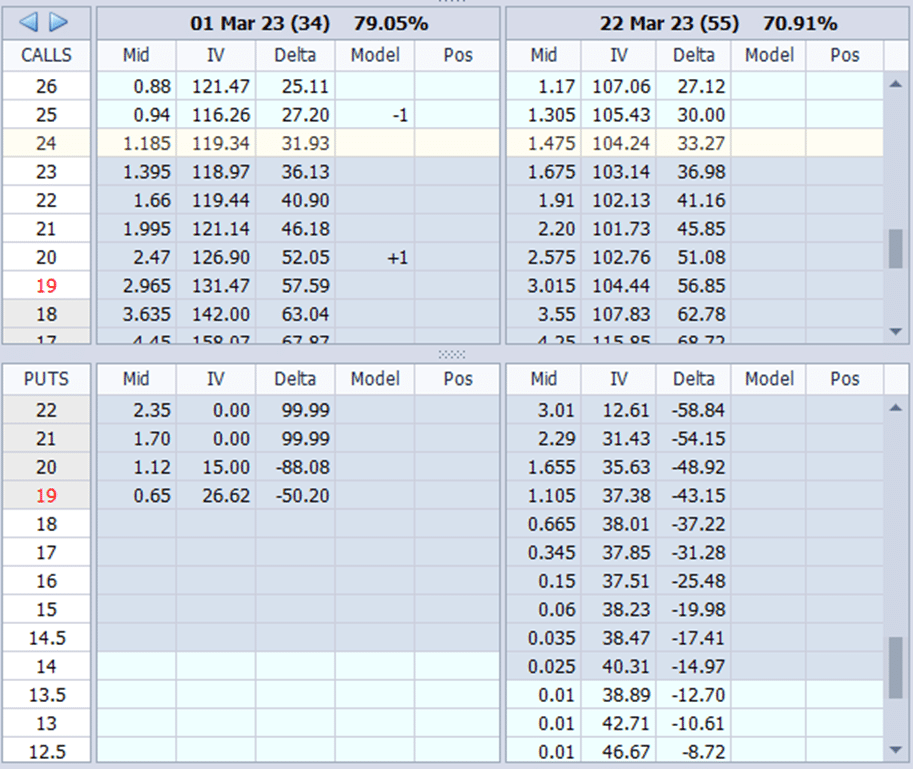
If we mark a “+1” on the 20-strike call option expiring on March 1 that we want to buy and mark a “-1” on the 25-strike call option expiring on March 1 that we want to sell, we see that the options are listed vertically on the grid.
That is why we call it a vertical spread.
There are four types of vertical spreads:
- Call debit spread
- Call credit spread
- Put debit spread
- Put credit spread
For our example, we are interested in the call debit spread shown below:
Date: January 26, 2023
Price: VIX at 19
Buy one March 1st VIX 20 call @ $2.47
Sell one March 1st VIX 25 call @ $0.94
Debit: -$153
We get the following payoff graph:
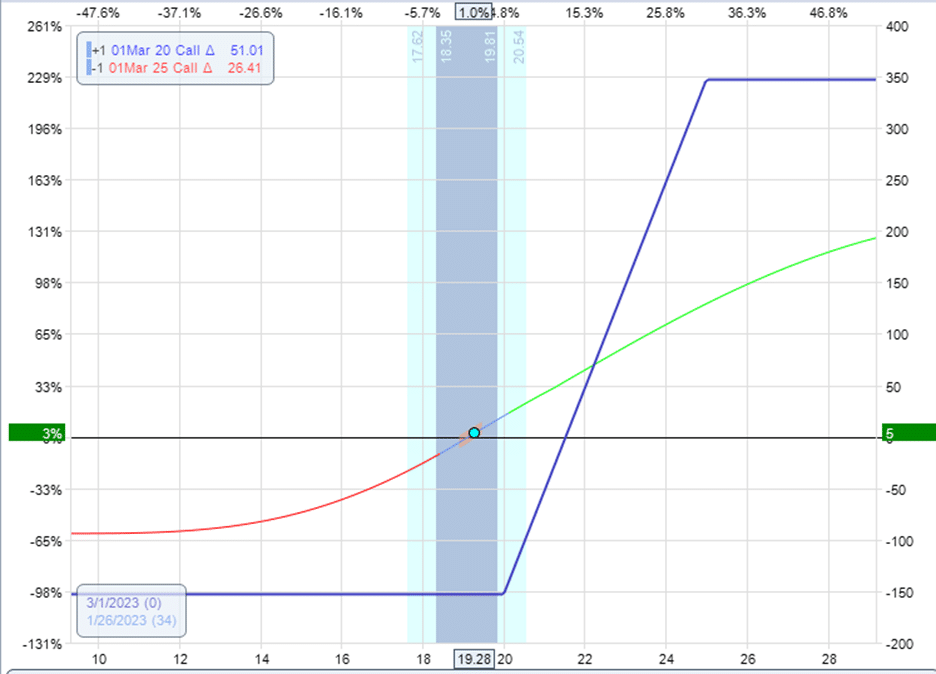
Call debit spreads are bullish because we profit if the underlying price goes up.
The right vertical axis shown in OptionNet Explorer is the dollar profit.
The bottom horizontal axis represents the price of VIX.
The curve line is the payoff line at the current time (or the T+0 line).
We see that as the price of VIX goes up (to the right on the graph), the resulting profit increases.
The blue solid line is the payoff line at expiration.
If, say, VIX was at 18 at expiration on March 1, the expiration graph shows that we lose about $150.
To be exact, we would lose $153, excluding commissions and fees.
Basically, we lose the entirety of what we paid for the spread.
This is the maximum loss of the spread.
Vertical spreads are defined risk trades.
We can not lose more than $153 in this trade.
On the other hand, if VIX did go up as expected and it ends at 26 at expiration on March 1, then our profit is about $350 based on the graph.
Because VIX is an index, there is no assignment of shares.
It is cash-settled at expiration.
However, many traders will not hold this till expiration.
They can exit the trade at any time by selling the spread.
Let’s say that 15 days into the trade on February 10, the trader sees that they were in profit of $60 when the VIX went up to 20.84.
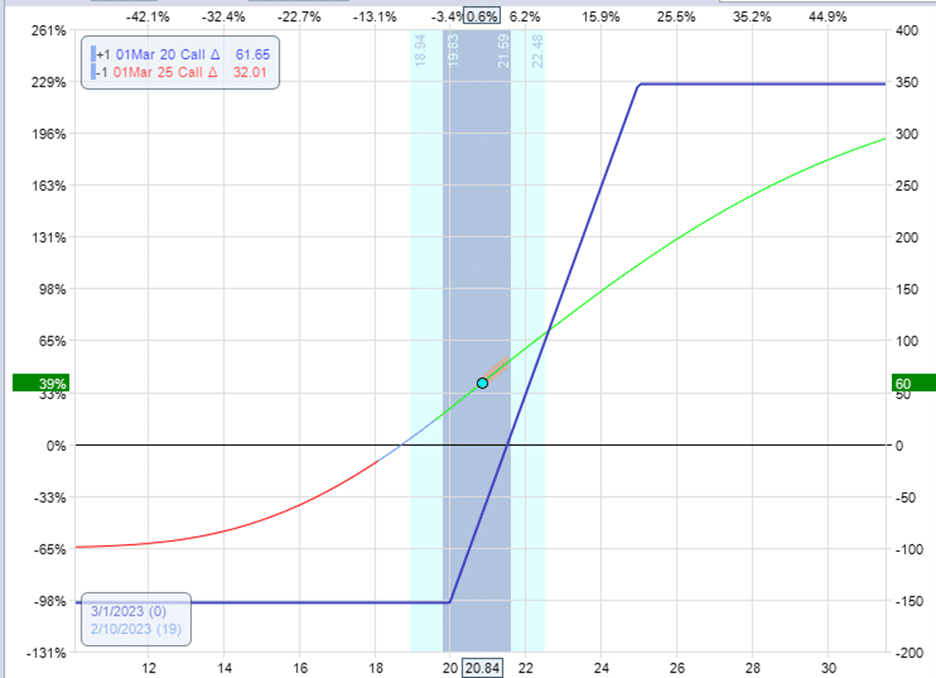
Calculating $60/$153 = 0.39 represents a 39% return on the capital invested.
The trader can exit by this order:
Sell to close one March 1st VIX 20 call @ $3.30
Buy to close one March 1st VIX 25 call @ $1.17
Credit: $213
And take a profit of $60 as calculated by taking the credit just received and subtracting the original price paid for the spread:
$213 – $153 = $60
How Do We Know When To Take Profit?
That is up to the trader. Some have a plan, such as to take profit when they see that profit is above 25%.
This is known as a profit target.
They also have a plan as to when to exit when the trade doesn’t work, such as to exit the trade if 50% of the initial capital has been lost.
An Example Of A Trade That Doesn’t Work
Let’s look at another example when VIX is below 20 and buying a similar debit spread with a similar expiration duration.
Date: March 29, 2023
Price: VIX at 19
Buy one April 26 VIX 20 call @ $2.68
Sell one April 26 VIX 25 call @ $1.24
Debit: -$144
On April 14, the value of the spread dropped to $63, less than half of what the trader originally paid for it.
The pricing to sell the spread now would be:
Date: April 14, 2023
Price: VIX at 17.7
Sell to close one April 26 VIX 20 call @ $0.90
Buy to close one April 26 VIX 25 call @ $0.27
Credit: $63
The trader can exit now and get back $63 for a net loss of $81.
Or the trader can hold to expiration, hoping they can catch a VIX pop by giving it more time.
No such luck.
Looking at the candlestick chart, the VIX never went much above 20 during the entire duration of the spread.
In this case, holding the trade till expiration would result in a maximum loss of $144.
Conclusion
Stock traders need price movement to profit.
Premium sellers also prefer higher volatilities.
There are only a handful of strategies designed for low implied volatility markets.
Now you know another one – using a call debit spread when VIX is low to catch some profits when it pops up.
We hope you enjoyed this article on trying to catch a VIX spike with a vertical spread.
If you have any questions, please send an email or leave a comment below.
Trade safe!
Disclaimer: The information above is for educational purposes only and should not be treated as investment advice. The strategy presented would not be suitable for investors who are not familiar with exchange traded options. Any readers interested in this strategy should do their own research and seek advice from a licensed financial adviser.


Very cool.