


Contents
- Math Theory
- Fibonacci Levels
- The 100% Retracement Level
- Resistance
- 50% Retracement
- 0.618 Retracement
- Price Projection
- Fibonacci Extension
- How Do You Know?
- Then What Good Are The Fibonacci Levels?
- Using Fibonacci Levels As Target
Whether you believe in Fibonacci levels or not, there are many investors on various media outlets who talk about them — which means that there are investors who use them.
We’ll look at how they might use them in this article and the psychology behind these levels.
Math Theory
The Fibonacci levels are based on the ratios of the mathematical Fibonacci sequences of number that goes like this:
0, 1, 1, 2, 3, 5, 8, 13, 21, 34, 55, 89, 144, 233, … (goes on forever)
Each sequence number is the sum of the two numbers before it.
For example, 55 is the sum of 21 and 34.
The ratio of 55/34 is 1.61764.
The ratio of 233/144 is 1.61805.
The further along in the sequence you divide, the closer you will get to the number known as the golden ratio.
The value of the golden ratio is 1.618033988749894.
We call it “1.618” for short.
Fibonacci Levels
The Fibonacci levels used in trading are based on this ratio, plus a few other ratios, which are somewhat vaguely derived from this ratio.
The major Fibonacci levels are:
0.382 = 38.2% = 1.0 – 0.618
0.50 = 50% = this is half of one
0.618 = 61.8% = 1/1.618
0.786 = 78.6% = square root of 0.618
1.0 = 100% = one is just one
1.272 = 127.2% = square root of 1.618
1.618 = 161.8% = the golden ratio
The ratios 0.236 and 2.618 are sometimes (but less often) used.
The 100% Retracement Level
The 100% retracement level is the most important one. In the short time horizon, the market is mostly random.
The key word here is “mostly”.
It is not a 100% pure random jumble of prices.
Unlike a coin flip, the market has a little bit of memory.
It is this memory that creates support and resistance.
Take a look at a daily chart of Thermo Fisher (TMO):
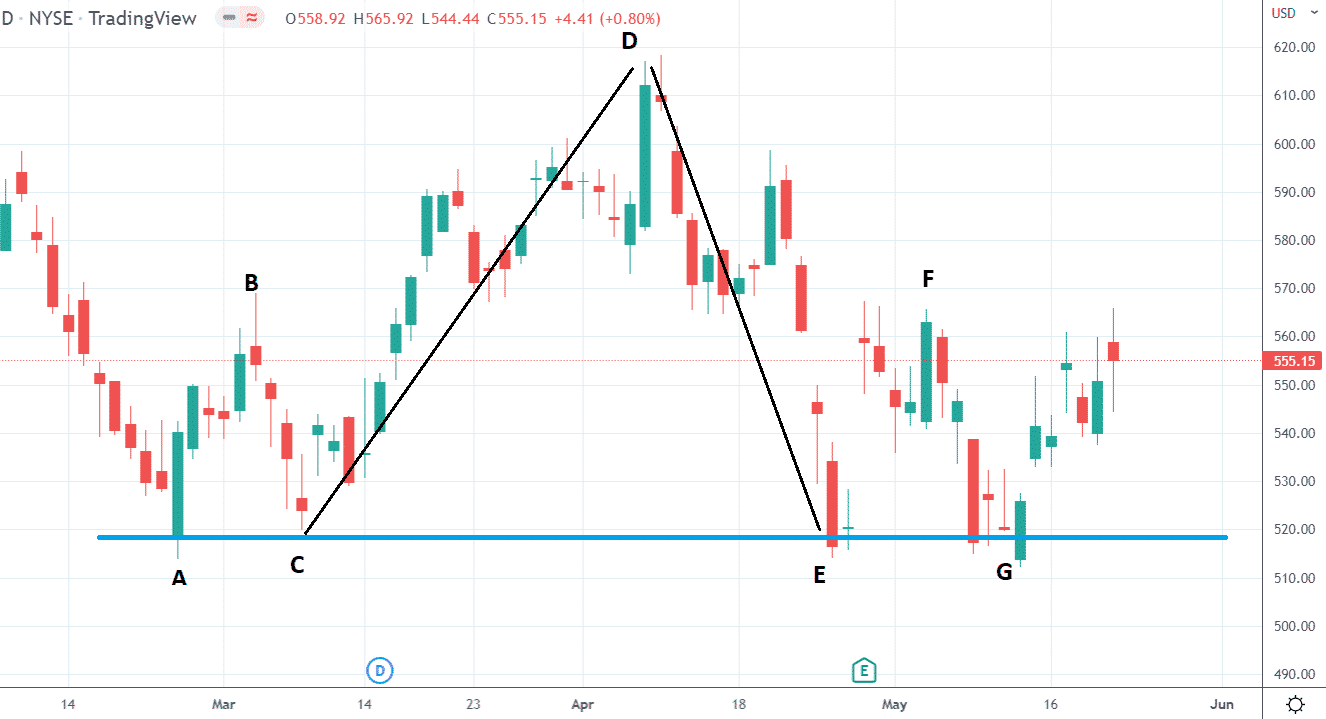
source: tradingview.com
There is a support zone at the $520 price level.
We say that the rally from point C to D has retraced 100% back down to point E.
Someone interested in buying the stock missed the move when the stock went from point C to point D.
Through random movement, the price ended again at point E.
When the investor sees this, he gets a second chance and buys at point E.
Multiply this by lots of investors and funds with lots of dollars, and you have enough buying pressure at point E to cause the price to go up at that support zone.
Similarly, new buyers or existing buyers buy more at point G because they remembered that when the price was there last time at E, it went up to point F.
Resistance
This phenomenon happens in all time frames in all assets.
Here we see an hourly chart of the S&P500 ETF.
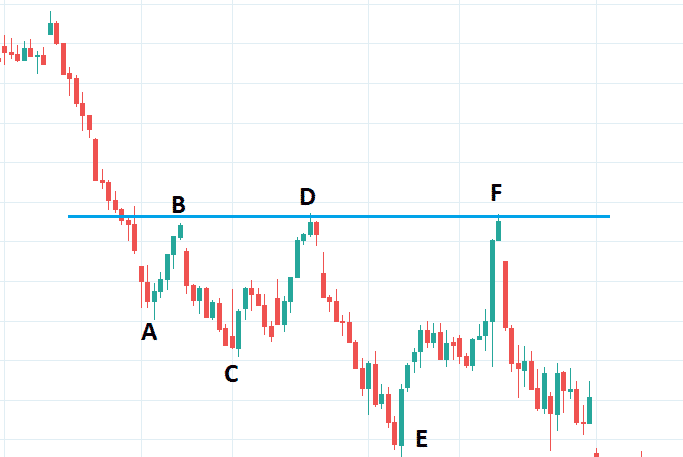
source: tradingview.com
The investor who owns the asset sees it has dropped to point A and wants to sell.
When the asset price increases a bit to point B, he sells.
Other investors want to sell too.
But they didn’t sell at B because they thought of waiting for it to go higher before selling.
They regretted the decision as they watched the price go down to C.
When the asset makes a 100% retracement back D, they rejoiced and got their chance to sell.
Enough of them selling causes the price to drop to point E.
All this selling at B, D, and F creates resistance in that zone.
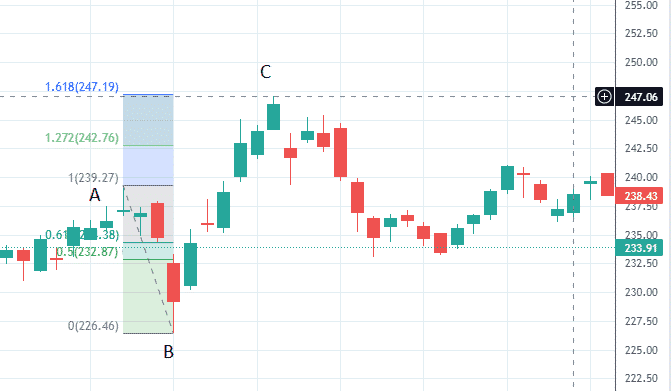
50% Retracement
When a bullish stock like Occidental Petroleum (OXY) is in an uptrend, its pullback (point B to C) is a 50% retracement of its impulse move (point A to B).
See how the candle’s wick at C reverses at the 50% level between points A and B.
Investors saw and remembered that the stock once had gotten up to point B.
When it pulled back halfway, the stock is 50% off, and they jump at the chance to buy at a discount.
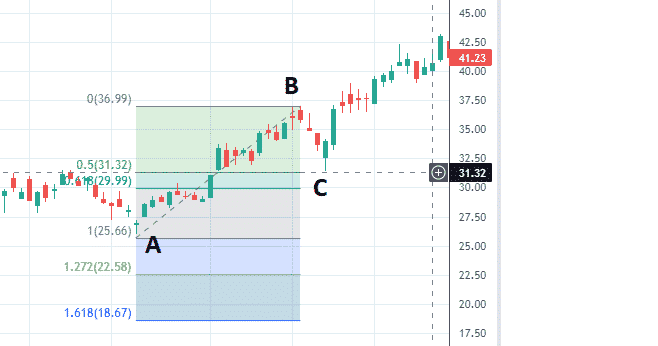
0.618 Retracement
Other times, the pullback may reverse at the 0.618 level (or 61.8%), as in the case of Eli Lilly (LLY):
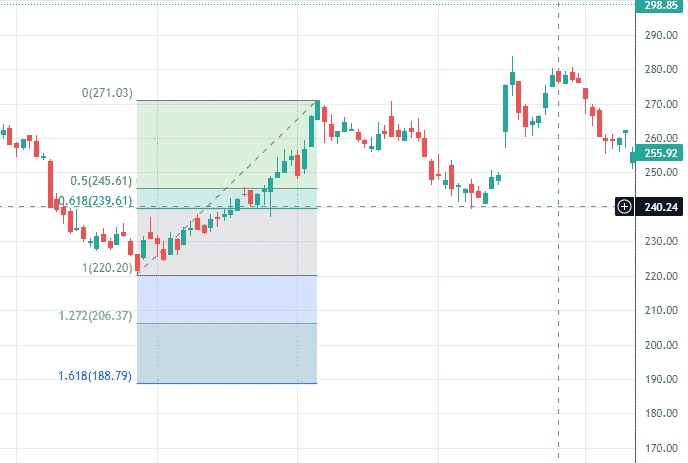
source: tradingview.com
The pullback of LLY is “deeper” than that of OXY.
That means that LLY is less bullish than OXY.
The Fib tool can measure the deepness of the retracement to give an idea of how bullish or bearish a stock is.
Price Projection
There is some symmetry in the markets.
For example, the rally of Bank of America (BAC) from point A to B had a price gain of $7.55.
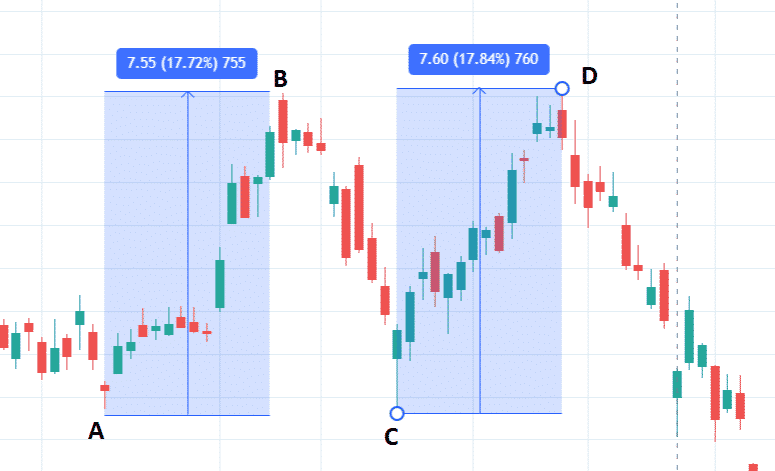
Notice that the rally from point C to point D had a similar price gain of $7.60.
We say that C to D is the price projection of A to B.
Fibonacci Extension
In McDonald’s (MCD), we use the Fibonacci Tool to draw the swing from point A to B.
The tips of the wicks are used.
The upward thrust from point B to C stopped at the 1.618 Fibonacci extension.
How Do You Know?
How do you know which levels the stock will stop at and at which level the price will extend to?
Why did OXY pull back to 50% and LLY pull back 61.8%?
Why did MCD extend to 1.618, not 1.272, and not at 100% retracement?
The answer is that we don’t know and can’t know.
Most stocks will not even stop at any of these levels at all.
And stopping at one level may be purely coincidental.
Then What Good Are The Fibonacci Levels?
Traders may not pay much attention at any particular level, but when there is a confluence of three Fibonacci levels clustered around one price, they pay attention.
Carolyn Boroden at FibonacciQueen.com waits for three different Fibonacci levels to line up plus a triggering event to have a valid trade setup.
So simply saying the stock is going to turn at a certain level is not going to work.
Other traders used them to be mechanical in their process. Suppose a trader buys MCD after the low at point B.
They may have a rule in the trading plan to say.
Once the stock has reached the 0.618 level, move the stop loss order to breakeven.
If the stock continues past the 100% retracement, move the stop up because the 100% retracement is a potential resistance level.
And then move stops when the price reaches the 1.272 and 1.618 levels, etc.
Or, if the trader has the style of “selling on strength,” they may have a rule that says…
“if a stock went up past the 100% level, then take profit at the 1.272 level regardless if it looks like it will continue or not.”
If enough traders or algos have this same rule, the market may react at that level, creating a self-fulfilling prophecy.
Using Fibonacci Levels As Target
Fibonacci levels are sometimes used as targets of possible moves.
Take a look at the QQQ (Nasdaq ETF) in the early part of 2022.
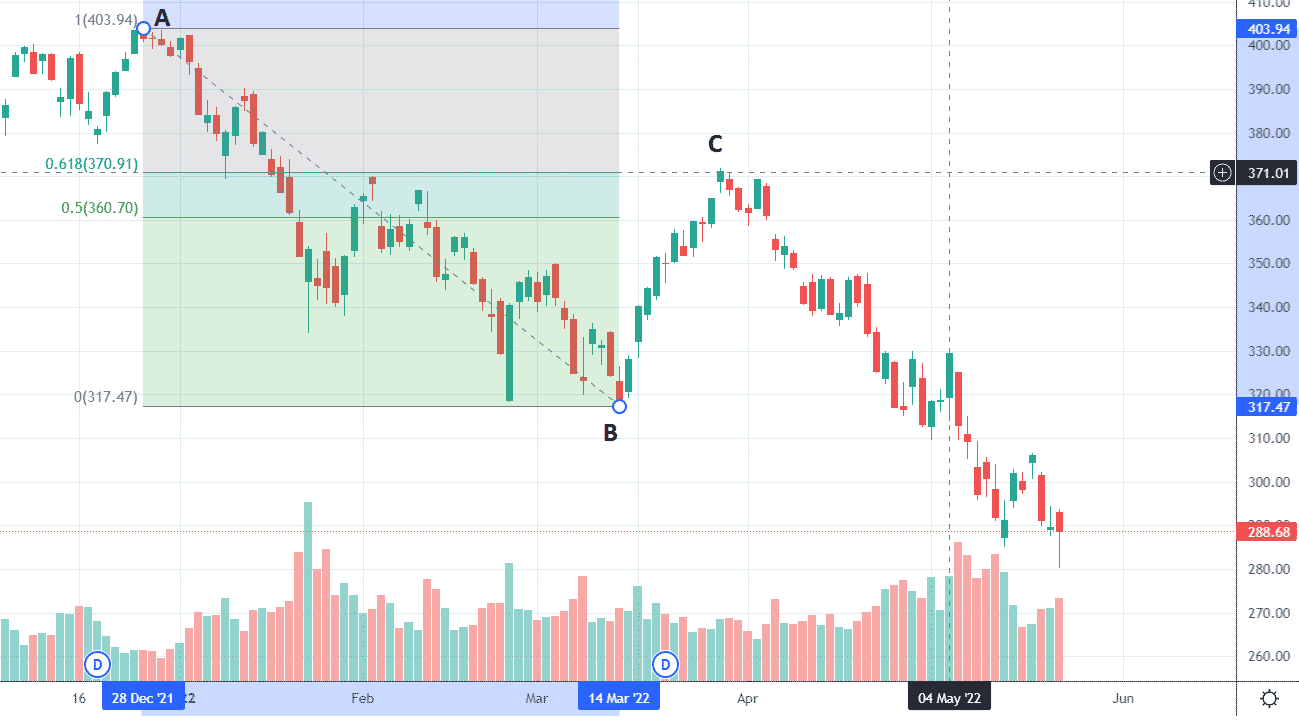
The impulse move down from point A to B was followed by a counter-trend rally back to the 0.618 retracement level at point C (which corresponds to the $370 price level in the QQQ).
The down move from point A to B was an 87-point drop.
Using the Fibonacci extension tool, drawing from point A to B to C and then to D.
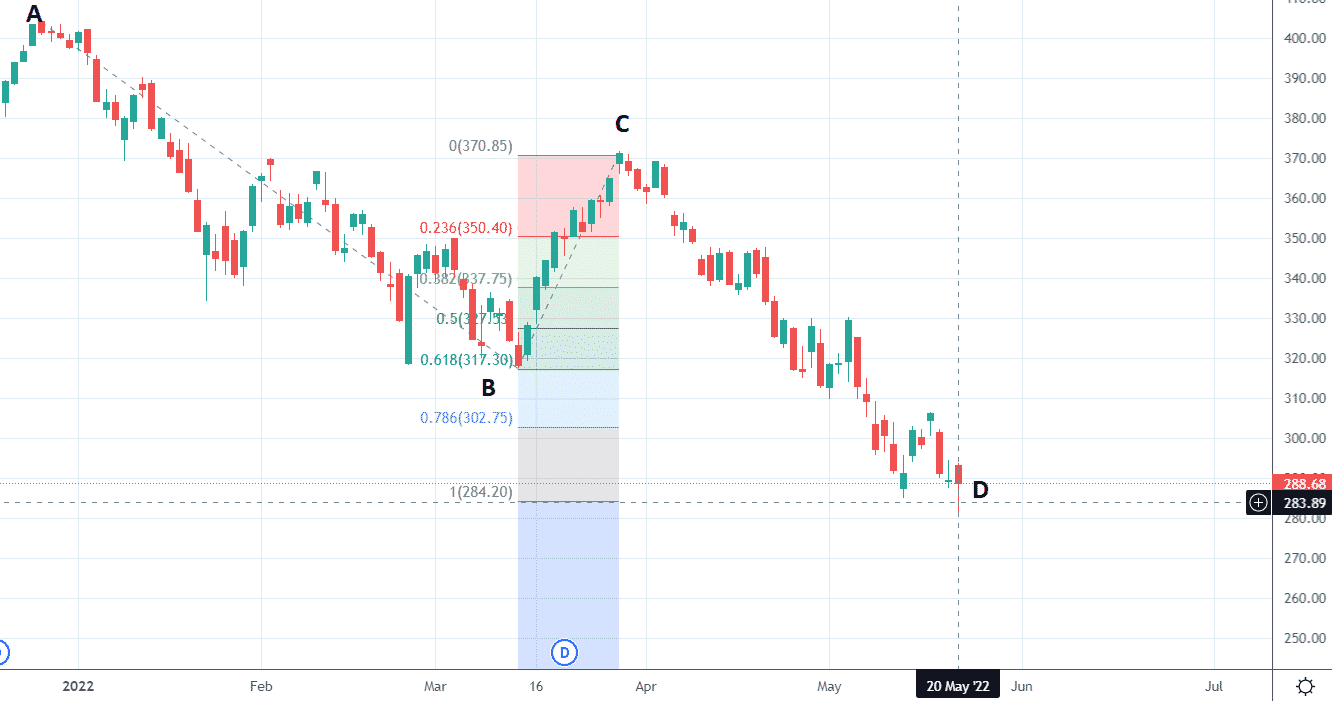
It shows us that the $385 price level on May 20, 2022, is the 100% price projection of the impulse move AB.
In other words, the move from C to D was the same point drop as the move from A to B. Or very close, 85 points versus 87 points.
Traders who believe there is symmetry in the markets may speculate that the drop CD is at the end, and we are due for a counter-trend rally similar to that of BC.
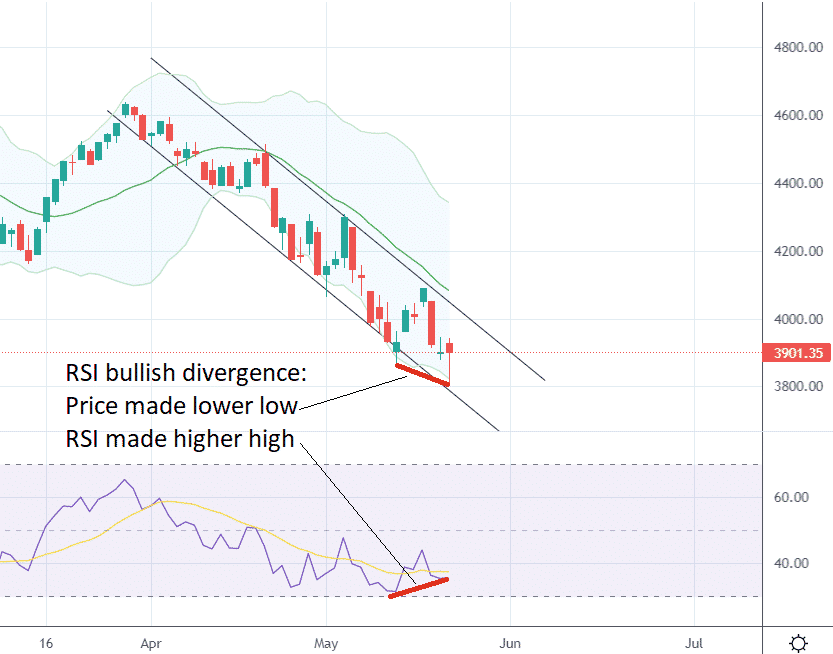
They may use other factors to support this thesis — such as being at the bottom of Bollinger Band and bear channel, evidence of bullish RSI divergence, and bottoming-tail candle, etc.
How High Can It Rally According To Fibonacci Levels?
If it does rally, how high can it go?
Some traders may target the top of the bear channel.
Others may target the middle of the Bollinger Bands.
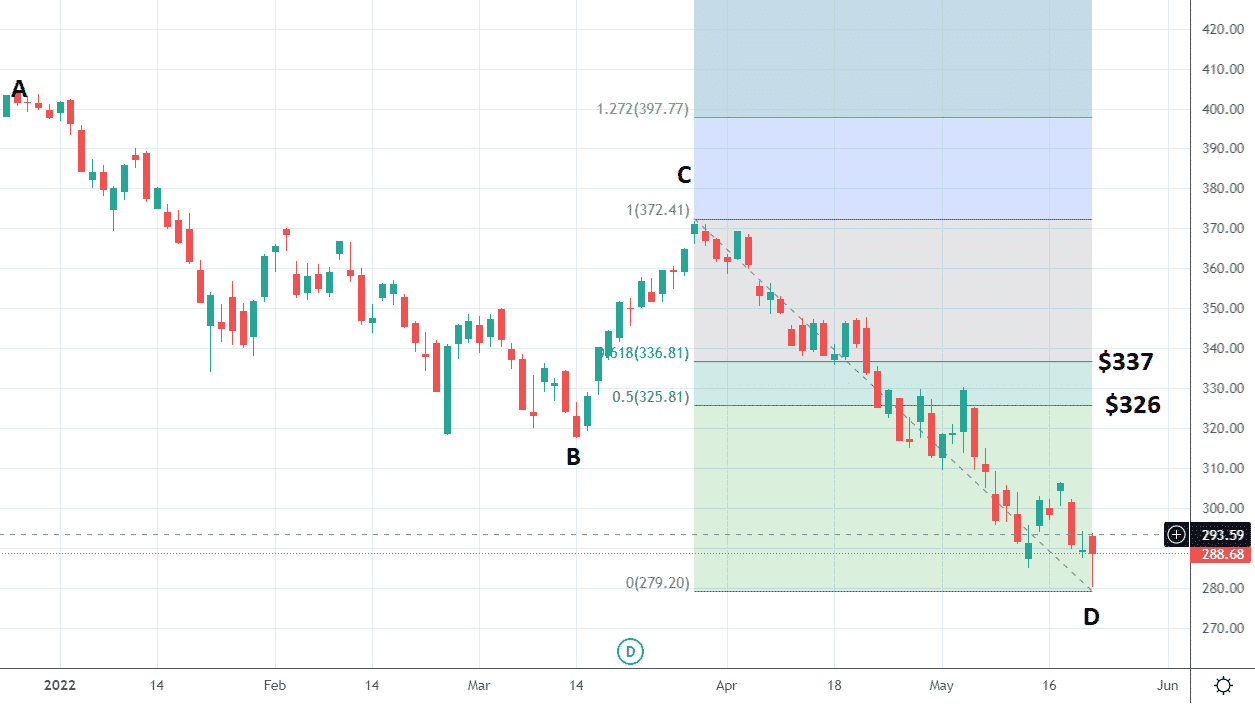
And others may target the 50% or 61.8% Fib levels.
The 61.8% Fib level was the level at which the previous rally stopped.

The 50% and 61.8% levels correspond to price targets of $326 and $337.
Expecting a rally but not past $340, a trader may set up a bull call spread with long the call at $285 (just in-the-money) and sell the $340 call to finance that.
source: OptionStrat.com
If the move happens, how long would the move take?
Last time it took two weeks.
So, the trader gives the spread a little more time with three weeks to expiry.
This trade has a max loss of $1135 but has the potential to make $4365 (or 3.8 times that).
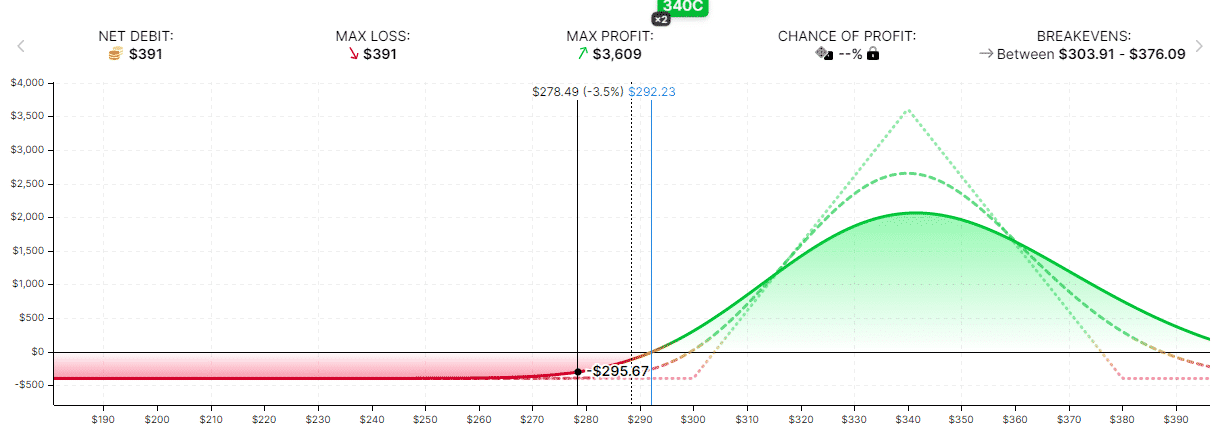
For a smaller size alternative, one can use a target butterfly centered at $340.
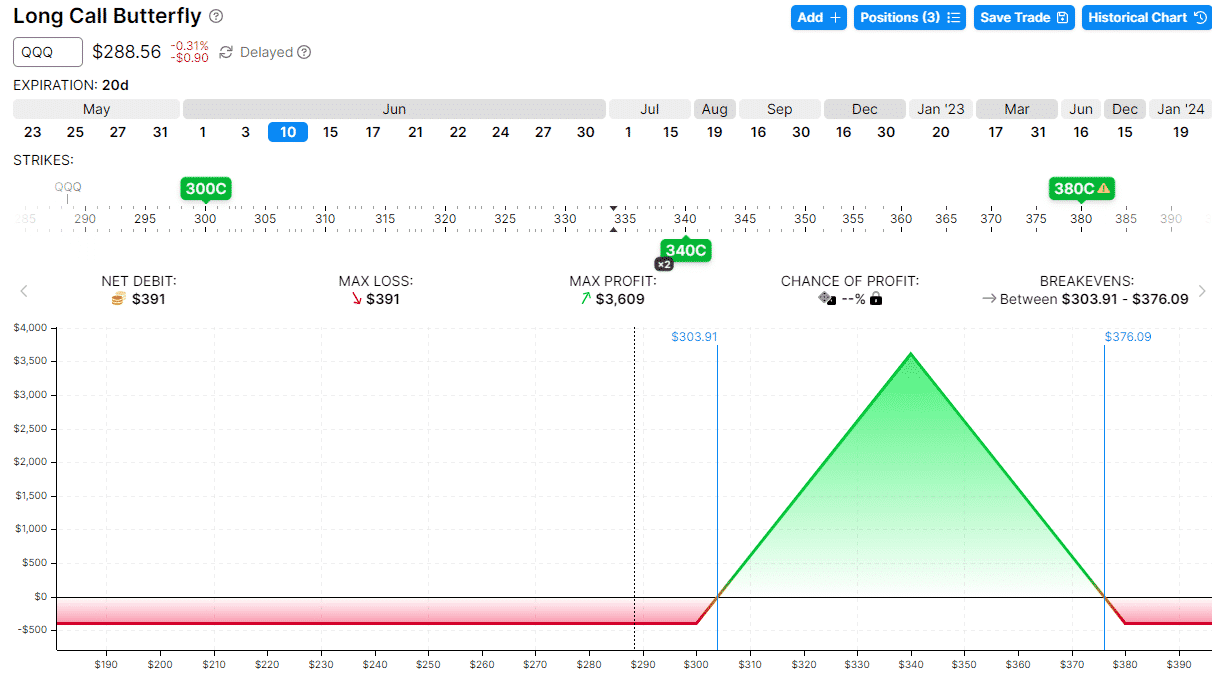
If the symmetry of the market plays out and the rally is just like the previous rally, the butterfly has the potential of making $2400 on June 3rd:
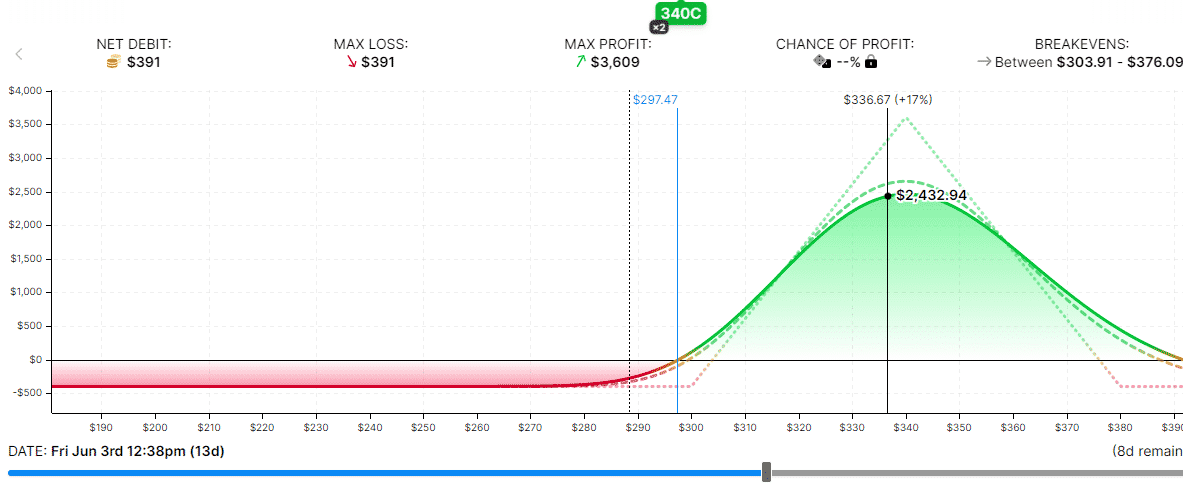
But if not, the max loss on the butterfly is $391 at expiration.
Some traders may cut the trade before then, saying that if the price closes below the bottoming-tail wick at $280, then I’m wrong, and I’m out.
If the trade is closed within five days, the loss could be around $300.
Conclusion
While other traders will hold to expiration, willing to take the full $391 loss, in order to potentially get six times the return on risk.
That is something that each individual will have to decide for themselves before putting the trade on — especially on these speculative plays that are going against the dominant downward trend.
We hope you learned something from this article on Fibonacci levels, and if you have any questions, please send us an email or post a comment below.
Trade safe!
Disclaimer: The information above is for educational purposes only and should not be treated as investment advice. The strategy presented would not be suitable for investors who are not familiar with exchange traded options. Any readers interested in this strategy should do their own research and seek advice from a licensed financial adviser.


