


An EMA cross strategy is when the chart has two different moving average lines. When one crosses the other, that generates either a buy or sell signal.
Contents
- Introduction
- Traditional Cross Over Strategy
- Exponential Moving Average Crossover Strategy
- The Study’s Conclusion
- Our Own Backtest
- Conclusion
Introduction
There are many different types of moving averages. For example, simple-moving average, exponential moving average (EMA), Hull moving average, etc.
Each moving average can have a different period. The 20-day moving average, 50-day, and 200-day moving averages are just a few more common ones.
The combination is limitless, and there are an innumerable number of crossover strategies proposed.
Which one is the best? There are many studies and backtest that have been performed. Which study are we going to believe?
What is best also depends on the underlying asset being traded as well as the trader’s timeframe. The moving average strategy that will work best for a day trader may not be the best for a longer-term investor.
With that being said, we are going to discuss the EMA crossover strategy today.
Why exponential moving average? Because that was what the article published in Yahoo! Finance said was the “best” — keeping in mind there may not be such a thing as the best.
The article published on August 13, 2015, was titled Study Determines The Best Moving Average Crossover Trading Strategy
Although the study was done many years back and markets may have changed. Perhaps the underlying principles may still hold true.
What was impressive about this particular study was that EFT HQ performed the analysis using 300 years worth of daily and weekly data from 16 different indices.
Traditional Cross Over Strategy
Before we get to the study’s results, let’s understand more about how the crossover strategy works.
Traditionally, the 50-day and 200-day simple moving averages were used. The term “golden cross” is a bullish signal when the 50-day moving average crosses above the 200-day moving average. The term “death cross” is a bearish signal when the 50-day moving average crosses below the 200-day moving average.
Some analysts may alternatively use the 50-day and 100-day moving averages.
Exponential Moving Average Crossover Strategy
The exponential moving average crossover strategy uses exponential moving averages instead of simple moving averages. The difference is that exponential moving averages give more weight to the more recent price movements when calculating the average.
Other than that, the signals are the same. A bullish signal is when the shorter-period exponential moving average crosses above the longer-period exponential moving average. A bearish signal is when the shorter-period exponential moving average crosses below the longer-period exponential moving average.
The Study’s Conclusion
The study concluded that using exponential moving averages gives better signals than using simple moving averages.
Now the big question is what combination of exponential moving averages gave the best results in the crossover study.
The answer is that it found the 13-day EMA and the 48.5-day EMA combination to give the best results.
48.5 is such an odd moving average. I’m not even sure if all charting platforms can do fractional period moving averages. If the strategy is indeed a robust strategy, then using a more common 50-day EMA would not and should not give too different of a result.
Our Own Backtest
Before we take the study’s conclusion based on faith, let’s do a small non-official simple backtest to validate the strategy before putting money on the line.
We do not know the details of the study’s trades, such as how they managed or exited the trade.
Most likely, they bought and sold shares.
But since we are options traders, we will use options instead.
We have to decide which option strategy to use to express our directional view.
Shall we use credit spreads, debit spreads, risk reversals, etc.?
We would use debit spreads if we were quite confident of the strategy’s direction prediction. If we were super confident, we would buy call options or put options.
While the EMA crossover strategy gives us a directional bias, we don’t have super strong confidence that any indicator could predict direction with that degree of certainty.
So, we will use credit spreads.
Credit spreads give us a directional bias, so we profit if the direction is correct. But even if we are not, it uses theta decay as a secondary driver of profits.
Selling Credit Spreads
Let’s sell credit spreads at the 15 to 20-delta with about 35 days to expiration.
Next, we have to decide on which asset to trade on. Let’s use RUT for this particular backtest.
Since TradingView does not allow for 48.5-day moving averages, we will use the 50-day exponential moving average instead. The crossover points on the chart would not be too different.
From January 1, 2021, to September 30, 2022, we sell a bull put credit spread whenever the 13-day EMA crosses above the 50-day EMA on the RUT. We sell a bear call spread whenever the 13-day EMA crosses below the 50-day EMA.
We will set a good-to-cancel order to make a profit of 10%. Checking the P&L once a day (one hour after the market opens), we will exit the trade if we see a loss of greater than 10%. This will be our mental stop loss.
We will also exit the trade regardless of the P&L if we see the moving averages cross in the opposite direction.
Here is a sample trade:
On July 28, 2022, the orange 13-EMA crossed above the blue 50-EMA, which triggered a bullish signal.
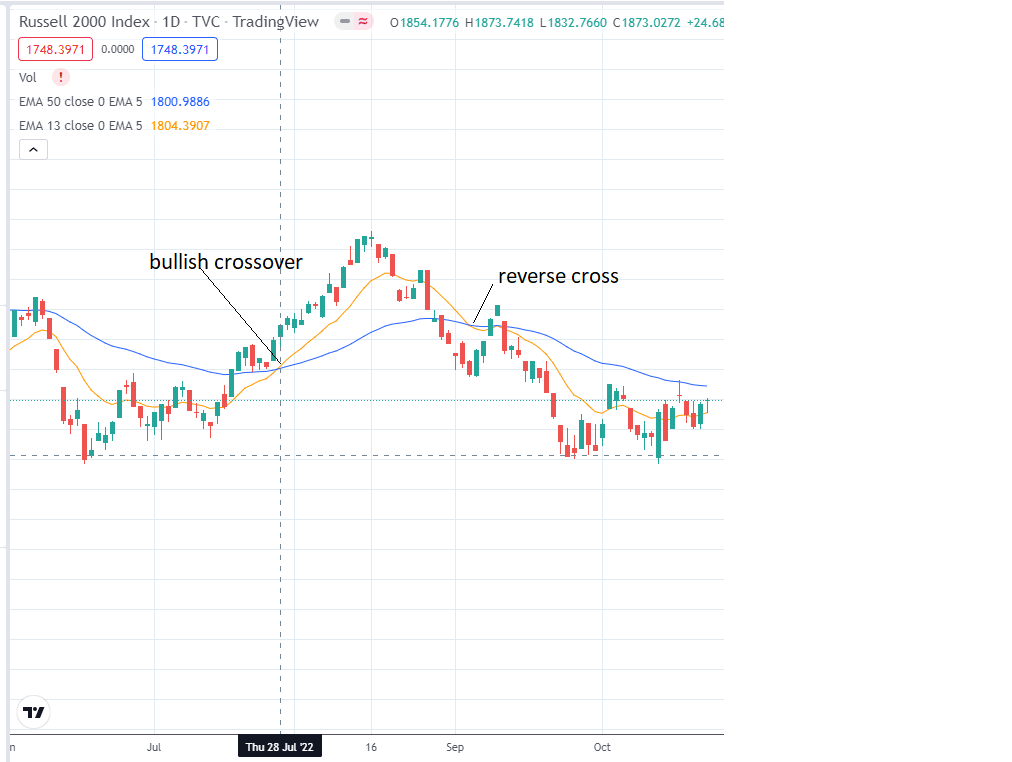
source: TradingView.com
So, we sell a bull put spread:
Date: July 28, 2022
Price: RUT @ 4000
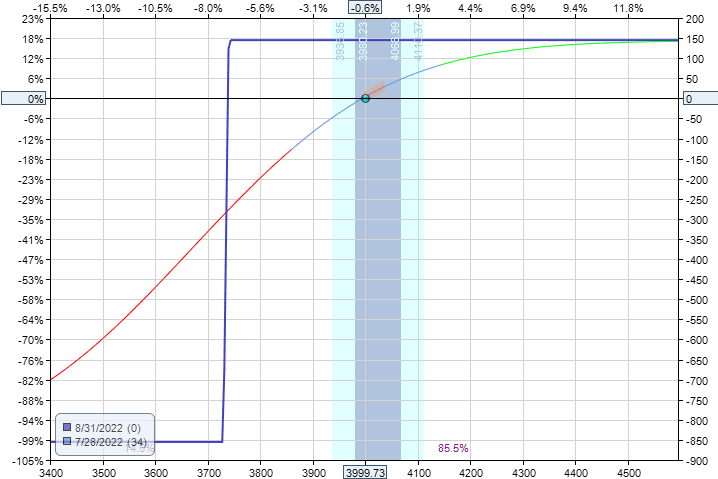
Sell one August 31 RUT 3740 put @ $32.75
Buy one August 31 RUT 3730 put @ $31.30
Net Credit: $145
Max Risk: $855
source: OptionNet Explorer
We put in a good-to-cancel order to buy back the spread if its value drops to $0.60. This would result in a profit of $85, or about 10% of the max capital at risk.
We also monitor the P&L each day. If we see the P&L is showing a loss greater than $85, then we would exit the trade.
If the moving average crosses back on each other (as on September 6 as marked as a “reverse cross” in the chart above), we would also exit the trade if it has not already been exited.
Fortunately, this example trade hit its profit target on August 1, 2022.
Conclusion
Here are the results of our mini-backtest:
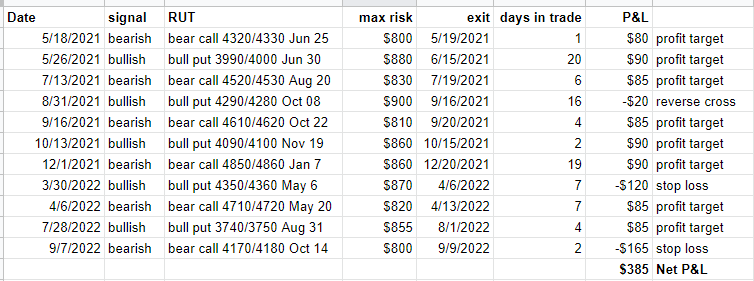
We were using one contract for the backtest. But it can be scaled up.
The strategy resulted in a profit of $385 for the 21 months tested using no more than $900 worth of capital. This comes to be about a 24% annualized return.
Because the signals come infrequently, the actual days that the capital is exposed to the market are only about 68 days out of the year 2021.
If an investor combines this strategy with additional profitable strategies, they may be able to better utilize their capital.
The number of signals generated per year is not a lot. So some years can see a negative P&L. Although the EMA crossover strategy does appear to have a positive expectancy, the number of trades per year may be too low for the probabilities to play out in our favor every year when trading on the daily chart.
We hope you enjoyed this article on the EMA cross strategy. If you have any questions, please send an email or leave a comment.
Trade safe!
Disclaimer: The information above is for educational purposes only and should not be treated as investment advice. The strategy presented would not be suitable for investors who are not familiar with exchange traded options. Any readers interested in this strategy should do their own research and seek advice from a licensed financial adviser.


You’re right about low trade frequency being the real killer with EMA crosses on daily charts—I’ve burned through plenty of backtests that looked perfect until you realize you’re getting 30-40 trades a year, which isn’t enough to validate edge in live trading. The problem I ran into was trying to force one EA to work across all market regimes, which is why I switched to a toolbox approach with Ratio X Toolbox on MT5—it’s got separate bots for trends, breakouts, and mean reversion so you can rotate based on what the market is actually doing instead of fighting the same EMA cross in choppy conditions. Have you considered combining this with a regime filter, or are you sticking with pure crossover logic?
Thanks for sharing that. You’ve hit on exactly the key limitation we highlighted in the conclusion: low trade frequency is a genuine problem with daily chart crossover signals, and 30-40 trades a year is a tough sample size to draw statistically meaningful conclusions from.
One thing worth noting is that our approach here is a bit different from the EA/MT5 world — we’re using the EMA cross as a directional filter to time credit spread entries rather than running an automated system, so the regime problem manifests a little differently. In choppy, non-trending conditions, the cross signals tend to whipsaw, which eats into theta gains when you’re exiting early on a reverse cross signal.
The toolbox approach you’re describing is a smart way to tackle it in the automated space. For options, a regime filter is something worth layering on to determine whether the EMA cross signal is even worth acting on. That alone could meaningfully cut the noise without requiring a whole new system.
We’re sticking mostly with the crossover logic here since the goal was to test the original study’s premise, but combining it with a simple regime filter is a logical next step that would be worth backtesting. Appreciate the input!