


This article will first go through the basic concepts of breakout trading indicators.
We will actually look at breakouts and breakdowns.
In the latter part, we will use some indicators to make the rules for trading breakouts more systematic, including ones that we can consider to help filter out false breakouts.
Contents
- Breakout
- Pop Out Of The Box
- Breakdown
- Donchian Channel Indicator
- False Breakouts
- Avoiding False Breakouts
- Conclusion
Breakout
Breakout traders will watch for breakouts based on the price action of the candles.
Here we see Apple (AAPL) in a channel during late October and early November of 2021.
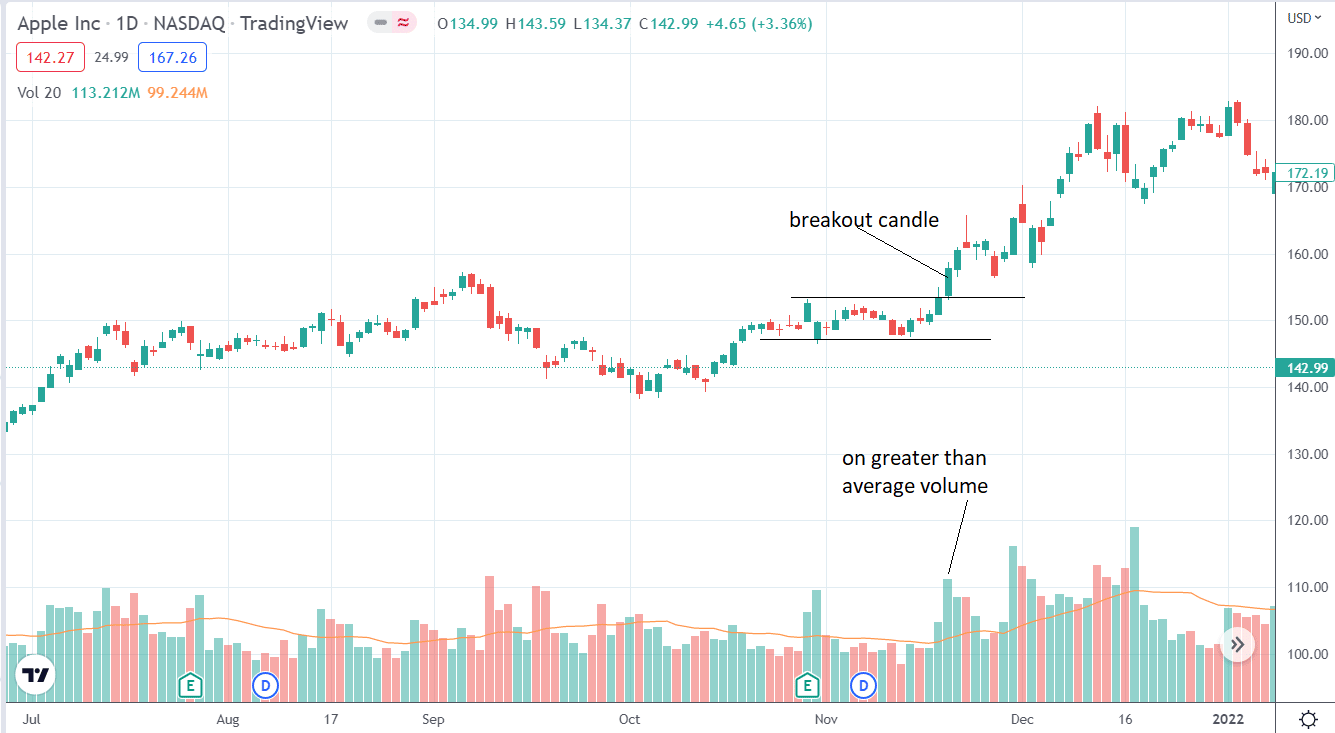
source: tradingview.com
On November 18, the large green candle broke out of this trading range, prompting breakout traders to go long on AAPL.
Traders will also use the volume as additional confirmation of strong conviction of the breakout.
In the above chart, we have turned on the 20-day moving average on the volume histogram.
We see that the breakout candle on November 18 was on higher than average volume.
This provides an increased probability that the breakout is going to be successful — in which case, in this example, it was.
Pop Out Of The Box
Friday the 13th is considered an unlucky day in Western superstition.
But that was not the case for Johnson and Johnson (JNJ) in August of 2021.
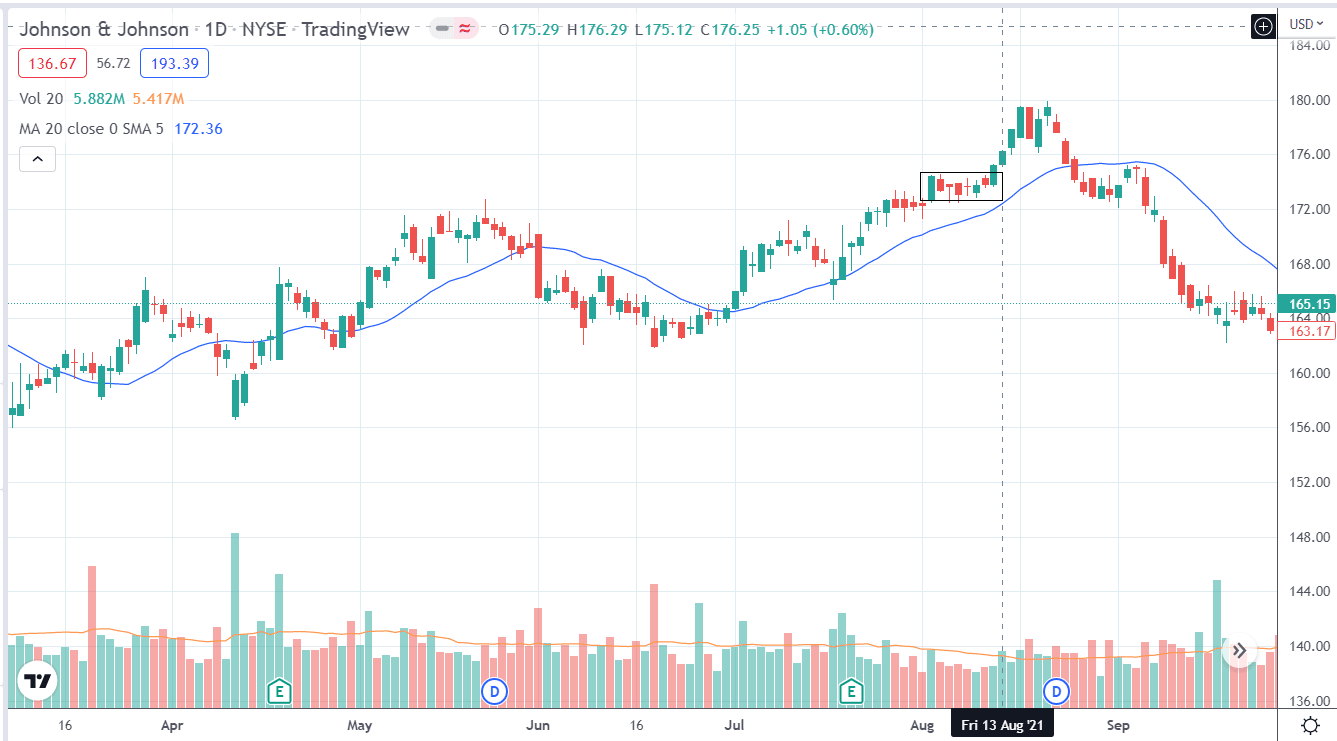
On Friday the 13th, JNJ produced a successful breakout after it “popped out of the box” — at least, that is what Doug Campbell of Right Way Options calls it.
Note how the price is trending above the 20-day moving average.
It was consolidating in a box formation back towards the moving average when the August 12 candle closed at its high.
And the rally followed through on the 13th.
Breakdown
In the below chart of Walmart (WMT), we see that it was in a six-day balanced range during the week of September 20, 2021.
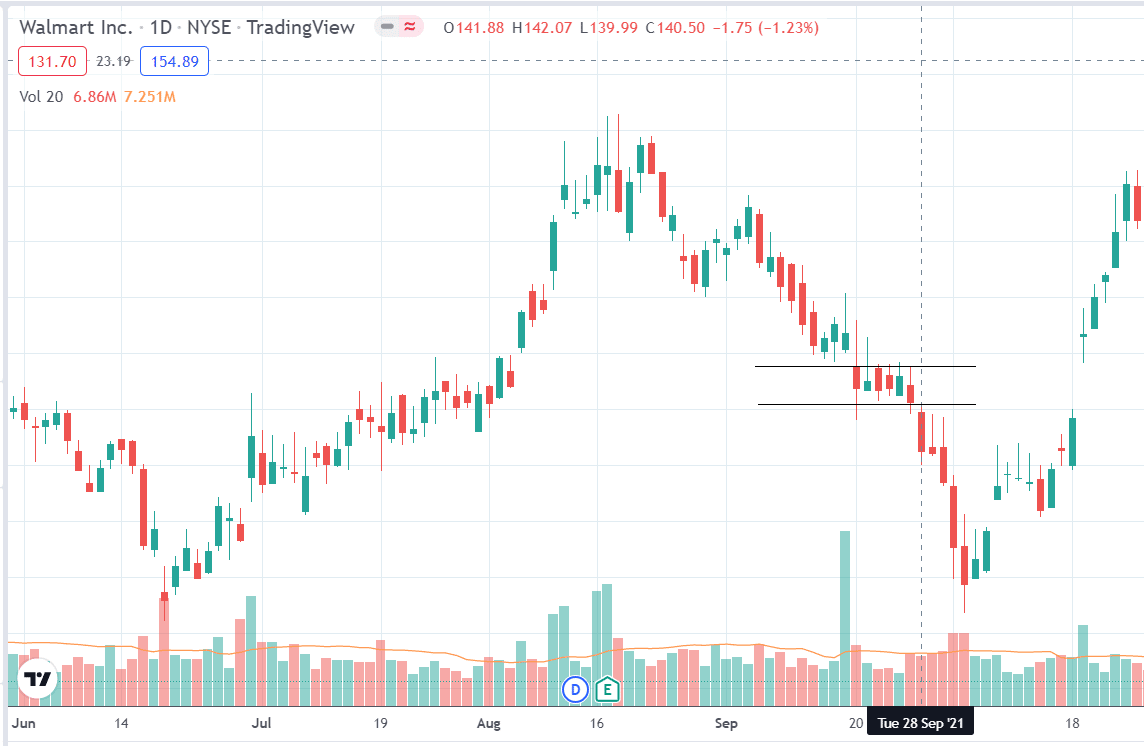
Note the appearance of wicks above and below the candles.
This is an indication that the buyers and sellers are in a close battle.
The following Tuesday, September 28, the buyers lost the fight, as evidenced by the sellers producing a large red candle that was clearly below the prior trading range.
While this candle did not occur on greater-than-average volume, the breakdown was still successful.
Part of the reason could be that the breakdown was in the direction of the primary downtrend.
Trading breakouts and breakdowns in the direction of the trend is just another slight edge that breakout traders will use.
Donchian Channel Indicator
The Donchian indicator came into popular awareness partially due to the Turtle traders who would buy a stock when the price breaks above the 20-day high.
The Donchian Channel indicator indicates the 20-day high and 20-day low of a stock.
While the 20-day period is the default, it can be adjusted.
Here on May 3, 2022, we see the 3M Company (MMM) with the Donchian channel showing the 20-day high at $153 and the 20-day low at $143.
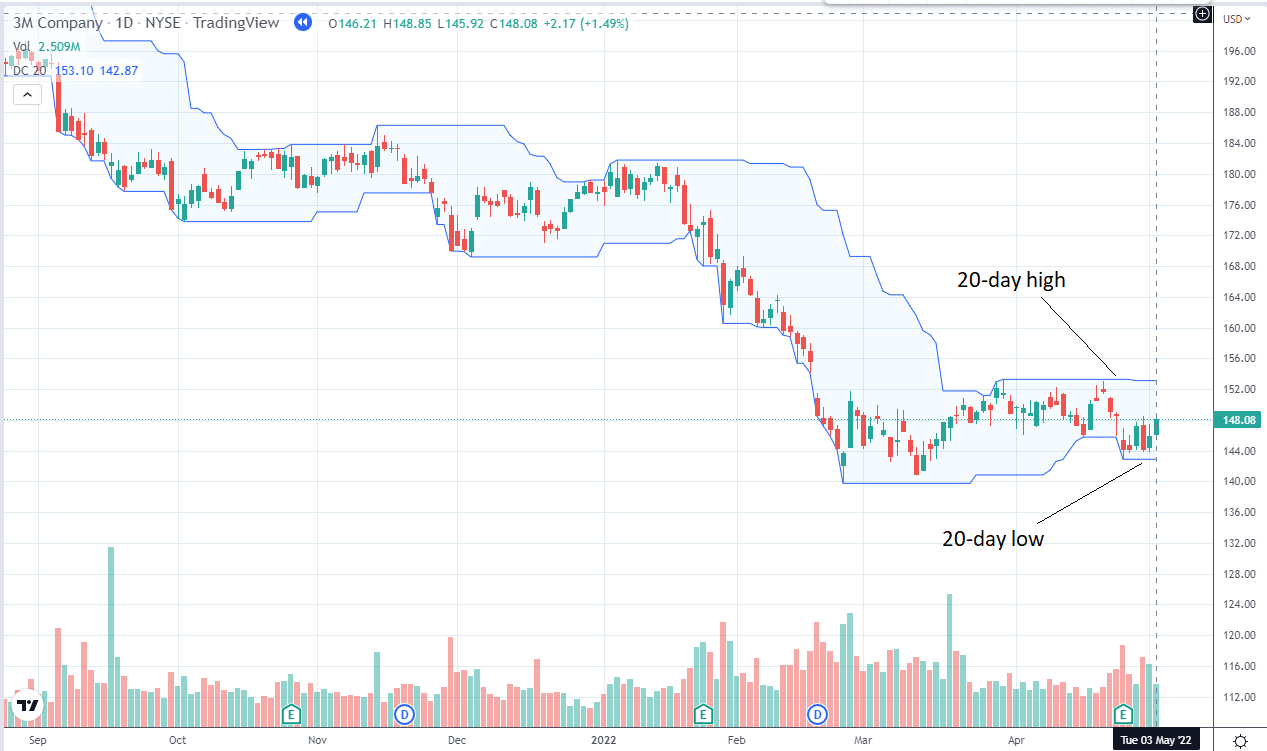
source: TradingView.com
The next day, we have a breakout above the 20-day high.
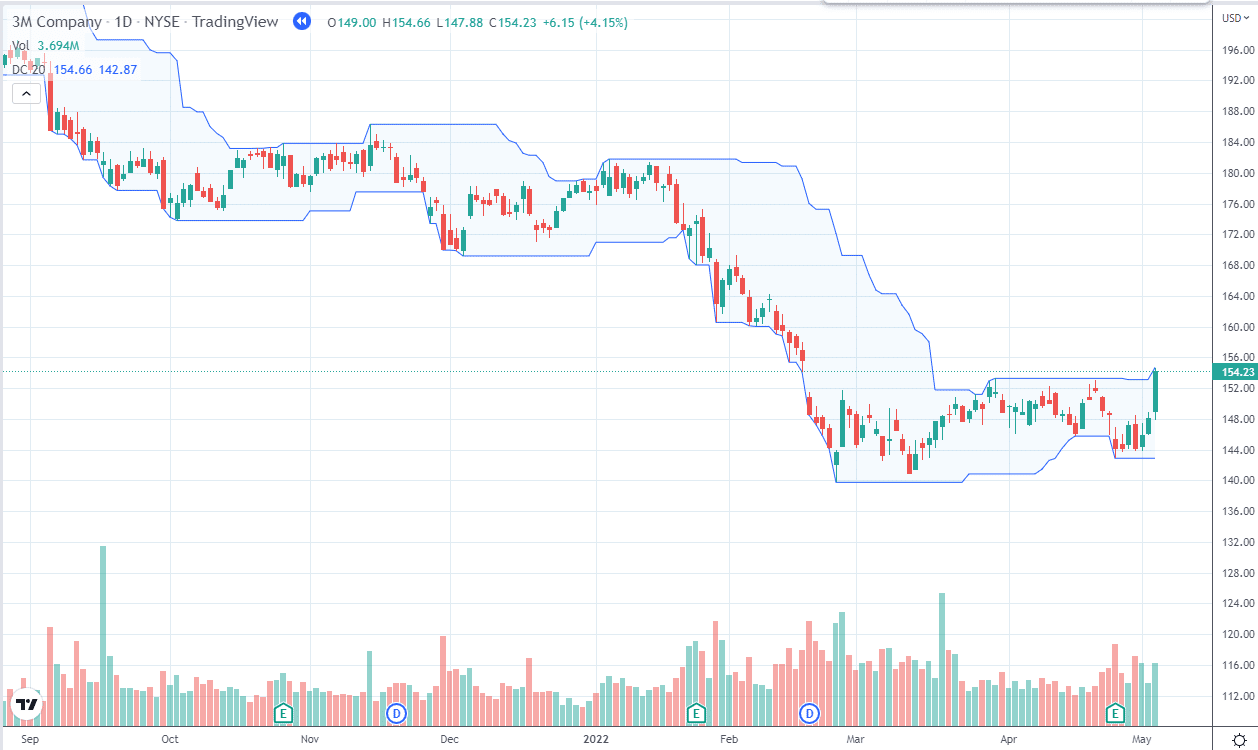
False Breakouts
But that breakout turned out to be a “false breakout” because it never traded higher than that day’s close.
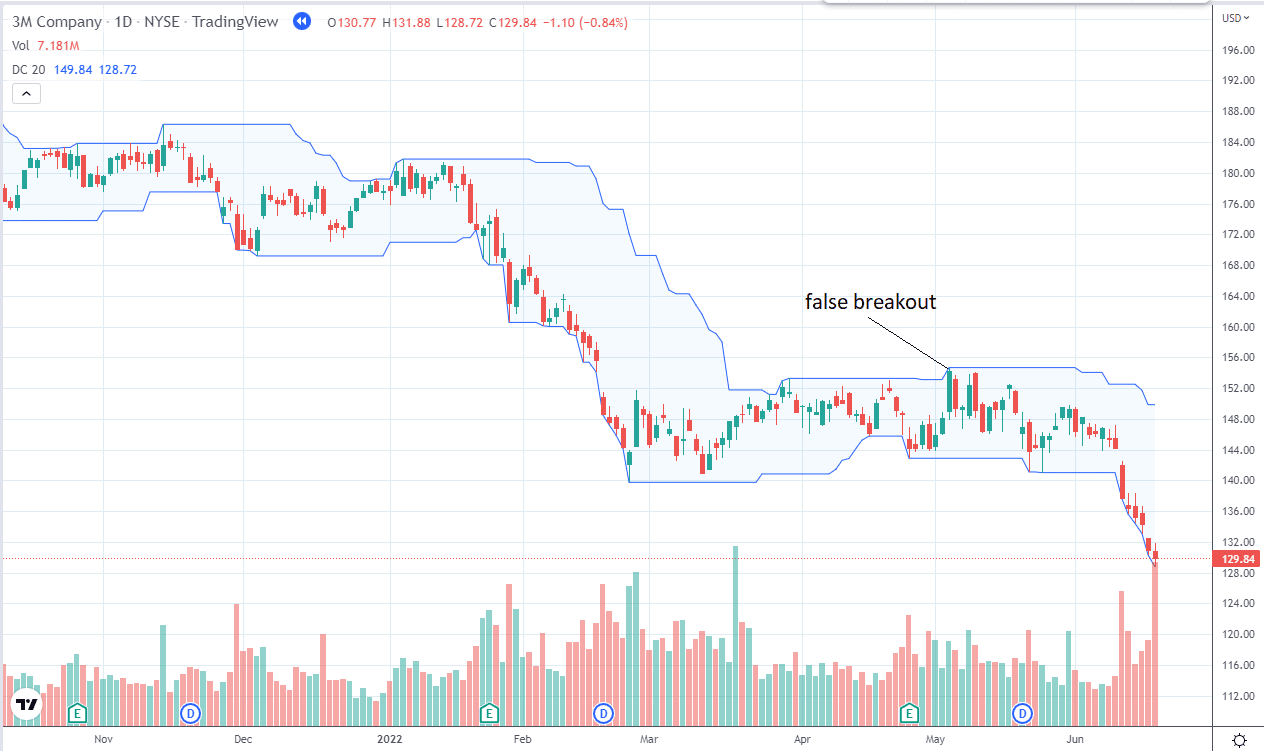
Unfortunately, false breakouts are common and are the bane of the breakout trader.
Some breakout traders may have been suspicious of this breakout because the price went from the bottom of the trading range to the top of the trading range in three consecutive green candles.
Yes, the last green candle was a strong one, and it technically broke above the trading range.
But how likely will the next day be a fourth consecutive green candle after the stock has already made such a large move up? More likely, the stock will be a bit exhausted.
If we had slapped on the 200-day moving average to the MMM chart, we would have seen that it was below that 200-day moving average, which to some will indicate that the stock is in a bear trend.
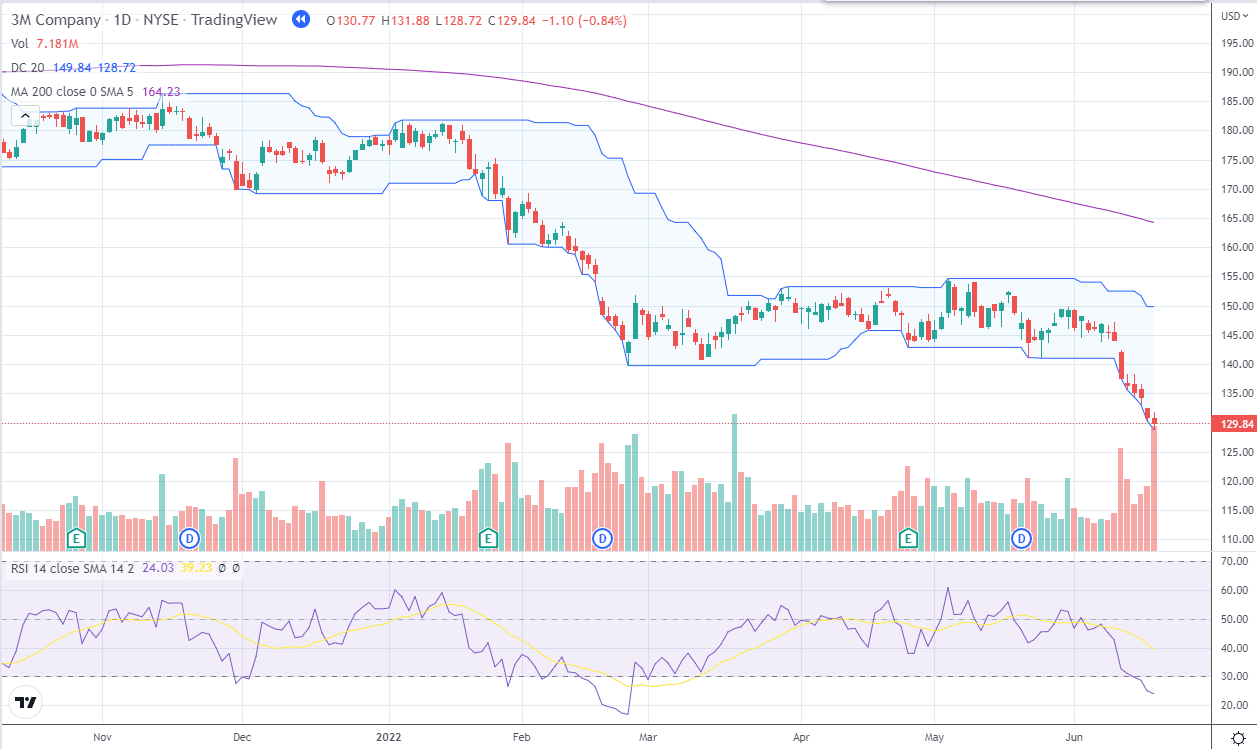
Taking a bullish breakout in a bear trend is a counter-trend trade and can be a lower probability trade.
Avoiding False Breakouts
False breakouts are common.
Many traders will use some sort of filter to avoid some (but not all) of these false breakouts.
Instead of taking all breakouts of the Donchian channel, they take ones where the stock is already trending in that direction and is breaking out with some amount of momentum.
You can use your favorite indicators to give you the direction of the trend.
For our example, we will use the 200-day simple moving average as a trend filter.
We take breakouts on the upside only if the price is above this moving average.
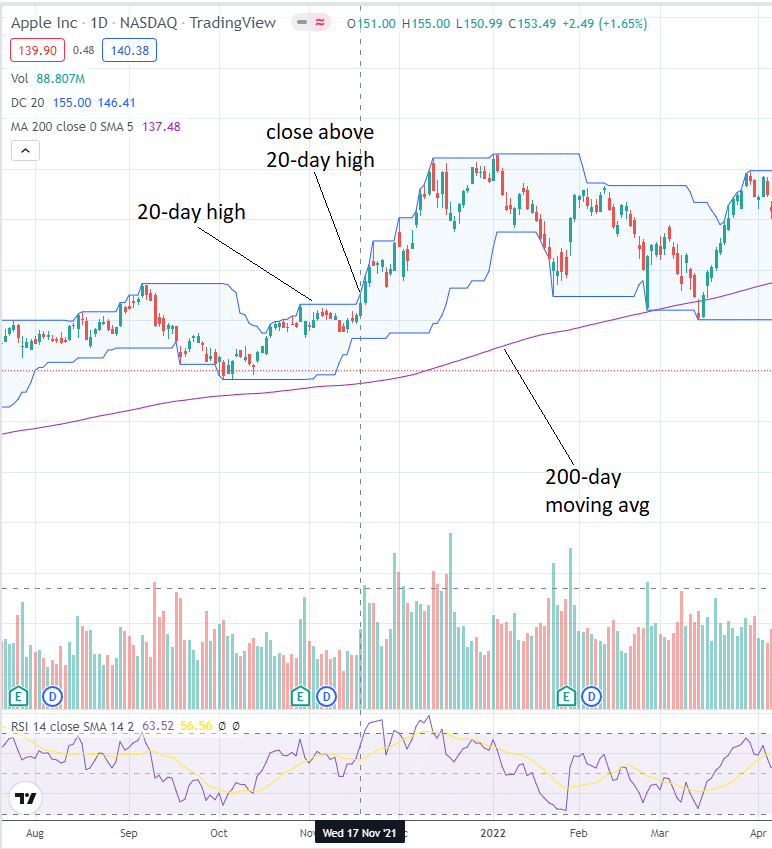
source: TradingView.com
In addition, we also require that RSI be above 50 to indicate good momentum on the upside.
The above chart shows that Apple (AAPL) closed above the 20-day high on November 17, 2021, while the price is above its 200-day moving average and RSI in the upper half of its range.
In this example, it did signal a true breakout.
Another distinction is to use the closing price and not just intraday prices.
For example, Apple (AAPL) broke the 20-day low on February 24, 2022:
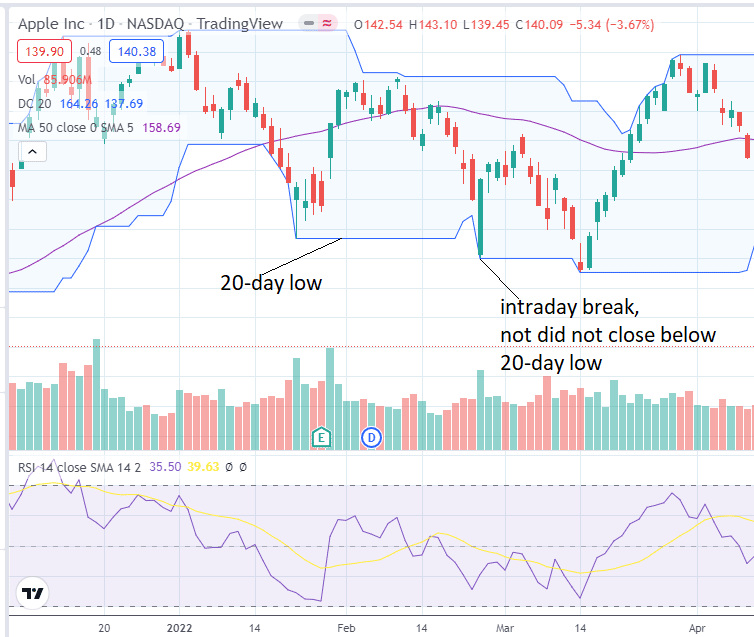
But it did not close below the 20-day low.
Many traders would not count this as a breakdown signal.
Former portfolio manager David Wozniak said in a webinar that his drop-dead signal to sell a stock is when it closes below the 20-day low — emphasizing the close rather than just intraday breaks.
Conclusion
Trading breakouts is a particular specialization of trading that requires some experience in order to master its many nuances.
Knowing when to take a breakout and when to be suspicious of it is a bit of an art.
Just like there are many ways to bake a cake, there are many ways to trade breakouts.
You have just seen a small sample of some of the ways breakout traders think, but it is by no means the only way to trade breakouts.
We hope you enjoyed this article on the breakout trading indicators.
If you have any questions, please send an email or leave a comment.
Trade safe!
Disclaimer: The information above is for educational purposes only and should not be treated as investment advice. The strategy presented would not be suitable for investors who are not familiar with exchange traded options. Any readers interested in this strategy should do their own research and seek advice from a licensed financial adviser.


